
 +91-22-48913909
Table of Contents
- ઇક્વિટી ફંડમાં શા માટે રોકાણ કરવું?
- ઇક્વિટી NAV
- ટોચના ઇક્વિટી મ્યુચ્યુઅલ ફંડ્સ 2022
- 5 શ્રેષ્ઠ લાર્જ કેપ ઇક્વિટી મ્યુચ્યુઅલ ફંડ્સ
- 5 શ્રેષ્ઠ મિડ કેપ ઇક્વિટી મ્યુચ્યુઅલ ફંડ્સ
- 5 શ્રેષ્ઠ સ્મોલ કેપ ઇક્વિટી મ્યુચ્યુઅલ ફંડ્સ
- 5 શ્રેષ્ઠ લાર્જ અને મિડ કેપ ઇક્વિટી મ્યુચ્યુઅલ ફંડ્સ
- 5 શ્રેષ્ઠ ઇક્વિટી લિંક્ડ સેવિંગ્સ સ્કીમ્સ (ELSS)
- 5 શ્રેષ્ઠ ડાઇવર્સિફાઇડ/મલ્ટી કેપ ઇક્વિટી મ્યુચ્યુઅલ ફંડ્સ
- 5 શ્રેષ્ઠ ક્ષેત્રના ઇક્વિટી મ્યુચ્યુઅલ ફંડ્સ
- 5 શ્રેષ્ઠ કેન્દ્રિત ઇક્વિટી ફંડ્સ
- 5 શ્રેષ્ઠ ડિવિડન્ડ યીલ્ડ ઇક્વિટી ફંડ્સ
- 5 શ્રેષ્ઠ મૂલ્ય ઇક્વિટી ફંડ્સ
- 2022 માટે શ્રેષ્ઠ ઇક્વિટી ફંડ્સ પસંદ કરવા માટે સ્માર્ટ ટિપ્સ
- ઇક્વિટી ફંડ ટેક્સેશન
- શ્રેષ્ઠ ઇક્વિટી મ્યુચ્યુઅલ ફંડમાં ઓનલાઇન કેવી રીતે રોકાણ કરવું?
- નિષ્કર્ષ
Top 6 Equity - Sectoral Funds
શ્રેષ્ઠ ઇક્વિટી મ્યુચ્યુઅલ ફંડ્સ 2022 - 2023
ઇક્વિટી ફંડ એ એક મ્યુચ્યુઅલ ફંડ છે જે મુખ્યત્વે શેરોમાં રોકાણ કરે છે. તે સક્રિય અથવા નિષ્ક્રિય રીતે (ઇન્ડેક્સ ફંડ) મેનેજ કરી શકાય છે. આને સ્ટોક ફંડ તરીકે પણ ઓળખવામાં આવે છે.
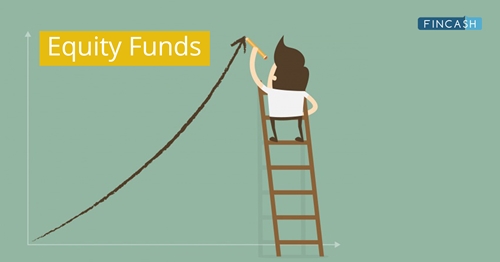
ઇક્વિટી ફંડ્સ જ્યારે પસંદગીનું વાહન હોવું જોઈએરોકાણ લાંબા ગાળાના ધ્યેયો માટે કારણ કે તેઓએ છેલ્લા કેટલાક વર્ષોમાં રોકાણકારો માટે ભારે નફો કર્યો છે. પરંતુ રોકાણકારો સમક્ષ વિશાળ પસંદગી હોવાથી, યોગ્ય ઇક્વિટી ફંડ પસંદ કરવું મહત્વપૂર્ણ બની જાય છે.
યોગ્ય ગુણાત્મક અને જથ્થાત્મક પગલાં (નીચે ચર્ચા કરેલ) સાથે, વ્યક્તિ આદર્શ રીતે શ્રેષ્ઠ ઇક્વિટી પસંદ કરી શકે છે.મ્યુચ્યુઅલ ફંડ રોકાણ કરવું.
ઇક્વિટી ફંડમાં શા માટે રોકાણ કરવું?
1. પ્રવાહિતા
તમામ મોટા એક્સચેન્જોમાં શેરોનો સક્રિયપણે વેપાર થતો હોવાથી, દરરોજ, આ ઇક્વિટી ફંડને અત્યંત પ્રવાહી રોકાણ બનાવે છે. તે રોકાણકારોને, તેના આધારે તેમના શેરો ખરીદવા અને વેચવાની સગવડ પૂરી પાડે છેબજાર પરિસ્થિતિ ઇક્વિટી મ્યુચ્યુઅલ ફંડમાં રોકાણ કરીને, પૈસા સામાન્ય રીતે તમારામાં જમા થાય છેબેંક 3 દિવસમાં એકાઉન્ટ.
2. ડિવિડન્ડ આવક
બ્લુ-ચિપ કંપનીઓમાં રોકાણ કરવાથી રોકાણકારોને સ્થિર કમાણી કરવામાં મદદ મળી શકે છેઆવક ડિવિડન્ડના સ્વરૂપમાં. આવી મોટાભાગની કંપનીઓ સામાન્ય રીતે બજારની અસ્થિર સ્થિતિમાં પણ નિયમિત ડિવિડન્ડ ચૂકવે છે, સામાન્ય રીતે ત્રિમાસિક ચૂકવવામાં આવે છે. વૈવિધ્યસભર પોર્ટફોલિયો રાખવાથી રોકાણકારોને વર્ષમાં સ્થિર ડિવિડન્ડની આવક મળી શકે છે.
3. પોર્ટફોલિયો વૈવિધ્યકરણ
શ્રેષ્ઠ ઇક્વિટી મ્યુચ્યુઅલ ફંડ્સ સાથે રોકાણકારો નિયમિતપણે રોકાણ કરીને તેમના પોર્ટફોલિયોમાં વિવિધતા લાવી શકે છે. તેનો અર્થ એ છે કે તેઓ વિવિધ આર્થિક ક્ષેત્રોના શેરોમાં રોકાણ કરી શકે છે. તેથી, જો કોઈ ચોક્કસ શેરનું મૂલ્ય ઘટે તો પણ, બજારની સ્થિતિના આધારે અન્ય રોકાણકારોને તે નુકસાનની ભરપાઈ કરવામાં મદદ કરી શકે છે.
4. આદર્શ રોકાણ વાહન
ઘણી રીતે, ઇક્વિટી ફંડ એવા રોકાણકારો માટે આદર્શ રોકાણ વાહન છે કે જેઓ નાણાકીય રોકાણમાં સારી રીતે વાકેફ નથી અથવા તેમની પાસે મોટી રકમ નથી.પાટનગર જેની સાથે રોકાણ કરવું. તેઓ મોટાભાગના લોકો માટે વ્યવહારુ રોકાણ છે.
નાના વ્યક્તિગત રોકાણકારો માટે ઇક્વિટી ફંડને સૌથી યોગ્ય બનાવે છે તે લક્ષણો ફંડના પોર્ટફોલિયોના વૈવિધ્યકરણના પરિણામે જોખમમાં ઘટાડો અને ઇક્વિટી ફંડના શેરો મેળવવા માટે જરૂરી પ્રમાણમાં ઓછી મૂડી છે. વ્યક્તિ માટે મોટી માત્રામાં રોકાણ મૂડીની જરૂર પડશેરોકાણકાર ડાયરેક્ટ સ્ટોક હોલ્ડિંગના પોર્ટફોલિયોના વૈવિધ્યકરણ દ્વારા જોખમ ઘટાડવાની સમાન ડિગ્રી હાંસલ કરવા. નાના રોકાણકારોની મૂડીનું એકત્રીકરણ ઇક્વિટી ફંડને મોટી મૂડીની જરૂરિયાતો સાથે દરેક રોકાણકાર પર બોજ નાખ્યા વિના અસરકારક રીતે વૈવિધ્યીકરણ કરવાની મંજૂરી આપે છે.
ઇક્વિટી NAV
ઇક્વિટી ફંડની કિંમત ફંડની નેટ એસેટ વેલ્યુ પર આધારિત છે (નથી) તેની જવાબદારીઓ ઓછી. વધુ વૈવિધ્યસભર ફંડનો અર્થ એ છે કે એકંદર પોર્ટફોલિયો પર અને ઇક્વિટી ફંડના શેરની કિંમત પર વ્યક્તિગત શેરની પ્રતિકૂળ કિંમતની હિલચાલની ઓછી નકારાત્મક અસર પડે છે.
ઇક્વિટી ફંડ્સનું સંચાલન અનુભવી પ્રોફેશનલ પોર્ટફોલિયો મેનેજર દ્વારા કરવામાં આવે છે અને તેમની ભૂતકાળની કામગીરી જાહેર રેકોર્ડની બાબત છે. ઇક્વિટી ફંડ્સ માટેની પારદર્શિતા અને રિપોર્ટિંગ આવશ્યકતાઓ ભારતીય સિક્યોરિટી એક્સચેન્જ બોર્ડ દ્વારા ભારે રીતે નિયંત્રિત કરવામાં આવે છે (સેબી)
Talk to our investment specialist
ટોચના ઇક્વિટી મ્યુચ્યુઅલ ફંડ્સ 2022
શ્રેષ્ઠ ઇક્વિટી મ્યુચ્યુઅલ ફંડને તેના પ્રકારો અનુસાર વર્ગીકૃત કરવામાં આવે છે-ELSS,લાર્જ કેપ ફંડ્સ,મિડ કેપ ફંડ્સ,સ્મોલ કેપ ફંડ્સ,વૈવિધ્યસભર ભંડોળ,ક્ષેત્ર ભંડોળ અનેસંતુલિત ભંડોળ.
5 શ્રેષ્ઠ લાર્જ કેપ ઇક્વિટી મ્યુચ્યુઅલ ફંડ્સ
Fund NAV Net Assets (Cr) 3 MO (%) 6 MO (%) 1 YR (%) 3 YR (%) 5 YR (%) 2023 (%) Nippon India Large Cap Fund Growth ₹79.4991
↑ 0.15 ₹24,378 9 23.9 43.9 26.4 17.6 32.1 HDFC Top 100 Fund Growth ₹1,033.34
↑ 2.81 ₹32,355 5.1 21.3 37.3 22.6 15.6 30 ICICI Prudential Bluechip Fund Growth ₹96.37
↑ 0.28 ₹53,505 7 23.7 40.8 22.5 17.8 27.4 BNP Paribas Large Cap Fund Growth ₹200.307
↑ 0.72 ₹1,863 10.1 25.9 40.3 20.2 18 24.8 TATA Large Cap Fund Growth ₹451.877
↑ 1.50 ₹2,019 7.1 22.4 34.3 19 15.6 24.5 Note: Returns up to 1 year are on absolute basis & more than 1 year are on CAGR basis. as on 24 Apr 24
5 શ્રેષ્ઠ મિડ કેપ ઇક્વિટી મ્યુચ્યુઅલ ફંડ્સ
Fund NAV Net Assets (Cr) 3 MO (%) 6 MO (%) 1 YR (%) 3 YR (%) 5 YR (%) 2023 (%) Motilal Oswal Midcap 30 Fund Growth ₹81.999
↓ -0.27 ₹8,987 10.9 33.7 62.7 37.7 26.6 41.7 Edelweiss Mid Cap Fund Growth ₹79.939
↑ 0.74 ₹5,115 7.9 29.5 54.4 27.2 25 38.4 ICICI Prudential MidCap Fund Growth ₹251.03
↑ 1.91 ₹5,517 10 33.7 56.1 26.2 21.3 32.8 Invesco India Mid Cap Fund Growth ₹134.54
↑ 1.24 ₹4,280 9.3 27.9 52.5 26 22.6 34.1 TATA Mid Cap Growth Fund Growth ₹383.332
↑ 2.41 ₹3,348 9.2 26.4 56.6 25.4 22.6 40.5 Note: Returns up to 1 year are on absolute basis & more than 1 year are on CAGR basis. as on 24 Apr 24
5 શ્રેષ્ઠ સ્મોલ કેપ ઇક્વિટી મ્યુચ્યુઅલ ફંડ્સ
Fund NAV Net Assets (Cr) 3 MO (%) 6 MO (%) 1 YR (%) 3 YR (%) 5 YR (%) 2023 (%) Nippon India Small Cap Fund Growth ₹150.856
↑ 0.88 ₹45,749 7.9 25.9 60 36 30.3 48.9 L&T Emerging Businesses Fund Growth ₹74.1453
↑ 0.59 ₹13,401 5.7 22.2 51.9 33.8 24.8 46.1 Franklin India Smaller Companies Fund Growth ₹157.715
↑ 0.94 ₹11,540 6.5 26 59.5 33.7 23.8 52.1 HDFC Small Cap Fund Growth ₹124.232
↑ 0.42 ₹27,574 5.3 21.1 51.8 32.5 23.3 44.8 ICICI Prudential Smallcap Fund Growth ₹78.47
↑ 0.51 ₹7,173 4 18.6 45.6 29.9 25.9 37.9 Note: Returns up to 1 year are on absolute basis & more than 1 year are on CAGR basis. as on 24 Apr 24
5 શ્રેષ્ઠ લાર્જ અને મિડ કેપ ઇક્વિટી મ્યુચ્યુઅલ ફંડ્સ
Fund NAV Net Assets (Cr) 3 MO (%) 6 MO (%) 1 YR (%) 3 YR (%) 5 YR (%) 2023 (%) ICICI Prudential Large & Mid Cap Fund Growth ₹850.65
↑ 3.91 ₹12,307 9.8 26.7 47.4 28.2 21.3 29.9 HDFC Growth Opportunities Fund Growth ₹297.167
↑ 1.49 ₹17,314 6.7 25.5 50.1 27.5 21.1 37.7 IDFC Core Equity Fund Growth ₹113.69
↑ 0.69 ₹4,023 10 31.2 57.1 26.7 20.4 36.2 UTI Core Equity Fund Growth ₹150.547
↑ 0.58 ₹2,759 8.6 24.7 47.7 24.5 19.3 34.4 Kotak Equity Opportunities Fund Growth ₹298.52
↑ 2.07 ₹19,861 10.8 24.7 44.2 22.8 20 29.3 Note: Returns up to 1 year are on absolute basis & more than 1 year are on CAGR basis. as on 24 Apr 24
5 શ્રેષ્ઠ ઇક્વિટી લિંક્ડ સેવિંગ્સ સ્કીમ્સ (ELSS)
Fund NAV Net Assets (Cr) 3 MO (%) 6 MO (%) 1 YR (%) 3 YR (%) 5 YR (%) 2023 (%) SBI Magnum Tax Gain Fund Growth ₹384.424
↑ 2.59 ₹21,976 12.1 34.3 60.8 28.9 21.6 40 HDFC Tax Saver Fund Growth ₹1,187.1
↑ 7.83 ₹13,990 7.5 26 46.4 27.6 17.7 33.2 Motilal Oswal Long Term Equity Fund Growth ₹43.7475
↑ 0.21 ₹3,205 14.5 36.8 60.7 26.6 20.9 37 BOI AXA Tax Advantage Fund Growth ₹156.03
↑ 0.97 ₹1,210 12.9 36.4 55.4 25.4 25.5 34.8 Franklin India Taxshield Growth ₹1,294.47
↑ 6.01 ₹6,180 7 24.1 46 24 17.8 31.2 Note: Returns up to 1 year are on absolute basis & more than 1 year are on CAGR basis. as on 24 Apr 24
5 શ્રેષ્ઠ ડાઇવર્સિફાઇડ/મલ્ટી કેપ ઇક્વિટી મ્યુચ્યુઅલ ફંડ્સ
Fund NAV Net Assets (Cr) 3 MO (%) 6 MO (%) 1 YR (%) 3 YR (%) 5 YR (%) 2023 (%) Nippon India Multi Cap Fund Growth ₹257.321
↑ 1.20 ₹27,746 11.5 26 55.2 32.8 21.1 38.1 JM Multicap Fund Growth ₹89.5483
↑ 0.39 ₹1,774 13.2 32.8 62.9 29.6 23.4 40 HDFC Equity Fund Growth ₹1,639.21
↑ 9.48 ₹50,840 7.7 25 43.9 28.2 19.5 30.6 Mahindra Badhat Yojana Growth ₹31.0097
↑ 0.17 ₹3,165 5.9 26.1 53 26.6 23.5 34.2 ICICI Prudential Multicap Fund Growth ₹692.5
↑ 2.51 ₹11,342 8.2 26.1 50.7 25.7 18.6 35.4 Note: Returns up to 1 year are on absolute basis & more than 1 year are on CAGR basis. as on 24 Apr 24
5 શ્રેષ્ઠ ક્ષેત્રના ઇક્વિટી મ્યુચ્યુઅલ ફંડ્સ
Fund NAV Net Assets (Cr) 3 MO (%) 6 MO (%) 1 YR (%) 3 YR (%) 5 YR (%) 2023 (%) SBI PSU Fund Growth ₹30.3912
↑ 0.42 ₹1,876 16.9 60.3 94.3 43.3 24.3 54 Invesco India PSU Equity Fund Growth ₹57.93
↑ 0.75 ₹859 17.2 52.7 86.5 39.8 27.5 54.5 HDFC Infrastructure Fund Growth ₹43.562
↑ 0.24 ₹1,663 13.6 36.9 83 41.5 21 55.4 IDFC Infrastructure Fund Growth ₹46.192
↑ 0.54 ₹1,043 17.7 45.4 81.3 37 25.2 50.3 Nippon India Power and Infra Fund Growth ₹322.65
↑ 2.14 ₹4,529 13.8 42.2 80.9 40 26.8 58 Note: Returns up to 1 year are on absolute basis & more than 1 year are on CAGR basis. as on 24 Apr 24
5 શ્રેષ્ઠ કેન્દ્રિત ઇક્વિટી ફંડ્સ
Fund NAV Net Assets (Cr) 3 MO (%) 6 MO (%) 1 YR (%) 3 YR (%) 5 YR (%) 2023 (%) HDFC Focused 30 Fund Growth ₹189.147
↑ 0.94 ₹10,433 7.9 24 41.6 29.9 19.6 29.6 ICICI Prudential Focused Equity Fund Growth ₹74.96
↑ 0.15 ₹7,583 10 26.9 46.2 24.6 19.6 28.3 Franklin India Focused Equity Fund Growth ₹95.9092
↑ 0.30 ₹11,160 7.8 22.2 40.3 23.2 18.2 23.5 IIFL Focused Equity Fund Growth ₹42.6723
↑ 0.12 ₹6,794 8.6 21.6 39 22.4 21.9 29.8 Nippon India Focused Equity Fund Growth ₹104.631
↑ 0.34 ₹7,608 2.9 15.2 33.2 18.9 17 27.1 Note: Returns up to 1 year are on absolute basis & more than 1 year are on CAGR basis. as on 24 Apr 24
5 શ્રેષ્ઠ ડિવિડન્ડ યીલ્ડ ઇક્વિટી ફંડ્સ
Fund NAV Net Assets (Cr) 3 MO (%) 6 MO (%) 1 YR (%) 3 YR (%) 5 YR (%) 2023 (%) ICICI Prudential Dividend Yield Equity Fund Growth ₹45.74
↑ 0.28 ₹3,626 10.6 31 55 32.8 22 38.8 Aditya Birla Sun Life Dividend Yield Fund Growth ₹408.81
↑ 2.21 ₹1,271 7.2 28.2 51.3 26.9 20.8 40.3 Templeton India Equity Income Fund Growth ₹127.177
↑ 1.15 ₹2,075 8.9 29.1 42.8 25.8 21.8 33.3 Principal Dividend Yield Fund Growth ₹125.31
↑ 0.31 ₹805 5.8 26 44 21.5 18.5 34 UTI Dividend Yield Fund Growth ₹148.843
↑ 0.78 ₹3,586 6.9 24 45.4 21.4 17.8 35.4 Note: Returns up to 1 year are on absolute basis & more than 1 year are on CAGR basis. as on 24 Apr 24
5 શ્રેષ્ઠ મૂલ્ય ઇક્વિટી ફંડ્સ
Fund NAV Net Assets (Cr) 3 MO (%) 6 MO (%) 1 YR (%) 3 YR (%) 5 YR (%) 2023 (%) JM Value Fund Growth ₹90.0581
↑ 0.41 ₹581 6.5 30.1 64.1 30.4 22.8 47.7 Templeton India Value Fund Growth ₹652.786
↑ 3.75 ₹1,820 8.5 25 44.7 29.2 20.3 33.7 L&T India Value Fund Growth ₹94.2144
↑ 0.44 ₹11,431 9.2 28.8 54.1 28 21.3 39.4 Nippon India Value Fund Growth ₹198.14
↑ 0.86 ₹7,107 8.7 32.1 59.5 27.9 21.8 42.4 ICICI Prudential Value Discovery Fund Growth ₹398.4
↑ 0.76 ₹41,282 7.7 23.5 43.8 27.5 22.3 31.4 Note: Returns up to 1 year are on absolute basis & more than 1 year are on CAGR basis. as on 24 Apr 24
*નીચેની યાદી છેઇક્વિટી ફંડ્સ કર્યાAUM >= 50 કરોડ શ્રેષ્ઠ વળતર ધરાવે છેછેલ્લા 1 વર્ષ.
The objective of the scheme would be to provide investors with opportunities for long-term growth in capital along with the liquidity of an open-ended scheme through an active management of investments in a diversified basket of equity stocks of domestic Public Sector Undertakings and in debt and money market instruments issued by PSUs AND others. SBI PSU Fund is a Equity - Sectoral fund was launched on 7 Jul 10. It is a fund with High risk and has given a Below is the key information for SBI PSU Fund Returns up to 1 year are on To generate capital appreciation by investing in Equity and Equity Related Instruments of companies where the Central / State Government(s) has majority shareholding or management control or has powers to appoint majority of directors. However, there is no assurance or guarantee that the investment objective of the Scheme will be achieved. The Scheme does not assure or guarantee any returns. Invesco India PSU Equity Fund is a Equity - Sectoral fund was launched on 18 Nov 09. It is a fund with High risk and has given a Below is the key information for Invesco India PSU Equity Fund Returns up to 1 year are on To seek long-term capital appreciation by investing predominantly in equity and equity related securities of companies engaged in or expected to benefit from growth and development of infrastructure. HDFC Infrastructure Fund is a Equity - Sectoral fund was launched on 10 Mar 08. It is a fund with High risk and has given a Below is the key information for HDFC Infrastructure Fund Returns up to 1 year are on The investment objective of the scheme is to seek to generate long-term capital growth through an active diversified portfolio of predominantly equity and equity related instruments of companies that are participating in and benefiting from growth in Indian infrastructure and infrastructural related activities. However, there can be no assurance that the investment objective of the scheme will be realized. IDFC Infrastructure Fund is a Equity - Sectoral fund was launched on 8 Mar 11. It is a fund with High risk and has given a Below is the key information for IDFC Infrastructure Fund Returns up to 1 year are on (Erstwhile Reliance Diversified Power Sector Fund) The primary investment objective of the scheme is to generate long term capital appreciation by investing predominantly in equity and equity related securities of companies in the power sector. Nippon India Power and Infra Fund is a Equity - Sectoral fund was launched on 8 May 04. It is a fund with High risk and has given a Below is the key information for Nippon India Power and Infra Fund Returns up to 1 year are on The Scheme seeks to achieve capital appreciation by investing in companies engaged directly or indirectly in infrastructure related activities. Franklin Build India Fund is a Equity - Sectoral fund was launched on 4 Sep 09. It is a fund with High risk and has given a Below is the key information for Franklin Build India Fund Returns up to 1 year are on 1. SBI PSU Fund
CAGR/Annualized return of 8.4% since its launch. Ranked 31 in Sectoral category. Return for 2023 was 54% , 2022 was 29% and 2021 was 32.4% . SBI PSU Fund
Growth Launch Date 7 Jul 10 NAV (24 Apr 24) ₹30.3912 ↑ 0.42 (1.39 %) Net Assets (Cr) ₹1,876 on 31 Mar 24 Category Equity - Sectoral AMC SBI Funds Management Private Limited Rating ☆☆ Risk High Expense Ratio 2.52 Sharpe Ratio 2.62 Information Ratio -1.01 Alpha Ratio -9.05 Min Investment 5,000 Min SIP Investment 500 Exit Load 0-1 Years (1%),1 Years and above(NIL) Growth of 10,000 investment over the years.
Date Value 31 Mar 19 ₹10,000 31 Mar 20 ₹7,245 31 Mar 21 ₹10,059 31 Mar 22 ₹12,594 31 Mar 23 ₹14,369 31 Mar 24 ₹26,864 Returns for SBI PSU Fund
absolute basis & more than 1 year are on CAGR (Compound Annual Growth Rate) basis. as on 24 Apr 24 Duration Returns 1 Month 9.6% 3 Month 16.9% 6 Month 60.3% 1 Year 94.3% 3 Year 43.3% 5 Year 24.3% 10 Year 15 Year Since launch 8.4% Historical performance (Yearly) on absolute basis
Year Returns 2023 54% 2022 29% 2021 32.4% 2020 -10% 2019 6% 2018 -23.8% 2017 21.9% 2016 16.2% 2015 -11.1% 2014 41.5% Fund Manager information for SBI PSU Fund
Name Since Tenure Richard D'souza 1 Aug 14 9.67 Yr. Data below for SBI PSU Fund as on 31 Mar 24
Equity Sector Allocation
Sector Value Financial Services 36.97% Utility 19.35% Industrials 12.44% Energy 12.3% Basic Materials 12.24% Asset Allocation
Asset Class Value Cash 6.7% Equity 93.3% Top Securities Holdings / Portfolio
Name Holding Value Quantity State Bank of India (Financial Services)
Equity, Since 31 Jul 10 | SBIN10% ₹170 Cr 2,277,500 NTPC Ltd (Utilities)
Equity, Since 31 Jul 10 | 5325558% ₹146 Cr 4,343,244
↑ 1,500,000 Power Grid Corp Of India Ltd (Utilities)
Equity, Since 31 Jul 10 | 5328987% ₹128 Cr 4,535,554
↑ 1,200,000 Oil & Natural Gas Corp Ltd (Energy)
Equity, Since 31 May 20 | 5003125% ₹91 Cr 3,455,000 Housing & Urban Development Corp Ltd (Financial Services)
Equity, Since 30 Nov 22 | 5405305% ₹83 Cr 4,350,000 RITES Ltd Ordinary Shares (Industrials)
Equity, Since 31 Oct 22 | RITES4% ₹73 Cr 930,000
↑ 235,000 Indian Oil Corp Ltd (Energy)
Equity, Since 31 Aug 15 | IOC4% ₹71 Cr 4,281,804
↑ 3,000,000 Bharat Heavy Electricals Ltd (Industrials)
Equity, Since 31 Jul 23 | 5001034% ₹68 Cr 3,000,000 NHPC Ltd (Utilities)
Equity, Since 31 Jan 24 | NHPC4% ₹67 Cr 7,600,000
↑ 4,100,000 Punjab National Bank (Financial Services)
Equity, Since 31 Dec 19 | 5324614% ₹66 Cr 5,425,000 2. Invesco India PSU Equity Fund
CAGR/Annualized return of 12.9% since its launch. Ranked 33 in Sectoral category. Return for 2023 was 54.5% , 2022 was 20.5% and 2021 was 31.1% . Invesco India PSU Equity Fund
Growth Launch Date 18 Nov 09 NAV (24 Apr 24) ₹57.93 ↑ 0.75 (1.31 %) Net Assets (Cr) ₹859 on 31 Mar 24 Category Equity - Sectoral AMC Invesco Asset Management (India) Private Ltd Rating ☆☆☆ Risk High Expense Ratio 2.46 Sharpe Ratio 3.07 Information Ratio -1.18 Alpha Ratio -0.44 Min Investment 5,000 Min SIP Investment 500 Exit Load 0-1 Years (1%),1 Years and above(NIL) Growth of 10,000 investment over the years.
Date Value 31 Mar 19 ₹10,000 31 Mar 20 ₹8,584 31 Mar 21 ₹12,144 31 Mar 22 ₹14,910 31 Mar 23 ₹16,919 31 Mar 24 ₹31,021 Returns for Invesco India PSU Equity Fund
absolute basis & more than 1 year are on CAGR (Compound Annual Growth Rate) basis. as on 24 Apr 24 Duration Returns 1 Month 7.5% 3 Month 17.2% 6 Month 52.7% 1 Year 86.5% 3 Year 39.8% 5 Year 27.5% 10 Year 15 Year Since launch 12.9% Historical performance (Yearly) on absolute basis
Year Returns 2023 54.5% 2022 20.5% 2021 31.1% 2020 6.1% 2019 10.1% 2018 -16.9% 2017 24.3% 2016 17.9% 2015 2.5% 2014 54.5% Fund Manager information for Invesco India PSU Equity Fund
Name Since Tenure Dhimant Kothari 19 May 20 3.87 Yr. Data below for Invesco India PSU Equity Fund as on 31 Mar 24
Equity Sector Allocation
Sector Value Utility 27.18% Industrials 25.7% Financial Services 25.62% Energy 19.79% Asset Allocation
Asset Class Value Cash 1.71% Equity 98.29% Top Securities Holdings / Portfolio
Name Holding Value Quantity Bharat Electronics Ltd (Industrials)
Equity, Since 31 Mar 17 | BEL9% ₹78 Cr 3,801,222
↑ 62,232 NTPC Ltd (Utilities)
Equity, Since 31 May 19 | 5325559% ₹76 Cr 2,254,157
↑ 16,754 State Bank of India (Financial Services)
Equity, Since 28 Feb 21 | SBIN9% ₹73 Cr 975,626
↓ -5,256 Coal India Ltd (Energy)
Equity, Since 31 Aug 23 | COALINDIA8% ₹67 Cr 1,526,429
↓ -106,386 Power Grid Corp Of India Ltd (Utilities)
Equity, Since 28 Feb 22 | 5328987% ₹60 Cr 2,126,667
↑ 477,183 Bharat Petroleum Corp Ltd (Energy)
Equity, Since 30 Sep 18 | 5005476% ₹50 Cr 833,087 Hindustan Aeronautics Ltd Ordinary Shares (Industrials)
Equity, Since 31 May 22 | HAL6% ₹49 Cr 157,644 NHPC Ltd (Utilities)
Equity, Since 31 Oct 22 | NHPC6% ₹48 Cr 5,435,618
↑ 144,875 Bank of Baroda (Financial Services)
Equity, Since 30 Jun 21 | 5321345% ₹38 Cr 1,431,527 Container Corporation of India Ltd (Industrials)
Equity, Since 31 Mar 17 | CONCOR4% ₹38 Cr 386,333 3. HDFC Infrastructure Fund
CAGR/Annualized return of since its launch. Ranked 26 in Sectoral category. Return for 2023 was 55.4% , 2022 was 19.3% and 2021 was 43.2% . HDFC Infrastructure Fund
Growth Launch Date 10 Mar 08 NAV (24 Apr 24) ₹43.562 ↑ 0.24 (0.56 %) Net Assets (Cr) ₹1,663 on 31 Mar 24 Category Equity - Sectoral AMC HDFC Asset Management Company Limited Rating ☆☆☆ Risk High Expense Ratio 2.56 Sharpe Ratio 4.42 Information Ratio 0 Alpha Ratio 0 Min Investment 5,000 Min SIP Investment 300 Exit Load 0-1 Years (1%),1 Years and above(NIL) Growth of 10,000 investment over the years.
Date Value 31 Mar 19 ₹10,000 31 Mar 20 ₹5,234 31 Mar 21 ₹9,084 31 Mar 22 ₹11,372 31 Mar 23 ₹13,231 31 Mar 24 ₹23,733 Returns for HDFC Infrastructure Fund
absolute basis & more than 1 year are on CAGR (Compound Annual Growth Rate) basis. as on 24 Apr 24 Duration Returns 1 Month 7.1% 3 Month 13.6% 6 Month 36.9% 1 Year 83% 3 Year 41.5% 5 Year 21% 10 Year 15 Year Since launch Historical performance (Yearly) on absolute basis
Year Returns 2023 55.4% 2022 19.3% 2021 43.2% 2020 -7.5% 2019 -3.4% 2018 -29% 2017 43.3% 2016 -1.9% 2015 -2.5% 2014 73.9% Fund Manager information for HDFC Infrastructure Fund
Name Since Tenure Srinivasan Ramamurthy 12 Jan 24 0.22 Yr. Dhruv Muchhal 22 Jun 23 0.78 Yr. Data below for HDFC Infrastructure Fund as on 31 Mar 24
Equity Sector Allocation
Sector Value Industrials 39.92% Financial Services 19.36% Basic Materials 8.4% Energy 6.79% Utility 4.35% Communication Services 3.49% Consumer Cyclical 2.68% Technology 1.83% Real Estate 1.18% Asset Allocation
Asset Class Value Cash 10.58% Equity 88.01% Debt 1.41% Top Securities Holdings / Portfolio
Name Holding Value Quantity ICICI Bank Ltd (Financial Services)
Equity, Since 31 Oct 09 | ICICIBANK7% ₹113 Cr 1,075,000 J Kumar Infraprojects Ltd (Industrials)
Equity, Since 31 Oct 15 | JKIL6% ₹97 Cr 1,500,000
↓ -113,625 Coal India Ltd (Energy)
Equity, Since 31 Oct 18 | COALINDIA5% ₹83 Cr 1,900,000
↓ -265,000 Larsen & Toubro Ltd (Industrials)
Equity, Since 30 Jun 12 | LT5% ₹73 Cr 209,762 NTPC Ltd (Utilities)
Equity, Since 31 Dec 17 | 5325554% ₹70 Cr 2,084,125 Kalpataru Projects International Ltd (Industrials)
Equity, Since 31 Jan 23 | KPIL4% ₹66 Cr 683,608 Bharti Airtel Ltd (Communication Services)
Equity, Since 30 Sep 20 | BHARTIARTL3% ₹56 Cr 500,000
↑ 360,000 HDFC Bank Ltd (Financial Services)
Equity, Since 31 Aug 23 | HDFCBANK3% ₹56 Cr 400,000
↑ 50,000 State Bank of India (Financial Services)
Equity, Since 31 Mar 08 | SBIN3% ₹53 Cr 704,361 Inox Wind Ltd (Industrials)
Equity, Since 31 Oct 23 | INOXWIND3% ₹42 Cr 700,000
↓ -266,489 4. IDFC Infrastructure Fund
CAGR/Annualized return of 12.4% since its launch. Ranked 1 in Sectoral category. Return for 2023 was 50.3% , 2022 was 1.7% and 2021 was 64.8% . IDFC Infrastructure Fund
Growth Launch Date 8 Mar 11 NAV (24 Apr 24) ₹46.192 ↑ 0.54 (1.19 %) Net Assets (Cr) ₹1,043 on 31 Mar 24 Category Equity - Sectoral AMC IDFC Asset Management Company Limited Rating ☆☆☆☆☆ Risk High Expense Ratio 2.44 Sharpe Ratio 3.82 Information Ratio 0 Alpha Ratio 0 Min Investment 5,000 Min SIP Investment 100 Exit Load 0-365 Days (1%),365 Days and above(NIL) Growth of 10,000 investment over the years.
Date Value 31 Mar 19 ₹10,000 31 Mar 20 ₹6,016 31 Mar 21 ₹12,123 31 Mar 22 ₹14,948 31 Mar 23 ₹16,437 31 Mar 24 ₹28,313 Returns for IDFC Infrastructure Fund
absolute basis & more than 1 year are on CAGR (Compound Annual Growth Rate) basis. as on 24 Apr 24 Duration Returns 1 Month 9.3% 3 Month 17.7% 6 Month 45.4% 1 Year 81.3% 3 Year 37% 5 Year 25.2% 10 Year 15 Year Since launch 12.4% Historical performance (Yearly) on absolute basis
Year Returns 2023 50.3% 2022 1.7% 2021 64.8% 2020 6.3% 2019 -5.3% 2018 -25.9% 2017 58.7% 2016 10.7% 2015 -0.2% 2014 43.2% Fund Manager information for IDFC Infrastructure Fund
Name Since Tenure Vishal Biraia 24 Jan 24 0.19 Yr. Ritika Behera 7 Oct 23 0.48 Yr. Data below for IDFC Infrastructure Fund as on 31 Mar 24
Equity Sector Allocation
Sector Value Industrials 53.38% Basic Materials 15.57% Utility 10.81% Consumer Cyclical 5.48% Communication Services 3.56% Technology 2.75% Health Care 1.85% Financial Services 1.1% Asset Allocation
Asset Class Value Cash 5.5% Equity 94.5% Top Securities Holdings / Portfolio
Name Holding Value Quantity Larsen & Toubro Ltd (Industrials)
Equity, Since 29 Feb 12 | LT6% ₹57 Cr 163,980
↓ -75,139 Ahluwalia Contracts (India) Ltd (Industrials)
Equity, Since 30 Apr 15 | AHLUCONT5% ₹51 Cr 431,238 Torrent Power Ltd (Utilities)
Equity, Since 31 Mar 18 | 5327795% ₹48 Cr 442,900 UltraTech Cement Ltd (Basic Materials)
Equity, Since 31 Mar 14 | ULTRACEMCO4% ₹44 Cr 44,530
↓ -7,257 Kirloskar Brothers Ltd (Industrials)
Equity, Since 31 Dec 17 | KIRLOSBROS4% ₹43 Cr 466,186 Bharat Electronics Ltd (Industrials)
Equity, Since 31 Oct 19 | BEL4% ₹42 Cr 2,028,839
↓ -635,761 JK Cement Ltd (Basic Materials)
Equity, Since 31 Oct 17 | JKCEMENT4% ₹41 Cr 91,403
↓ -5,477 GPT Infraprojects Ltd (Industrials)
Equity, Since 30 Nov 17 | GPTINFRA3% ₹30 Cr 1,619,950 Jindal Steel & Power Ltd (Basic Materials)
Equity, Since 31 Mar 18 | 5322863% ₹28 Cr 366,666 ITD Cementation India Ltd (Industrials)
Equity, Since 30 Jun 15 | 5094963% ₹28 Cr 843,106
↓ -128,598 5. Nippon India Power and Infra Fund
CAGR/Annualized return of 19% since its launch. Ranked 13 in Sectoral category. Return for 2023 was 58% , 2022 was 10.9% and 2021 was 48.9% . Nippon India Power and Infra Fund
Growth Launch Date 8 May 04 NAV (24 Apr 24) ₹322.65 ↑ 2.14 (0.67 %) Net Assets (Cr) ₹4,529 on 31 Mar 24 Category Equity - Sectoral AMC Nippon Life Asset Management Ltd. Rating ☆☆☆☆ Risk High Expense Ratio 2.23 Sharpe Ratio 3.98 Information Ratio 1.48 Alpha Ratio 11.98 Min Investment 5,000 Min SIP Investment 100 Exit Load 0-1 Years (1%),1 Years and above(NIL) Growth of 10,000 investment over the years.
Date Value 31 Mar 19 ₹10,000 31 Mar 20 ₹6,580 31 Mar 21 ₹12,215 31 Mar 22 ₹15,256 31 Mar 23 ₹17,694 31 Mar 24 ₹31,288 Returns for Nippon India Power and Infra Fund
absolute basis & more than 1 year are on CAGR (Compound Annual Growth Rate) basis. as on 24 Apr 24 Duration Returns 1 Month 6.6% 3 Month 13.8% 6 Month 42.2% 1 Year 80.9% 3 Year 40% 5 Year 26.8% 10 Year 15 Year Since launch 19% Historical performance (Yearly) on absolute basis
Year Returns 2023 58% 2022 10.9% 2021 48.9% 2020 10.8% 2019 -2.9% 2018 -21.1% 2017 61.7% 2016 0.1% 2015 0.3% 2014 50.8% Fund Manager information for Nippon India Power and Infra Fund
Name Since Tenure Sanjay Doshi 2 Jan 17 7.25 Yr. Kinjal Desai 25 May 18 5.86 Yr. Data below for Nippon India Power and Infra Fund as on 31 Mar 24
Equity Sector Allocation
Sector Value Industrials 37.72% Utility 14.4% Basic Materials 9.78% Energy 8.03% Communication Services 6.62% Consumer Cyclical 6.41% Technology 5.2% Real Estate 4.25% Health Care 1.82% Asset Allocation
Asset Class Value Cash 5.78% Equity 94.22% Top Securities Holdings / Portfolio
Name Holding Value Quantity Reliance Industries Ltd (Energy)
Equity, Since 30 Nov 18 | RELIANCE6% ₹270 Cr 925,000 Larsen & Toubro Ltd (Industrials)
Equity, Since 30 Nov 07 | LT6% ₹261 Cr 750,000
↑ 110,663 Bosch Ltd (Consumer Cyclical)
Equity, Since 31 Aug 21 | 5005306% ₹239 Cr 83,500 NTPC Ltd (Utilities)
Equity, Since 31 May 09 | 5325556% ₹235 Cr 7,000,000 UltraTech Cement Ltd (Basic Materials)
Equity, Since 31 Oct 19 | ULTRACEMCO5% ₹208 Cr 210,000
↑ 10,000 Kaynes Technology India Ltd (Industrials)
Equity, Since 30 Nov 22 | KAYNES5% ₹198 Cr 670,000
↑ 92,352 Bharti Airtel Ltd (Communication Services)
Equity, Since 30 Apr 18 | BHARTIARTL4% ₹169 Cr 1,500,000
↑ 150,000 Cyient DLM Ltd (Technology)
Equity, Since 31 Jul 23 | 5439333% ₹137 Cr 1,708,669
↑ 158,099 Honeywell Automation India Ltd (Industrials)
Equity, Since 31 Jan 24 | HONAUT3% ₹137 Cr 36,000
↑ 13,882 Container Corporation of India Ltd (Industrials)
Equity, Since 31 Aug 22 | CONCOR3% ₹125 Cr 1,274,151 6. Franklin Build India Fund
CAGR/Annualized return of 19% since its launch. Ranked 4 in Sectoral category. Return for 2023 was 51.1% , 2022 was 11.2% and 2021 was 45.9% . Franklin Build India Fund
Growth Launch Date 4 Sep 09 NAV (24 Apr 24) ₹127.1 ↑ 0.66 (0.52 %) Net Assets (Cr) ₹2,191 on 31 Mar 24 Category Equity - Sectoral AMC Franklin Templeton Asst Mgmt(IND)Pvt Ltd Rating ☆☆☆☆☆ Risk High Expense Ratio 2.29 Sharpe Ratio 3.77 Information Ratio 0 Alpha Ratio 0 Min Investment 5,000 Min SIP Investment 500 Exit Load 0-1 Years (1%),1 Years and above(NIL) Growth of 10,000 investment over the years.
Date Value 31 Mar 19 ₹10,000 31 Mar 20 ₹6,452 31 Mar 21 ₹11,641 31 Mar 22 ₹14,636 31 Mar 23 ₹16,473 31 Mar 24 ₹28,195 Returns for Franklin Build India Fund
absolute basis & more than 1 year are on CAGR (Compound Annual Growth Rate) basis. as on 24 Apr 24 Duration Returns 1 Month 6.7% 3 Month 13.1% 6 Month 39.2% 1 Year 76% 3 Year 38.2% 5 Year 24.5% 10 Year 15 Year Since launch 19% Historical performance (Yearly) on absolute basis
Year Returns 2023 51.1% 2022 11.2% 2021 45.9% 2020 5.4% 2019 6% 2018 -10.7% 2017 43.3% 2016 8.4% 2015 2.1% 2014 93.8% Fund Manager information for Franklin Build India Fund
Name Since Tenure Ajay Argal 18 Oct 21 2.45 Yr. Kiran Sebastian 7 Feb 22 2.15 Yr. Sandeep Manam 18 Oct 21 2.45 Yr. Data below for Franklin Build India Fund as on 31 Mar 24
Equity Sector Allocation
Sector Value Industrials 40.91% Utility 14.02% Financial Services 11.64% Energy 10.33% Basic Materials 5.39% Communication Services 4.95% Consumer Cyclical 4.22% Real Estate 3.57% Asset Allocation
Asset Class Value Cash 4.97% Equity 95.03% Top Securities Holdings / Portfolio
Name Holding Value Quantity Larsen & Toubro Ltd (Industrials)
Equity, Since 29 Feb 20 | LT10% ₹209 Cr 600,000
↑ 86,789 NTPC Ltd (Utilities)
Equity, Since 30 Nov 16 | 5325557% ₹154 Cr 4,600,000 Oil & Natural Gas Corp Ltd (Energy)
Equity, Since 30 Jun 19 | 5003126% ₹127 Cr 4,800,000 Power Grid Corp Of India Ltd (Utilities)
Equity, Since 28 Feb 21 | 5328985% ₹116 Cr 4,100,000 Kirloskar Oil Engines Ltd (Industrials)
Equity, Since 30 Nov 21 | KIRLOSENG5% ₹102 Cr 1,119,847 Reliance Industries Ltd (Energy)
Equity, Since 31 Oct 21 | RELIANCE4% ₹95 Cr 325,000
↑ 31,976 ICICI Bank Ltd (Financial Services)
Equity, Since 31 Mar 12 | ICICIBANK4% ₹84 Cr 800,000 Bharti Airtel Ltd (Communication Services)
Equity, Since 30 Sep 09 | BHARTIARTL4% ₹80 Cr 710,000 Sobha Ltd (Real Estate)
Equity, Since 31 Aug 17 | SOBHA4% ₹77 Cr 490,000 KEI Industries Ltd (Industrials)
Equity, Since 31 Dec 15 | KEI3% ₹74 Cr 229,407
2022 માટે શ્રેષ્ઠ ઇક્વિટી ફંડ્સ પસંદ કરવા માટે સ્માર્ટ ટિપ્સ
શ્રેષ્ઠ ઇક્વિટી મ્યુચ્યુઅલ ફંડમાં રોકાણ કરવાની એક સંપૂર્ણ રીત તેના ગુણાત્મક અને જથ્થાત્મક બંને પગલાંને જોવાનું છે.
1. ગુણાત્મક પગલાં
a તમારા ફંડ મેનેજરને જાણો
મ્યુચ્યુઅલ ફંડ સ્કીમની કામગીરીનો શ્રેય ફંડ મેનેજરને રહેલો છે. ફંડના પોર્ટફોલિયો માટે રોકાણના નિર્ણયો લેવા માટે ફંડ મેનેજર જવાબદાર છે. તેથી, રોકાણકારોએ ચોક્કસ ફંડ મેનેજર દ્વારા સંચાલિત ભંડોળના પ્રદર્શનમાંથી પસાર થવું જોઈએ, ખાસ કરીને મુશ્કેલ બજારના તબક્કા દરમિયાન. ઉપરાંત, રોકાણકારોએ એવા ફંડ મેનેજરને વધુ પ્રાધાન્ય આપવું જોઈએ કે જેમને સમાન પ્રકારના ફંડનું સંચાલન કરવાનો અનુભવ હોય, ઉદાહરણ તરીકે- સ્મોલ અને મિડ કેપ્સ. એક ફંડ મેનેજર માટે જવું કે જે તેની કારકિર્દીમાં સુસંગત હોય તે એક પસંદગીની પસંદગી છે.
b ફંડ હાઉસ પ્રતિષ્ઠા
રોકાણ કરવા માટે શ્રેષ્ઠ ઇક્વિટી મ્યુચ્યુઅલ ફંડ પસંદ કરતી વખતે, હંમેશા ફંડ હાઉસની ગુણવત્તા અને પ્રતિષ્ઠા પર ધ્યાન આપો. લાંબા સમયથી રેકોર્ડ ધરાવતું ફંડ હાઉસ, મેનેજમેન્ટ હેઠળની મોટી અસ્કયામતો, સ્ટાર ફંડ અથવા સારી કામગીરી બજાવતા ફંડ વગેરેમાં રોકાણ કરવું જરૂરી છે. તેથી સતત ટ્રેક રેકોર્ડ સાથે નાણાકીય ઉદ્યોગમાં મજબૂત હાજરી ધરાવતું ફંડ હાઉસ હોવું જોઈએ. આદર્શ રીતે પ્રાધાન્ય.
2. જથ્થાત્મક પગલાં
a ફંડ કામગીરી
રોકાણકારે અમુક સમયગાળા માટે ફંડના પ્રદર્શનનું યોગ્ય મૂલ્યાંકન કરવું જોઈએ. ઉપરાંત, એવા ફંડ માટે જવાનું સૂચન કરવામાં આવે છે જે સતત 4-5 વર્ષમાં તેના બેન્ચમાર્કને હરાવી દે છે, વધુમાં, દરેક સમયગાળો જોવો જોઈએ અને જોવું જોઈએ કે ફંડ બેન્ચમાર્કને હરાવવા સક્ષમ છે કે નહીં.
b ફંડનું કદ
રોકાણકારોએ હંમેશા એવા ફંડ માટે જવું જોઈએ જે ન તો ખૂબ મોટું હોય અને ન તો ખૂબ નાનું હોય. જ્યારે ફંડના કદ વચ્ચે કોઈ સંપૂર્ણ વ્યાખ્યા અને સંબંધ નથી, એવું કહેવાય છે કે ખૂબ નાનું અને ખૂબ મોટું બંને, ફંડની કામગીરીને અવરોધી શકે છે. આમ, ફંડની પસંદગી કરતી વખતે, એવી સલાહ આપવામાં આવે છે કે જેની AUM (એસેટ અંડર મેનેજમેન્ટ) લગભગ કેટેગરી જેટલી જ હોય.
3. વધારાના જથ્થાત્મક પગલાં
a ખર્ચ ગુણોત્તર
મ્યુચ્યુઅલ ફંડમાં રોકાણ કરનારા રોકાણકારોએ એસેટ મેનેજમેન્ટ કંપની (AMC). સામાન્ય રીતે, નિષ્ક્રિય રીતે સંચાલિત યોજનાઓ કરતાં સક્રિય રીતે મેનેજ થતી યોજનાઓ માટે ખર્ચનો ગુણોત્તર વધારે હોય છે (જેમ કેઈન્ડેક્સ ફંડ્સ અથવાETFs). સેબીના નિયમો અનુસાર, ઇક્વિટી ફંડ્સ માટે ખર્ચનો ગુણોત્તર ઓછામાં ઓછો 2.5% છે. જો કે, ખર્ચ ગુણોત્તર એવી વસ્તુ છે જે ફંડની કામગીરી વગેરે જેવા અન્ય મહત્વપૂર્ણ પરિબળોને વટાવી ન જોઈએ. ફંડ એ જાણીને કે તે તેના સ્પર્ધકોને સારા માર્જિનથી હરાવી દેશે.
b ગુણોત્તર વિશ્લેષણ
ફંડની કામગીરીને માપવા માટેના કેટલાક મહત્વપૂર્ણ ગુણોત્તર આ પ્રમાણે છે:
વિ. આલ્ફા
આલ્ફા તમારા રોકાણની સફળતા અથવા બેન્ચમાર્ક સામે આઉટપરફોર્મન્સનું માપ છે. તે સામાન્ય બજારમાં ફંડ અથવા શેરે કેટલું પ્રદર્શન કર્યું છે તેના પર માપ કાઢે છે. 1 ના પોઝિટિવ આલ્ફાનો અર્થ એ છે કે ફંડે તેના બેન્ચમાર્ક ઇન્ડેક્સને 1% કરતા આગળ કર્યો છે, જ્યારે -1 નો નકારાત્મક આલ્ફા સૂચવે છે કે ફંડે તેના બજાર બેન્ચમાર્ક કરતાં 1% ઓછું વળતર આપ્યું છે. તેથી, મૂળભૂત રીતે, રોકાણકારની વ્યૂહરચના હકારાત્મક આલ્ફા સાથે સિક્યોરિટીઝ ખરીદવાની હોવી જોઈએ.
ડી. બેટા
તે બેન્ચમાર્કની તુલનામાં સ્ટોકની કિંમત અથવા ફંડમાં વોલેટિલિટીને માપે છે અને તેને સકારાત્મક અથવા નકારાત્મક આંકડાઓમાં દર્શાવવામાં આવે છે. એબેટા 1 નો અર્થ એ છે કે શેરની કિંમત બજારને અનુરૂપ આગળ વધે છે, 1 કરતાં વધુનો બીટા સૂચવે છે કે સ્ટોક બજાર કરતાં વધુ જોખમી છે અને 1 કરતાં ઓછાના બીટાનો અર્થ છે કે સ્ટોક બજાર કરતાં ઓછો જોખમી છે. તેથી, ઘટી રહેલા બજારમાં નીચું બીટા વધુ સારું છે. વધતા બજારમાં, ઉચ્ચ-બીટા વધુ સારું છે.
ઇ. માનક વિચલન (SD)
સરળ શબ્દોમાં કહીએ તો, SD એ ઇન્સ્ટ્રુમેન્ટમાં અસ્થિરતા અથવા જોખમનું પ્રતિનિધિત્વ કરતું આંકડાકીય માપ છે. SD જેટલું ઊંચું હશે, વળતરમાં વધઘટ વધારે હશે.
f શાર્પ રેશિયો
શાર્પ રેશિયો લીધેલા જોખમના સંદર્ભમાં વળતર (નકારાત્મક અને હકારાત્મક બંને) માપે છે. અહીં જોખમ દ્વારા વ્યાખ્યાયિત કરવામાં આવે છેપ્રમાણભૂત વિચલન. ઉચ્ચ શાર્પ રેશિયોનો અર્થ છે, વધારે જોખમ વિના ઊંચું વળતર. આમ, રોકાણ કરતી વખતે, રોકાણકારોએ એવું ફંડ પસંદ કરવું જોઈએ જે ઉચ્ચ શાર્પ રેશિયો દર્શાવે.
g સોર્ટિનો રેશિયો
આસોર્ટિનો રેશિયો શાર્પ રેશિયોની વિવિધતા છે. પરંતુ, શાર્પ રેશિયોથી વિપરીત, સોર્ટિનો રેશિયો માત્ર ડાઉનસાઇડ અથવા નેગેટિવ રિટર્નને ધ્યાનમાં લે છે. આવા ગુણોત્તર રોકાણકારો માટે કુલ વોલેટિલિટીના વળતરને જોવા કરતાં વધુ સારી રીતે જોખમનું મૂલ્યાંકન કરવા માટે મદદરૂપ છે.
અપસાઇડ કેપ્ચર રેશિયો અને ડાઉનસાઇડ કેપ્ચર રેશિયો
અપસાઇડ/ડાઉનસાઇડ કેપ્ચર રેશિયો રોકાણકારને માર્ગદર્શન આપે છે- શું ફંડ આઉટપરફોર્મ કર્યું છે એટલે કે બ્રોડ માર્કેટ બેન્ચમાર્ક કરતાં વધુ મેળવ્યું છે કે ઓછું ગુમાવ્યું છે- બજારના તબક્કા દરમિયાન અપસાઇડ (મજબૂત) અથવા ડાઉનસાઇડ (નબળું) અને વધુ મહત્ત્વનું છે કે કેટલું.
વેલ, 100 થી વધુના અપસાઇડ રેશિયોનો અર્થ એ છે કે આપેલ ફંડે હકારાત્મક વળતરના સમયગાળા દરમિયાન બેન્ચમાર્કને પછાડ્યો છે. અને 100 કરતા ઓછાનો ડાઉનસાઇડ રેશિયો દર્શાવે છે કે આપેલ ફંડ નિસ્તેજ વળતરના તબક્કા દરમિયાન તેના બેન્ચમાર્ક કરતાં ઓછું ગુમાવ્યું છે. તેથી, સામાન્ય રીતે, રોકાણકારોએ એવા ફંડ માટે જવું જોઈએ કે જેમાં નીચું ડાઉનસાઈડ કેપ્ચર રેશિયો હોય અને ઉચ્ચ અપસાઈડ કેપ્ચર રેશિયો હોય.
ઇક્વિટી ફંડ ટેક્સેશન
1. લાંબા ગાળાના મૂડી લાભો
INR 1 લાખથી વધુના LTCG જેમાંથી ઉદ્ભવે છેવિમોચન મ્યુચ્યુઅલ ફંડ એકમો અથવા ઇક્વિટી પર 10 ટકા (વત્તા સેસ) અથવા 10.4 ટકાના દરે ટેક્સ લાગશે. લાંબા ગાળાનામૂડી વધારો INR 1 લાખ સુધી મુક્તિ આપવામાં આવશે.
ઉદાહરણ તરીકે, જો તમે નાણાકીય વર્ષમાં સ્ટોક્સ અથવા મ્યુચ્યુઅલ ફંડ રોકાણોમાંથી સંયુક્ત લાંબા ગાળાના મૂડી લાભમાં INR 3 લાખ કમાઓ છો. કરપાત્ર LTCGs INR 2 લાખ (INR 3 લાખ - 1 લાખ) હશે અનેકર જવાબદારી 20 રૂપિયા હશે,000 (INR 2 લાખના 10 ટકા).
લાંબા ગાળાના મૂડી લાભો એ એક વર્ષથી વધુ સમય સુધી રોકાયેલા ઇક્વિટી ફંડના વેચાણ અથવા રિડેમ્પશનથી થતો નફો છે.
2. શોર્ટ ટર્મ કેપિટલ ગેન્સ
જો મ્યુચ્યુઅલ ફંડના એકમો હોલ્ડિંગના એક વર્ષ પહેલાં વેચવામાં આવે, તો શોર્ટ ટર્મ કેપિટલ ગેન્સ (STCGs) ટેક્સ લાગુ થશે. STCGs ટેક્સ 15 ટકા પર યથાવત રાખવામાં આવ્યો છે.
| ઇક્વિટી સ્કીમ્સ | હોલ્ડિંગ પીરિયડ | કર દર |
|---|---|---|
| લોંગ ટર્મ કેપિટલ ગેન્સ (LTCG) | 1 વર્ષથી વધુ | 10% (કોઈ અનુક્રમણિકા વિના) **** |
| શોર્ટ ટર્મ કેપિટલ ગેઈન્સ (STCG) | એક વર્ષ કરતાં ઓછું અથવા તેની બરાબર | 15% |
| વિતરિત ડિવિડન્ડ પર કર | - | 10%# |
*INR 1 લાખ સુધીના લાભો કરમુક્ત છે. INR 1 લાખથી વધુના નફા પર 10% ટેક્સ લાગુ થાય છે.
#10%નો ડિવિડન્ડ ટેક્સ + સરચાર્જ 12% + સેસ 4% =11.648% આરોગ્ય અને શિક્ષણ સેસ 4% રજૂ કરવામાં આવ્યો. અગાઉ, શિક્ષણ ઉપકર 3% હતો.
શ્રેષ્ઠ ઇક્વિટી મ્યુચ્યુઅલ ફંડમાં ઓનલાઇન કેવી રીતે રોકાણ કરવું?
Fincash.com પર આજીવન માટે મફત રોકાણ ખાતું ખોલો.
તમારી નોંધણી અને KYC પ્રક્રિયા પૂર્ણ કરો
દસ્તાવેજો અપલોડ કરો (PAN, આધાર, વગેરે).અને, તમે રોકાણ કરવા માટે તૈયાર છો!
નિષ્કર્ષ
શ્રેષ્ઠ ઇક્વિટી મ્યુચ્યુઅલ ફંડની શોધ કરતી વખતે, રોકાણકારોએ ઇક્વિટી ફંડ્સ પસંદ કરવા જોઈએ જે બજારમાં સારો દેખાવ કરી રહ્યાં છે. જ્યારે બજાર ખરાબ થઈ જાય ત્યારે ફંડ કેવી રીતે વર્તે છે અને પ્રદર્શન કરે છે તે જાણવું જોઈએ. ફંડના છેલ્લા ત્રણ વર્ષના પ્રદર્શનનું ઊંડાણપૂર્વક વિશ્લેષણ એ શ્રેષ્ઠ ઇક્વિટી મ્યુચ્યુઅલ ફંડમાંથી એક ખરીદવાનો એક આદર્શ માર્ગ છે.
અહીં આપેલી માહિતી સચોટ છે તેની ખાતરી કરવા માટેના તમામ પ્રયાસો કરવામાં આવ્યા છે. જો કે, ડેટાની શુદ્ધતા અંગે કોઈ ગેરંટી આપવામાં આવતી નથી. કોઈપણ રોકાણ કરતા પહેલા કૃપા કરીને સ્કીમ માહિતી દસ્તાવેજ સાથે ચકાસો.










AMFI Registration No. 112358 | CIN: U74999MH2016PTC282153
Shepard Technologies Pvt. Ltd. (with ARN code 112358) makes no warranties or representations, express or implied, on products offered through the platform. It accepts no liability for any damages or losses, however caused, in connection with the use of, or on the reliance of its product or related services. Terms and conditions of the website are applicable.
©2024 Shepard Technologies Private Limited. All Rights Reserved
very informative