 +91-22-48913909
Table of Contents
- ભારતમાં ઈન્ડેક્સ ફંડમાં શા માટે રોકાણ કરવું?
- ઈન્ડેક્સ મ્યુચ્યુઅલ ફંડનો પ્રકાર
- ટોચના 9 શ્રેષ્ઠ પ્રદર્શન ઇન્ડેક્સ ફંડ્સ નાણાકીય વર્ષ 22 - 23
- નિષ્ક્રિય ઇન્ડેક્સ ફંડ શા માટે વધુ સારું છે?
- નિષ્ક્રિય ભંડોળ - કોરોનાવાયરસ રોગચાળા વચ્ચે સલામત સ્વર્ગ
- નિષ્ક્રિય ભંડોળ વિ સક્રિય ભંડોળ
- ઈન્ડેક્સ ફંડ્સમાં રોકાણના જોખમો
- ઈન્ડેક્સ મ્યુચ્યુઅલ ફંડમાં ઓનલાઈન કેવી રીતે રોકાણ કરવું?
- FAQs
- 1. તમારે ઈન્ડેક્સ મ્યુચ્યુઅલ ફંડમાં શા માટે રોકાણ કરવું જોઈએ?
- 2. ચોક્કસ ઇન્ડેક્સ MF કેવી રીતે પસંદ કરવું?
- 3. ઈન્ડેક્સ ફંડમાં રોકાણ કરવાનો મુખ્ય ફાયદો શું છે?
- 4. SBI નિફ્ટી ઇન્ડેક્સ ફંડ પાસેથી કેટલી અપેક્ષા રાખવી?
- 5. જો તમે ICICI પ્રુડેન્શિયલ નિફ્ટી ઇન્ડેક્સ ફંડમાં રોકાણ કરો તો તમે શું અપેક્ષા રાખી શકો?
- 6. ઇન્ડેક્સ ફંડ્સ વૈવિધ્યકરણમાં કેવી રીતે ઉમેરે છે?
- 7. તમારે ઈન્ડેક્સ ફંડમાં ક્યારે રોકાણ કરવાનું વિચારવું જોઈએ?
- 8. શું એવી કોઈ રીત છે કે જેનાથી હું શ્રેષ્ઠ ઈન્ડેક્સ ફંડ પસંદ કરી શકું?
- 9. ઈન્ડેક્સ ફંડ્સમાં રોકાણ કરવા માટે કોણ આદર્શ રીતે યોગ્ય છે?
Top 9 Others - Index Fund Funds
રોકાણ માટે શ્રેષ્ઠ ઇન્ડેક્સ મ્યુચ્યુઅલ ફંડ્સ 2022
ઈન્ડેક્સ ફંડ્સ મ્યુચ્યુઅલ ફંડ યોજનાઓનો સંદર્ભ લો કે જેનો પોર્ટફોલિયો a નો ઉપયોગ કરીને બનાવવામાં આવ્યો છેબજાર આધાર તરીકે અનુક્રમણિકા. બીજા શબ્દોમાં કહીએ તો, ઇન્ડેક્સ ફંડનું પ્રદર્શન ચોક્કસ ઇન્ડેક્સની કામગીરી પર આધારિત છે. આ યોજનાઓ નિષ્ક્રિય રીતે સંચાલિત થાય છે. આ ફંડ્સમાં સમાન પ્રમાણમાં શેર હોય છે કારણ કે તે ચોક્કસ ઇન્ડેક્સમાં હોય છે.
ભારતમાં, ઘણી યોજનાઓ તેમના પોર્ટફોલિયોના નિર્માણ માટે નિફ્ટી અથવા સેન્સેક્સનો આધાર તરીકે ઉપયોગ કરે છે. ઉદાહરણ તરીકે, જો નિફ્ટી પોર્ટફોલિયો SBIના શેરનો બનેલો છે જેનું પ્રમાણ 12% છે તો; નિફ્ટી ઈન્ડેક્સ ફંડમાં પણ 12% ઈક્વિટી શેર હશે.
તેઓ નિષ્ક્રિય રીતે ચોક્કસ ઇન્ડેક્સના પ્રદર્શનને ટ્રૅક કરે છે. સક્રિય રીતે સંચાલિત ફંડ્સથી વિપરીત, ઇન્ડેક્સ ફંડ્સનો અર્થ બજારને પાછળ રાખવા માટે નથી, પરંતુ ઇન્ડેક્સની કામગીરીની નકલ કરે છે. જ્યારે એનરોકાણકાર ઇન્ડેક્સ ફંડમાં રોકાણ કરવાની યોજના બનાવી રહ્યા છે, તેમણે ફંડની ટ્રેકિંગ એરર પર ધ્યાન આપવું જોઈએ. ટ્રેકિંગ એરર તે ટ્રેકિંગ બેન્ચમાર્કમાંથી ફંડ રિટર્નના વિચલનને માપે છે. તે ઇન્ડેક્સ ફંડ રિટર્ન અને તેના બેન્ચમાર્ક રિટર્ન વચ્ચેનો તફાવત છે. ટ્રેકિંગ એરર જેટલી ઓછી હશે, તેટલું ફંડનું પ્રદર્શન સારું રહેશે.
ભારતમાં ઈન્ડેક્સ ફંડમાં શા માટે રોકાણ કરવું?
કેટલાકરોકાણના ફાયદા ઇન્ડેક્સ ફંડ્સમાં છે:
1. વૈવિધ્યકરણ
ઇન્ડેક્સ એ વિવિધ શેરો અને સિક્યોરિટીઝનો સંગ્રહ છે. તેઓ રોકાણકારને વિવિધતા પ્રદાન કરે છે જેનો મુખ્ય હેતુ છેએસેટ ફાળવણી. આ ખાતરી કરે છે કે રોકાણકાર પાસે તેના બધા ઇંડા એક ટોપલીમાં નથી.
2. ઓછા ખર્ચ
અન્ય મ્યુચ્યુઅલ ફંડ યોજનાઓની સરખામણીમાં ઈન્ડેક્સ ફંડનો ઓપરેટિંગ ખર્ચ ઓછો હોય છે. અહીં, ફંડ મેનેજરો પાસે કંપનીઓનું ઊંડાણપૂર્વકનું સંશોધન કરવા માટે સંશોધન વિશ્લેષકોની અલગ ટીમ હોવી જરૂરી નથી, જેની સામે નોંધપાત્ર રકમ ખર્ચવામાં આવે છે. ઇન્ડેક્સ ફંડ્સમાં, મેનેજરે માત્ર ઇન્ડેક્સની નકલ કરવાની જરૂર છે. તેથી, ઇન્ડેક્સ ફંડના કિસ્સામાં ખર્ચનો ગુણોત્તર ઓછો છે.
3. ઓછો વ્યવસ્થાપક પ્રભાવ
ફંડ ચોક્કસ ઇન્ડેક્સની હિલચાલને સરળ રીતે અનુસરતું હોવાથી, મેનેજરે કયા શેરોમાં રોકાણ કરવું તે પસંદ કરવાની જરૂર નથી. આ એક પ્લસ પોઈન્ટ છે કારણ કે મેનેજરની પોતાની શૈલીરોકાણ (જે અમુક સમયે બજાર સાથે સુમેળમાં ન હોઈ શકે) અંદર સળવળતું નથી.
ઈન્ડેક્સ મ્યુચ્યુઅલ ફંડનો પ્રકાર
સેન્સેક્સ અથવા નિફ્ટીમાં કંપનીનું વેઇટેજ તેના ફ્રી પર આધાર રાખે છેફ્લોટ બજાર મૂડીકરણ. તે ઇન્ડેક્સના કુલ માર્કેટ કેપિટલાઇઝેશનની ટકાવારી છે. તેથી, જો કોઈ કંપનીનું માર્કેટ કેપિટલાઇઝેશન રૂ1 કરોડ, જ્યારે ઈન્ડેક્સ જો રૂ. 200 કરોડ છે, તો તેના સ્ટોકનું વેઈટેજ 0.5% છે.
1. સેન્સેક્સ ઇન્ડેક્સ ફંડ્સ
આ ઇન્ડેક્સ ફંડ્સ BSE સેન્સેક્સને બેચમાર્ક ઇન્ડેક્સ તરીકે ટ્રૅક કરે છે અને ઉપર ચર્ચા કર્યા મુજબ વેઇટેજ લોગિન પર આધારિત BSE સેન્સેક્સ પર 30 કંપનીઓમાં રોકાણ કરે છે. આમ્યુચ્યુઅલ ફંડના પ્રકાર ETF દ્વારા સમર્થિત છે (એક્સચેન્જ ટ્રેડેડ ફંડ) વિનિમય પર વેપાર.
2. નિફ્ટી ઇન્ડેક્સ ફંડ્સ
આ ઇન્ડેક્સ ફંડ્સ NSE NIFTY 50 ને બેચમાર્ક ઇન્ડેક્સ તરીકે ટ્રેક કરે છે અને ઉપર ચર્ચા કર્યા મુજબ વેઇટેજ લોગિન પર આધારિત નિફ્ટી 50 પર 50 કંપનીઓમાં રોકાણ કરે છે. આ પ્રકારનામ્યુચ્યુઅલ ફંડ એક્સચેન્જ પર ટ્રેડ થતા ETF (એક્સચેન્જ ટ્રેડેડ ફંડ્સ) દ્વારા સમર્થિત છે.
Talk to our investment specialist
3. નિફ્ટી જુનિયર ઈન્ડેક્સ ફંડ
આ ઇન્ડેક્સ ફંડ્સ NSE NIFTY Junior 50 ને બેચમાર્ક ઇન્ડેક્સ તરીકે ટ્રૅક કરે છે અને NSE NIFTY Junior 50 પર ઉપર ચર્ચા કર્યા મુજબ વેઇટેજ લોગિન પર આધારિત 50 કંપનીઓમાં રોકાણ કરે છે. આ પ્રકારના મ્યુચ્યુઅલ ફંડ્સને એક્સચેન્જ પર ટ્રેડ થતા ETF (એક્સચેન્જ ટ્રેડેડ ફંડ્સ) દ્વારા સમર્થન મળે છે.
ટોચના 9 શ્રેષ્ઠ પ્રદર્શન ઇન્ડેક્સ ફંડ્સ નાણાકીય વર્ષ 22 - 23
Fund NAV Net Assets (Cr) 3 MO (%) 6 MO (%) 1 YR (%) 3 YR (%) 5 YR (%) 2023 (%) LIC MF Index Fund Sensex Growth ₹136.185
↑ 1.11 ₹78 1.8 11.2 23 15.3 13.5 19 Nippon India Index Fund - Sensex Plan Growth ₹36.7328
↑ 0.30 ₹635 2 11.4 23.6 15.7 13.8 19.5 ICICI Prudential Nifty Index Fund Growth ₹219.826
↑ 1.50 ₹7,194 2.5 13 26.6 16.3 14.2 20.7 SBI Nifty Index Fund Growth ₹193.249
↑ 1.32 ₹6,850 2.4 12.9 26.4 16.2 13.9 20.7 IDBI Nifty Index Fund Growth ₹36.2111
↓ -0.02 ₹208 9.1 11.9 16.2 20.3 11.7 Franklin India Index Fund Nifty Plan Growth ₹176.543
↑ 1.20 ₹650 2.4 12.8 26.1 15.9 13.7 20.2 ICICI Prudential Nifty Next 50 Index Fund Growth ₹54.4318
↓ -0.09 ₹4,444 13.2 37.6 60.8 22.1 16.7 26.3 IDBI Nifty Junior Index Fund Growth ₹45.9724
↓ -0.08 ₹74 13 37.2 60 21.9 16.5 25.7 LIC MF Index Fund Nifty Growth ₹121.804
↑ 0.83 ₹296 2.3 12.6 25.6 15.6 13.6 19.8 Note: Returns up to 1 year are on absolute basis & more than 1 year are on CAGR basis. as on 19 Apr 24
*નીચે ઓછામાં ઓછા ધરાવતા ઈન્ડેક્સ મ્યુચ્યુઅલ ફંડ્સની યાદી છે15 કરોડ અથવા વધુ નેટ એસેટ્સમાં.
The main investment objective of the fund is to generate returns commensurate with the performance of the index either Nifty / Sensex based on the plans by investing in the respective index stocks subject to tracking errors. LIC MF Index Fund Sensex is a Others - Index Fund fund was launched on 14 Nov 02. It is a fund with Moderately High risk and has given a Below is the key information for LIC MF Index Fund Sensex Returns up to 1 year are on The primary investment objective of the scheme is to replicate the composition of the Sensex, with a view to generate returns that are commensurate with the performance of the Sensex, subject to tracking errors. Nippon India Index Fund - Sensex Plan is a Others - Index Fund fund was launched on 28 Sep 10. It is a fund with Moderately High risk and has given a Below is the key information for Nippon India Index Fund - Sensex Plan Returns up to 1 year are on (Erstwhile ICICI Prudential Nifty Index Fund) An open-ended index linked growth scheme seeking to track the returns of the S&P CNX Nifty index through investment in a basket of stocks drawn from the constituents of the Nifty. ICICI Prudential Nifty Index Fund is a Others - Index Fund fund was launched on 26 Feb 02. It is a fund with Moderately High risk and has given a Below is the key information for ICICI Prudential Nifty Index Fund Returns up to 1 year are on The scheme will adopt a passive investment strategy. The scheme will
invest in stocks comprising the Nifty 50 Index in the same proportion as in the
index with the objective of achieving returns equivalent to the Total Returns
Index of Nifty 50 Index by minimizing the performance difference between the
benchmark index and the scheme. The Total Returns Index is an index that
reflects the returns on the index from index gain/loss plus dividend payments
by the constituent stocks. SBI Nifty Index Fund is a Others - Index Fund fund was launched on 17 Jan 02. It is a fund with Moderately High risk and has given a Below is the key information for SBI Nifty Index Fund Returns up to 1 year are on The investment objective of the scheme is to invest in the stocks and equity related instruments comprising the S&P CNX Nifty Index in the same weights as these stocks represented in the Index with the intent to replicate the performance of the Total Returns Index of S&P CNX Nifty index. The scheme will adopt a passive investment strategy and will seek to achieve the investment objective by minimizing the tracking error between the S&P CNX Nifty index (Total Returns Index) and the scheme. IDBI Nifty Index Fund is a Others - Index Fund fund was launched on 25 Jun 10. It is a fund with Moderately High risk and has given a Below is the key information for IDBI Nifty Index Fund Returns up to 1 year are on The Investment Objective of the Scheme is to invest in companies whose securities are included in the Nifty and subject to tracking errors, endeavouring to attain results commensurate with the Nifty 50 under NSENifty Plan Franklin India Index Fund Nifty Plan is a Others - Index Fund fund was launched on 4 Aug 00. It is a fund with Moderately High risk and has given a Below is the key information for Franklin India Index Fund Nifty Plan Returns up to 1 year are on The fund's objective is to invest in companies whose securities are included in Nifty Junior Index and to endeavor to achieve the returns of the above index as closely as possible, though subject to tracking error. The fund intends to track only 90-95% of the Index i.e. it will always keep cash balance between 5-10% of the Net Asset to meet the redemption and other liquidity requirements. However, as and when the liquidity in the Index improves the fund intends to track up to 100% of the Index. The fund will not seek to outperform the CNX Nifty Junior. The objective is that the performance of the NAV of the fund should closely track the performance of the CNX Nifty Junior over the same period subject to tracking error. ICICI Prudential Nifty Next 50 Index Fund is a Others - Index Fund fund was launched on 25 Jun 10. It is a fund with Moderately High risk and has given a Below is the key information for ICICI Prudential Nifty Next 50 Index Fund Returns up to 1 year are on The investment objective of the scheme is to invest in the stocks and equity related instruments comprising the CNX Nifty Junior Index in the same weights as these stocks represented in the Index with the intent to replicate the performance of the Total Returns Index of CNX Nifty Junior Index. The scheme will adopt a passive investment strategy and will seek to achieve the investment objective by minimizing the tracking error between the CNX Nifty Junior Index (Total Returns Index) and the scheme. IDBI Nifty Junior Index Fund is a Others - Index Fund fund was launched on 20 Sep 10. It is a fund with Moderately High risk and has given a Below is the key information for IDBI Nifty Junior Index Fund Returns up to 1 year are on The main investment objective of the fund is to generate returns commensurate with the performance of the index either Nifty / Sensex based on the plans by investing in the respective index stocks subject to tracking errors. LIC MF Index Fund Nifty is a Others - Index Fund fund was launched on 14 Nov 02. It is a fund with Moderately High risk and has given a Below is the key information for LIC MF Index Fund Nifty Returns up to 1 year are on 1. LIC MF Index Fund Sensex
CAGR/Annualized return of 13.5% since its launch. Ranked 79 in Index Fund category. Return for 2023 was 19% , 2022 was 4.6% and 2021 was 21.9% . LIC MF Index Fund Sensex
Growth Launch Date 14 Nov 02 NAV (19 Apr 24) ₹136.185 ↑ 1.11 (0.82 %) Net Assets (Cr) ₹78 on 31 Mar 24 Category Others - Index Fund AMC LIC Mutual Fund Asset Mgmt Co Ltd Rating ☆ Risk Moderately High Expense Ratio 0.99 Sharpe Ratio 1.57 Information Ratio -8.13 Alpha Ratio -1.08 Min Investment 5,000 Min SIP Investment 1,000 Exit Load 0-1 Months (1%),1 Months and above(NIL) Growth of 10,000 investment over the years.
Date Value 31 Mar 19 ₹10,000 31 Mar 20 ₹7,691 31 Mar 21 ₹12,859 31 Mar 22 ₹15,197 31 Mar 23 ₹15,350 31 Mar 24 ₹19,212 Returns for LIC MF Index Fund Sensex
absolute basis & more than 1 year are on CAGR (Compound Annual Growth Rate) basis. as on 19 Apr 24 Duration Returns 1 Month 1.4% 3 Month 1.8% 6 Month 11.2% 1 Year 23% 3 Year 15.3% 5 Year 13.5% 10 Year 15 Year Since launch 13.5% Historical performance (Yearly) on absolute basis
Year Returns 2023 19% 2022 4.6% 2021 21.9% 2020 15.9% 2019 14.6% 2018 5.6% 2017 27.4% 2016 1.6% 2015 -5.4% 2014 29.3% Fund Manager information for LIC MF Index Fund Sensex
Name Since Tenure Sumit Bhatnagar 3 Oct 23 0.49 Yr. Data below for LIC MF Index Fund Sensex as on 31 Mar 24
Asset Allocation
Asset Class Value Cash 0.11% Equity 99.89% Top Securities Holdings / Portfolio
Name Holding Value Quantity HDFC Bank Ltd (Financial Services)
Equity, Since 31 Mar 09 | HDFCBANK13% ₹10 Cr 72,652
↓ -2,149 Reliance Industries Ltd (Energy)
Equity, Since 31 Mar 09 | RELIANCE12% ₹10 Cr 33,027
↓ -1,002 ICICI Bank Ltd (Financial Services)
Equity, Since 30 Apr 09 | 5321749% ₹7 Cr 67,279
↓ -1,940 Infosys Ltd (Technology)
Equity, Since 31 Mar 09 | INFY7% ₹6 Cr 34,299
↓ -860 Tata Consultancy Services Ltd (Technology)
Equity, Since 31 Mar 09 | TCS5% ₹4 Cr 9,915
↓ -223 Larsen & Toubro Ltd (Industrials)
Equity, Since 31 Mar 09 | LT5% ₹4 Cr 11,610
↓ -348 ITC Ltd (Consumer Defensive)
Equity, Since 30 Sep 11 | ITC4% ₹3 Cr 85,069
↓ -1,863 Axis Bank Ltd (Financial Services)
Equity, Since 31 Dec 13 | 5322154% ₹3 Cr 26,975
↓ -1,080 State Bank of India (Financial Services)
Equity, Since 31 Mar 09 | SBIN3% ₹3 Cr 36,970
↓ -721 Bharti Airtel Ltd (Communication Services)
Equity, Since 30 Apr 09 | BHARTIARTL3% ₹3 Cr 24,238
↓ -692 2. Nippon India Index Fund - Sensex Plan
CAGR/Annualized return of 10.1% since its launch. Ranked 74 in Index Fund category. Return for 2023 was 19.5% , 2022 was 5% and 2021 was 22.4% . Nippon India Index Fund - Sensex Plan
Growth Launch Date 28 Sep 10 NAV (19 Apr 24) ₹36.7328 ↑ 0.30 (0.82 %) Net Assets (Cr) ₹635 on 31 Mar 24 Category Others - Index Fund AMC Nippon Life Asset Management Ltd. Rating ☆☆ Risk Moderately High Expense Ratio 0.74 Sharpe Ratio 1.61 Information Ratio -8.21 Alpha Ratio -0.59 Min Investment 5,000 Min SIP Investment 100 Exit Load 0-7 Days (0.25%),7 Days and above(NIL) Growth of 10,000 investment over the years.
Date Value 31 Mar 19 ₹10,000 31 Mar 20 ₹7,676 31 Mar 21 ₹12,892 31 Mar 22 ₹15,307 31 Mar 23 ₹15,497 31 Mar 24 ₹19,479 Returns for Nippon India Index Fund - Sensex Plan
absolute basis & more than 1 year are on CAGR (Compound Annual Growth Rate) basis. as on 19 Apr 24 Duration Returns 1 Month 1.5% 3 Month 2% 6 Month 11.4% 1 Year 23.6% 3 Year 15.7% 5 Year 13.8% 10 Year 15 Year Since launch 10.1% Historical performance (Yearly) on absolute basis
Year Returns 2023 19.5% 2022 5% 2021 22.4% 2020 16.6% 2019 14.2% 2018 6.2% 2017 27.9% 2016 2% 2015 -4.7% 2014 28.7% Fund Manager information for Nippon India Index Fund - Sensex Plan
Name Since Tenure Himanshu Mange 23 Dec 23 0.27 Yr. Data below for Nippon India Index Fund - Sensex Plan as on 31 Mar 24
Asset Allocation
Asset Class Value Cash 0.01% Equity 99.99% Top Securities Holdings / Portfolio
Name Holding Value Quantity HDFC Bank Ltd (Financial Services)
Equity, Since 31 Oct 10 | HDFCBANK13% ₹79 Cr 564,713
↑ 10,512 Reliance Industries Ltd (Energy)
Equity, Since 31 Oct 10 | RELIANCE12% ₹75 Cr 256,764
↑ 4,780 ICICI Bank Ltd (Financial Services)
Equity, Since 31 Oct 10 | 5321749% ₹55 Cr 521,465
↑ 9,707 Infosys Ltd (Technology)
Equity, Since 31 Oct 10 | INFY7% ₹44 Cr 265,607
↑ 4,944 Larsen & Toubro Ltd (Industrials)
Equity, Since 29 Feb 12 | LT5% ₹31 Cr 89,965
↑ 1,675 Tata Consultancy Services Ltd (Technology)
Equity, Since 31 Oct 10 | TCS5% ₹31 Cr 76,239
↑ 1,419 ITC Ltd (Consumer Defensive)
Equity, Since 29 Feb 12 | ITC4% ₹27 Cr 658,912
↑ 12,265 Axis Bank Ltd (Financial Services)
Equity, Since 31 Dec 13 | 5322154% ₹23 Cr 211,018
↑ 3,928 State Bank of India (Financial Services)
Equity, Since 31 Oct 10 | SBIN3% ₹21 Cr 285,568
↑ 5,315 Bharti Airtel Ltd (Communication Services)
Equity, Since 31 Oct 10 | BHARTIARTL3% ₹21 Cr 188,204
↑ 3,503 3. ICICI Prudential Nifty Index Fund
CAGR/Annualized return of 15% since its launch. Ranked 71 in Index Fund category. Return for 2023 was 20.7% , 2022 was 5.2% and 2021 was 24.9% . ICICI Prudential Nifty Index Fund
Growth Launch Date 26 Feb 02 NAV (19 Apr 24) ₹219.826 ↑ 1.50 (0.69 %) Net Assets (Cr) ₹7,194 on 31 Mar 24 Category Others - Index Fund AMC ICICI Prudential Asset Management Company Limited Rating ☆☆ Risk Moderately High Expense Ratio 0.39 Sharpe Ratio 1.88 Information Ratio -8.76 Alpha Ratio -0.35 Min Investment 5,000 Min SIP Investment 100 Exit Load NIL Growth of 10,000 investment over the years.
Date Value 31 Mar 19 ₹10,000 31 Mar 20 ₹7,461 31 Mar 21 ₹12,758 31 Mar 22 ₹15,262 31 Mar 23 ₹15,282 31 Mar 24 ₹19,801 Returns for ICICI Prudential Nifty Index Fund
absolute basis & more than 1 year are on CAGR (Compound Annual Growth Rate) basis. as on 19 Apr 24 Duration Returns 1 Month 1.5% 3 Month 2.5% 6 Month 13% 1 Year 26.6% 3 Year 16.3% 5 Year 14.2% 10 Year 15 Year Since launch 15% Historical performance (Yearly) on absolute basis
Year Returns 2023 20.7% 2022 5.2% 2021 24.9% 2020 15.2% 2019 12.8% 2018 3.4% 2017 28.7% 2016 3.6% 2015 -3.6% 2014 32.5% Fund Manager information for ICICI Prudential Nifty Index Fund
Name Since Tenure Nishit Patel 18 Jan 21 3.2 Yr. Priya Sridhar 1 Feb 24 0.16 Yr. Ajaykumar Solanki 1 Feb 24 0.16 Yr. Data below for ICICI Prudential Nifty Index Fund as on 31 Mar 24
Asset Allocation
Asset Class Value Cash 0.06% Equity 99.94% Top Securities Holdings / Portfolio
Name Holding Value Quantity HDFC Bank Ltd (Financial Services)
Equity, Since 31 Mar 05 | HDFCBANK11% ₹763 Cr 5,433,513
↑ 90,728 Reliance Industries Ltd (Energy)
Equity, Since 31 Mar 05 | RELIANCE10% ₹715 Cr 2,446,005
↑ 40,845 ICICI Bank Ltd (Financial Services)
Equity, Since 31 Mar 05 | ICICIBANK8% ₹534 Cr 5,071,625
↑ 84,685 Infosys Ltd (Technology)
Equity, Since 31 Mar 05 | INFY6% ₹432 Cr 2,580,879
↑ 43,095 Tata Consultancy Services Ltd (Technology)
Equity, Since 31 Mar 05 | TCS4% ₹300 Cr 732,509
↑ 12,237 Larsen & Toubro Ltd (Industrials)
Equity, Since 29 Feb 12 | LT4% ₹297 Cr 854,741
↑ 14,276 ITC Ltd (Consumer Defensive)
Equity, Since 29 Feb 12 | ITC4% ₹260 Cr 6,404,658
↑ 106,943 Axis Bank Ltd (Financial Services)
Equity, Since 31 Mar 09 | 5322153% ₹216 Cr 2,006,734
↑ 33,514 State Bank of India (Financial Services)
Equity, Since 31 Mar 05 | SBIN3% ₹208 Cr 2,774,809
↑ 46,333 Bharti Airtel Ltd (Communication Services)
Equity, Since 31 Aug 09 | BHARTIARTL3% ₹205 Cr 1,829,203
↑ 30,546 4. SBI Nifty Index Fund
CAGR/Annualized return of 14.4% since its launch. Ranked 75 in Index Fund category. Return for 2023 was 20.7% , 2022 was 5.1% and 2021 was 24.7% . SBI Nifty Index Fund
Growth Launch Date 17 Jan 02 NAV (19 Apr 24) ₹193.249 ↑ 1.32 (0.69 %) Net Assets (Cr) ₹6,850 on 31 Mar 24 Category Others - Index Fund AMC SBI Funds Management Private Limited Rating ☆ Risk Moderately High Expense Ratio 0.5 Sharpe Ratio 1.87 Information Ratio -17.9 Alpha Ratio -0.53 Min Investment 5,000 Min SIP Investment 500 Exit Load 0-15 Days (0.2%),15 Days and above(NIL) Growth of 10,000 investment over the years.
Date Value 31 Mar 19 ₹10,000 31 Mar 20 ₹7,396 31 Mar 21 ₹12,657 31 Mar 22 ₹15,123 31 Mar 23 ₹15,125 31 Mar 24 ₹19,571 Returns for SBI Nifty Index Fund
absolute basis & more than 1 year are on CAGR (Compound Annual Growth Rate) basis. as on 19 Apr 24 Duration Returns 1 Month 1.5% 3 Month 2.4% 6 Month 12.9% 1 Year 26.4% 3 Year 16.2% 5 Year 13.9% 10 Year 15 Year Since launch 14.4% Historical performance (Yearly) on absolute basis
Year Returns 2023 20.7% 2022 5.1% 2021 24.7% 2020 14.6% 2019 12.5% 2018 3.8% 2017 29.1% 2016 3.4% 2015 -4.2% 2014 30.5% Fund Manager information for SBI Nifty Index Fund
Name Since Tenure Raviprakash Sharma 1 Feb 11 13.17 Yr. Mohit Jain 30 Nov 17 6.34 Yr. Data below for SBI Nifty Index Fund as on 31 Mar 24
Asset Allocation
Asset Class Value Equity 100.33% Top Securities Holdings / Portfolio
Name Holding Value Quantity HDFC Bank Ltd (Financial Services)
Equity, Since 31 Mar 03 | HDFCBANK11% ₹715 Cr 5,093,077
↑ 201,290 Reliance Industries Ltd (Energy)
Equity, Since 31 Jan 03 | RELIANCE10% ₹670 Cr 2,292,749
↑ 90,611 ICICI Bank Ltd (Financial Services)
Equity, Since 31 Jan 03 | ICICIBANK8% ₹500 Cr 4,753,870
↑ 187,888 Infosys Ltd (Technology)
Equity, Since 31 Jan 03 | INFY6% ₹405 Cr 2,419,176
↑ 95,609 Tata Consultancy Services Ltd (Technology)
Equity, Since 28 Feb 05 | TCS4% ₹281 Cr 686,610
↑ 27,131 Larsen & Toubro Ltd (Industrials)
Equity, Since 31 Dec 04 | LT4% ₹279 Cr 801,188
↑ 31,663 ITC Ltd (Consumer Defensive)
Equity, Since 29 Feb 12 | ITC4% ₹244 Cr 6,003,377
↑ 237,267 Axis Bank Ltd (Financial Services)
Equity, Since 28 Feb 10 | 5322153% ₹202 Cr 1,880,999
↑ 74,344 State Bank of India (Financial Services)
Equity, Since 31 Jan 03 | SBIN3% ₹195 Cr 2,600,957
↑ 102,796 Bharti Airtel Ltd (Communication Services)
Equity, Since 29 Feb 04 | BHARTIARTL3% ₹193 Cr 1,714,597
↑ 67,765 5. IDBI Nifty Index Fund
CAGR/Annualized return of 10.3% since its launch. Ranked 83 in Index Fund category. . IDBI Nifty Index Fund
Growth Launch Date 25 Jun 10 NAV (28 Jul 23) ₹36.2111 ↓ -0.02 (-0.06 %) Net Assets (Cr) ₹208 on 30 Jun 23 Category Others - Index Fund AMC IDBI Asset Management Limited Rating ☆ Risk Moderately High Expense Ratio 0.9 Sharpe Ratio 1.04 Information Ratio -3.93 Alpha Ratio -1.03 Min Investment 5,000 Min SIP Investment 500 Exit Load NIL Growth of 10,000 investment over the years.
Date Value 31 Mar 19 ₹10,000 31 Mar 20 ₹7,412 31 Mar 21 ₹12,637 31 Mar 22 ₹14,956 31 Mar 23 ₹14,904 Returns for IDBI Nifty Index Fund
absolute basis & more than 1 year are on CAGR (Compound Annual Growth Rate) basis. as on 19 Apr 24 Duration Returns 1 Month 3.7% 3 Month 9.1% 6 Month 11.9% 1 Year 16.2% 3 Year 20.3% 5 Year 11.7% 10 Year 15 Year Since launch 10.3% Historical performance (Yearly) on absolute basis
Year Returns 2023 2022 2021 2020 2019 2018 2017 2016 2015 2014 Fund Manager information for IDBI Nifty Index Fund
Name Since Tenure Data below for IDBI Nifty Index Fund as on 30 Jun 23
Asset Allocation
Asset Class Value Top Securities Holdings / Portfolio
Name Holding Value Quantity 6. Franklin India Index Fund Nifty Plan
CAGR/Annualized return of 12.9% since its launch. Ranked 76 in Index Fund category. Return for 2023 was 20.2% , 2022 was 4.9% and 2021 was 24.3% . Franklin India Index Fund Nifty Plan
Growth Launch Date 4 Aug 00 NAV (19 Apr 24) ₹176.543 ↑ 1.20 (0.68 %) Net Assets (Cr) ₹650 on 31 Mar 24 Category Others - Index Fund AMC Franklin Templeton Asst Mgmt(IND)Pvt Ltd Rating ☆ Risk Moderately High Expense Ratio 0.67 Sharpe Ratio 1.87 Information Ratio -4.4 Alpha Ratio -0.5 Min Investment 5,000 Min SIP Investment 500 Exit Load 0-30 Days (1%),30 Days and above(NIL) Growth of 10,000 investment over the years.
Date Value 31 Mar 19 ₹10,000 31 Mar 20 ₹7,437 31 Mar 21 ₹12,618 31 Mar 22 ₹15,031 31 Mar 23 ₹15,023 31 Mar 24 ₹19,379 Returns for Franklin India Index Fund Nifty Plan
absolute basis & more than 1 year are on CAGR (Compound Annual Growth Rate) basis. as on 19 Apr 24 Duration Returns 1 Month 1.5% 3 Month 2.4% 6 Month 12.8% 1 Year 26.1% 3 Year 15.9% 5 Year 13.7% 10 Year 15 Year Since launch 12.9% Historical performance (Yearly) on absolute basis
Year Returns 2023 20.2% 2022 4.9% 2021 24.3% 2020 14.7% 2019 12% 2018 3.2% 2017 28.3% 2016 3.3% 2015 -3.6% 2014 31.2% Fund Manager information for Franklin India Index Fund Nifty Plan
Name Since Tenure Varun Sharma 30 Nov 15 8.34 Yr. Sandeep Manam 18 Oct 21 2.45 Yr. Data below for Franklin India Index Fund Nifty Plan as on 31 Mar 24
Asset Allocation
Asset Class Value Cash 0.17% Equity 99.83% Top Securities Holdings / Portfolio
Name Holding Value Quantity HDFC Bank Ltd (Financial Services)
Equity, Since 31 Jan 03 | HDFCBANK11% ₹69 Cr 490,094 Reliance Industries Ltd (Energy)
Equity, Since 31 Jan 03 | RELIANCE10% ₹64 Cr 220,196 ICICI Bank Ltd (Financial Services)
Equity, Since 31 Jan 10 | ICICIBANK8% ₹48 Cr 457,350 Infosys Ltd (Technology)
Equity, Since 29 Feb 12 | INFY6% ₹39 Cr 230,417 Larsen & Toubro Ltd (Industrials)
Equity, Since 30 Jun 12 | LT4% ₹27 Cr 78,948 Tata Consultancy Services Ltd (Technology)
Equity, Since 28 Feb 05 | TCS4% ₹27 Cr 66,277 ITC Ltd (Consumer Defensive)
Equity, Since 31 Mar 11 | ITC4% ₹23 Cr 578,260 Axis Bank Ltd (Financial Services)
Equity, Since 30 Jun 09 | 5322153% ₹19 Cr 180,540 State Bank of India (Financial Services)
Equity, Since 31 Jan 03 | SBIN3% ₹19 Cr 250,625 Bharti Airtel Ltd (Communication Services)
Equity, Since 31 Mar 04 | BHARTIARTL3% ₹19 Cr 164,733 7. ICICI Prudential Nifty Next 50 Index Fund
CAGR/Annualized return of 13% since its launch. Ranked 5 in Index Fund category. Return for 2023 was 26.3% , 2022 was 0.1% and 2021 was 29.5% . ICICI Prudential Nifty Next 50 Index Fund
Growth Launch Date 25 Jun 10 NAV (19 Apr 24) ₹54.4318 ↓ -0.09 (-0.16 %) Net Assets (Cr) ₹4,444 on 31 Mar 24 Category Others - Index Fund AMC ICICI Prudential Asset Management Company Limited Rating ☆☆☆☆☆ Risk Moderately High Expense Ratio 0.7 Sharpe Ratio 3.08 Information Ratio -11.93 Alpha Ratio -0.63 Min Investment 5,000 Min SIP Investment 100 Exit Load 0-7 Days (0.25%),7 Days and above(NIL) Growth of 10,000 investment over the years.
Date Value 31 Mar 19 ₹10,000 31 Mar 20 ₹7,466 31 Mar 21 ₹12,014 31 Mar 22 ₹14,462 31 Mar 23 ₹13,294 31 Mar 24 ₹21,315 Returns for ICICI Prudential Nifty Next 50 Index Fund
absolute basis & more than 1 year are on CAGR (Compound Annual Growth Rate) basis. as on 19 Apr 24 Duration Returns 1 Month 7.8% 3 Month 13.2% 6 Month 37.6% 1 Year 60.8% 3 Year 22.1% 5 Year 16.7% 10 Year 15 Year Since launch 13% Historical performance (Yearly) on absolute basis
Year Returns 2023 26.3% 2022 0.1% 2021 29.5% 2020 14.3% 2019 0.6% 2018 -8.8% 2017 45.7% 2016 7.6% 2015 6.2% 2014 43.6% Fund Manager information for ICICI Prudential Nifty Next 50 Index Fund
Name Since Tenure Nishit Patel 18 Jan 21 3.2 Yr. Priya Sridhar 1 Feb 24 0.16 Yr. Ajaykumar Solanki 1 Feb 24 0.16 Yr. Data below for ICICI Prudential Nifty Next 50 Index Fund as on 31 Mar 24
Asset Allocation
Asset Class Value Equity 100.26% Top Securities Holdings / Portfolio
Name Holding Value Quantity Trent Ltd (Consumer Cyclical)
Equity, Since 30 Sep 23 | 5002515% ₹203 Cr 523,963
↑ 9,933 Bharat Electronics Ltd (Industrials)
Equity, Since 30 Sep 22 | BEL4% ₹175 Cr 8,515,007
↑ 161,393 Shriram Finance Ltd (Financial Services)
Equity, Since 30 Sep 23 | SHRIRAMFIN4% ₹161 Cr 660,654
↑ 12,522 Tata Power Co Ltd (Utilities)
Equity, Since 31 Aug 22 | 5004004% ₹150 Cr 4,026,034
↑ 76,308 Indian Oil Corp Ltd (Energy)
Equity, Since 31 Mar 22 | IOC3% ₹144 Cr 8,728,322
↑ 165,435 DLF Ltd (Real Estate)
Equity, Since 30 Apr 16 | 5328683% ₹138 Cr 1,529,988
↑ 28,999 Hindustan Aeronautics Ltd Ordinary Shares (Industrials)
Equity, Since 30 Sep 22 | HAL3% ₹137 Cr 445,166
↑ 8,438 TVS Motor Co Ltd (Consumer Cyclical)
Equity, Since 30 Sep 23 | 5323433% ₹118 Cr 553,419
↑ 10,492 Bank of Baroda (Financial Services)
Equity, Since 30 Sep 21 | 5321343% ₹117 Cr 4,425,804
↑ 83,888 GAIL (India) Ltd (Utilities)
Equity, Since 31 Mar 21 | 5321553% ₹117 Cr 6,408,712
↑ 121,469 8. IDBI Nifty Junior Index Fund
CAGR/Annualized return of 11.9% since its launch. Ranked 8 in Index Fund category. Return for 2023 was 25.7% , 2022 was 0.4% and 2021 was 29.6% . IDBI Nifty Junior Index Fund
Growth Launch Date 20 Sep 10 NAV (19 Apr 24) ₹45.9724 ↓ -0.08 (-0.17 %) Net Assets (Cr) ₹74 on 31 Mar 24 Category Others - Index Fund AMC IDBI Asset Management Limited Rating ☆☆☆☆☆ Risk Moderately High Expense Ratio 0.73 Sharpe Ratio 3.04 Information Ratio -7.21 Alpha Ratio -1.1 Min Investment 5,000 Min SIP Investment 500 Exit Load NIL Growth of 10,000 investment over the years.
Date Value 31 Mar 19 ₹10,000 31 Mar 20 ₹7,507 31 Mar 21 ₹11,944 31 Mar 22 ₹14,390 31 Mar 23 ₹13,246 31 Mar 24 ₹21,115 Returns for IDBI Nifty Junior Index Fund
absolute basis & more than 1 year are on CAGR (Compound Annual Growth Rate) basis. as on 19 Apr 24 Duration Returns 1 Month 7.7% 3 Month 13% 6 Month 37.2% 1 Year 60% 3 Year 21.9% 5 Year 16.5% 10 Year 15 Year Since launch 11.9% Historical performance (Yearly) on absolute basis
Year Returns 2023 25.7% 2022 0.4% 2021 29.6% 2020 13.7% 2019 0.5% 2018 -9.3% 2017 43.6% 2016 6.9% 2015 5.8% 2014 42.8% Fund Manager information for IDBI Nifty Junior Index Fund
Name Since Tenure Sumit Bhatnagar 3 Oct 23 0.49 Yr. Data below for IDBI Nifty Junior Index Fund as on 31 Mar 24
Asset Allocation
Asset Class Value Cash 0.24% Equity 99.76% Top Securities Holdings / Portfolio
Name Holding Value Quantity Trent Ltd (Consumer Cyclical)
Equity, Since 30 Sep 23 | 5002515% ₹3 Cr 8,901
↑ 112 Bharat Electronics Ltd (Industrials)
Equity, Since 30 Sep 22 | BEL4% ₹3 Cr 144,564
↑ 1,403 Shriram Finance Ltd (Financial Services)
Equity, Since 30 Sep 23 | SHRIRAMFIN4% ₹3 Cr 11,101
↑ 18 Tata Power Co Ltd (Utilities)
Equity, Since 31 Aug 22 | 5004004% ₹3 Cr 67,809
↓ -18 Indian Oil Corp Ltd (Energy)
Equity, Since 31 Mar 22 | IOC3% ₹2 Cr 146,756
↑ 359 Hindustan Aeronautics Ltd Ordinary Shares (Industrials)
Equity, Since 30 Sep 22 | HAL3% ₹2 Cr 7,556
↑ 73 DLF Ltd (Real Estate)
Equity, Since 30 Apr 16 | 5328683% ₹2 Cr 25,693
↓ -56 TVS Motor Co Ltd (Consumer Cyclical)
Equity, Since 30 Sep 23 | 5323433% ₹2 Cr 9,357
↑ 72 Bank of Baroda (Financial Services)
Equity, Since 30 Sep 21 | 5321343% ₹2 Cr 74,702
↑ 25 GAIL (India) Ltd (Utilities)
Equity, Since 31 Mar 21 | 5321553% ₹2 Cr 107,527
↓ -350 9. LIC MF Index Fund Nifty
CAGR/Annualized return of 12.9% since its launch. Ranked 80 in Index Fund category. Return for 2023 was 19.8% , 2022 was 4.7% and 2021 was 23.8% . LIC MF Index Fund Nifty
Growth Launch Date 14 Nov 02 NAV (19 Apr 24) ₹121.804 ↑ 0.83 (0.68 %) Net Assets (Cr) ₹296 on 31 Mar 24 Category Others - Index Fund AMC LIC Mutual Fund Asset Mgmt Co Ltd Rating ☆ Risk Moderately High Expense Ratio 0.94 Sharpe Ratio 1.8 Information Ratio -10.87 Alpha Ratio -1.25 Min Investment 5,000 Min SIP Investment 1,000 Exit Load 0-1 Months (1%),1 Months and above(NIL) Growth of 10,000 investment over the years.
Date Value 31 Mar 19 ₹10,000 31 Mar 20 ₹7,445 31 Mar 21 ₹12,648 31 Mar 22 ₹15,029 31 Mar 23 ₹14,979 31 Mar 24 ₹19,244 Returns for LIC MF Index Fund Nifty
absolute basis & more than 1 year are on CAGR (Compound Annual Growth Rate) basis. as on 19 Apr 24 Duration Returns 1 Month 1.4% 3 Month 2.3% 6 Month 12.6% 1 Year 25.6% 3 Year 15.6% 5 Year 13.6% 10 Year 15 Year Since launch 12.9% Historical performance (Yearly) on absolute basis
Year Returns 2023 19.8% 2022 4.7% 2021 23.8% 2020 14.7% 2019 12.6% 2018 2.6% 2017 28.6% 2016 2.7% 2015 -4.1% 2014 31.1% Fund Manager information for LIC MF Index Fund Nifty
Name Since Tenure Sumit Bhatnagar 3 Oct 23 0.49 Yr. Data below for LIC MF Index Fund Nifty as on 31 Mar 24
Asset Allocation
Asset Class Value Cash 0.13% Equity 99.87% Top Securities Holdings / Portfolio
Name Holding Value Quantity HDFC Bank Ltd (Financial Services)
Equity, Since 30 Apr 09 | HDFCBANK11% ₹31 Cr 218,011
↓ -1,331 Reliance Industries Ltd (Energy)
Equity, Since 31 Mar 12 | RELIANCE10% ₹29 Cr 98,104
↓ -883 ICICI Bank Ltd (Financial Services)
Equity, Since 30 Apr 09 | ICICIBANK8% ₹21 Cr 203,168
↓ -2,181 Infosys Ltd (Technology)
Equity, Since 31 Jan 03 | INFY6% ₹17 Cr 104,025
↑ 06 Tata Consultancy Services Ltd (Technology)
Equity, Since 31 Mar 05 | TCS4% ₹12 Cr 29,346
↓ -297 Larsen & Toubro Ltd (Industrials)
Equity, Since 30 Apr 09 | LT4% ₹12 Cr 34,244
↓ -198 ITC Ltd (Consumer Defensive)
Equity, Since 31 Jan 03 | ITC4% ₹10 Cr 257,478
↓ -969 Axis Bank Ltd (Financial Services)
Equity, Since 31 Mar 09 | 5322153% ₹9 Cr 80,922
↓ -542 State Bank of India (Financial Services)
Equity, Since 30 Apr 09 | SBIN3% ₹8 Cr 110,934
↓ -1,078 Bharti Airtel Ltd (Communication Services)
Equity, Since 30 Apr 09 | BHARTIARTL3% ₹8 Cr 73,221
↓ -750
નિષ્ક્રિય ઇન્ડેક્સ ફંડ શા માટે વધુ સારું છે?
ભારતમાં મ્યુચ્યુઅલ ફંડ એસોસિએશન (AMFI) જણાવ્યું હતું કે ઇન્ડેક્સ ફંડ્સે AUM ભેગી કરી હતીરૂ. 7717 કરોડ છે નવેમ્બર 2019 ના રોજ. નિષ્ક્રિય લાર્જ-કેપ ETFs સક્રિય રીતે સંચાલિતની તુલનામાં 11.53% વળતર આપે છેલાર્જ કેપ ફંડ્સ જે 10.19% ઓફર કરે છે.
ગોલ્ડ ઇટીએફ પર ઊભો હતોરૂ. 5,540.40 કરોડ છે નવેમ્બર 2019 મુજબ. આ રૂ.ની સરખામણીમાં આવે છે. ડિસેમ્બર 2018 માં 4,571 કરોડ. અન્ય ETFs ની AUM રૂ. 1,63,923.66 કરોડની સરખામણીમાં રૂ. 2018 ના અંતે 1,07,363 કરોડ.
લાર્જ કેપ ઇટીએફ
2019 ના મોટા ભાગના સાક્ષી છે કે લાર્જ-કેપ સ્કીમ્સ રિટર્ન ચાર્ટમાં ટોચ પર હતી. 2020 માં પણ, ટોચની 15 લાર્જ-કેપ યોજનાઓમાંથી નવ છેનિષ્ક્રિય ભંડોળ.
નિષ્ક્રિય ભંડોળ - કોરોનાવાયરસ રોગચાળા વચ્ચે સલામત સ્વર્ગ
સમગ્ર વિશ્વમાં વર્તમાન પરિસ્થિતિ સાથે, નાણાકીય બજારો ઊંડી ચિંતાના મુદ્દાઓનો સામનો કરી રહ્યા છે. જ્યારે રોકાણકારો ભૂતકાળમાં જોખમ લેવા તૈયાર હતા, ત્યારે આજની પરિસ્થિતિઓએ મોટાભાગના રોકાણકારોને જોખમ લેવા માટે દબાણ કર્યું છે.સલામત આશ્રયસ્થાન. આનો અર્થ એ છે કે તેઓ એવા રોકાણની શોધમાં છે જે વધુ વળતર અથવા ઓછામાં ઓછું સ્થિર વળતર આપે.
ઘણા રોકાણકારો હવે એક્સચેન્જ-ટ્રેડેડ ફંડ્સ અથવા ઈન્ડેક્સ ફંડ્સ જેવા નિષ્ક્રિય મોડ દ્વારા રોકાણ કરવા માગે છે. AMFI મુજબ, ઈન્ડેક્સ ફંડ્સમાં ઈન્ફ્લોએ સર્વકાલીન ઉચ્ચ સ્તરનો સામનો કર્યો હતોરૂ. 2076.5 કરોડ છે માર્ચ 2020 માં.
નિષ્ક્રિય ભંડોળ વિ સક્રિય ભંડોળ
તેઓ જે રીતે કાર્ય કરે છે અને રોકાણકારને અસર કરે છે તેમાં ચોક્કસ તફાવત છે.
ટેબ્યુલર નિષ્ક્રિય ભંડોળ અને સક્રિય ભંડોળ વચ્ચે તફાવત કરે છે:
| નિષ્ક્રિય ભંડોળ | સક્રિય ભંડોળ |
|---|---|
| તેમની પાસે ફંડ મેનેજરોની સક્રિય ભાગીદારી નથી | ફંડ મેનેજરો ઘણાં ઉદ્યોગ સંશોધન કરે છે અને બજારની કામગીરીના આધારે વિવિધ સિક્યોરિટીઝમાં ફંડ પસંદ કરવા તે મુજબ પગલાં લે છે |
| ઓછુ ખર્ચાળ | રોકાણની દિશામાં કોઈ કામ મૂકવામાં આવ્યું હોવાથી તે મોંઘું હોઈ શકે છે |
| ઓછા ખર્ચના ગુણોત્તરને કારણે લોકપ્રિય | ઊંચા ખર્ચના ગુણોત્તરને કારણે ઓછી લોકપ્રિય હોઈ શકે છે |
ઈન્ડેક્સ ફંડ્સમાં રોકાણના જોખમો
ઈન્ડેક્સ મ્યુચ્યુઅલ ફંડની કોઈ સુગમતા નથી
એક મુખ્ય ગેરલાભ એ લવચીકતાનો અભાવ છે. ફંડ્સ માત્ર ઇન્ડેક્સને ટ્રૅક કરે છે, તેથી તેઓ ઊંચા વળતરની તક ગુમાવી શકે છે જે બજારની વિસંગતતાઓ અને ઇન્ડેક્સ સાથે જોડાયેલ ન હોય તેવા આશ્ચર્યને કારણે ઊભી થઈ શકે છે. સામાન્ય રીતે, મૂલ્યના શેરોને ઇન્ડેક્સનો ભાગ બનવું ખૂબ મુશ્કેલ લાગે છે.
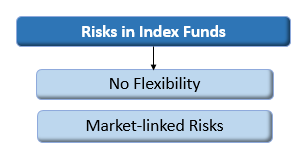
ઈન્ડેક્સ મ્યુચ્યુઅલ ફંડ્સ પર બજારનું જોખમ
તેઓનો બજાર સાથે સીધો સંબંધ છે. તેથી, જ્યારે શેરબજારો એકંદરે ઘટે છે, ત્યારે ઈન્ડેક્સ મ્યુચ્યુઅલ ફંડનું મૂલ્ય પણ ઘટે છે.
કેટલાક ગેરફાયદા હોવા છતાં, ટોચના ઇન્ડેક્સ ફંડો રોકાણ કરવા માંગતા રોકાણકારો માટે ફાયદાકારક બની શકે છે.ઇક્વિટી ન્યૂનતમ જોખમ સાથેપરિબળ. નિષ્ણાતોના જણાવ્યા મુજબ, રોકાણકારોને તેમના રોકાણમાંથી શ્રેષ્ઠ બનાવવા માટે તેમના રોકાણ પોર્ટફોલિયોમાં 5-6% ઇન્ડેક્સ ફંડનો સમાવેશ કરવાનું સૂચન કરવામાં આવે છે.
ઈન્ડેક્સ મ્યુચ્યુઅલ ફંડમાં ઓનલાઈન કેવી રીતે રોકાણ કરવું?
Fincash.com પર આજીવન માટે મફત રોકાણ ખાતું ખોલો.
તમારી નોંધણી અને KYC પ્રક્રિયા પૂર્ણ કરો
દસ્તાવેજો અપલોડ કરો (PAN, આધાર, વગેરે).અને, તમે રોકાણ કરવા માટે તૈયાર છો!
FAQs
1. તમારે ઈન્ડેક્સ મ્યુચ્યુઅલ ફંડમાં શા માટે રોકાણ કરવું જોઈએ?
અ: જો તમે લાંબા ગાળાનું રોકાણ કરવા માંગતા હો, તો તમે ઇન્ડેક્સ ફંડનો વિચાર કરી શકો છો. આ ફંડ્સના પોર્ટફોલિયોની રચના NSE અને SENSEXની રચના અને વર્તણૂક પર નજર રાખીને કરવામાં આવે છે. આ પોર્ટફોલિયો લાંબા ગાળામાં શેરોના પ્રદર્શન અને શેરનું મૂલ્યાંકન કરીને વિકસાવવામાં આવતા હોવાથી, તમારા રોકાણની કામગીરી ન થવાની શક્યતાઓ ઓછી થઈ જાય છે. તેથી, ઈન્ડેક્સ મ્યુચ્યુઅલ ફંડમાં રોકાણ કરવાની સલાહ આપવામાં આવે છે, ખાસ કરીને જો તમે જોખમ ઘટાડવા માંગતા હોવ.
2. ચોક્કસ ઇન્ડેક્સ એમએફ કેવી રીતે પસંદ કરવું?
અ: તમારે ઈન્ડેક્સ મ્યુચ્યુઅલ ફંડ્સના લાંબા ગાળાના પ્રદર્શનના આધારે વ્યક્તિગત પોર્ટફોલિયો પસંદ કરવો જોઈએ. કેટલાક વધુ ભરોસાપાત્ર ફંડો SBI, LICI, ICICI પ્રુડેન્શિયલ UTI અને અન્ય સમાન ઇન્ડેક્સ ફંડ બેન્ચમાર્કિંગ માટેના આધાર તરીકે ઉપયોગમાં લેવાય છે.
3. ઈન્ડેક્સ ફંડમાં રોકાણ કરવાનો મુખ્ય ફાયદો શું છે?
અ: ઇન્ડેક્સ ફંડ નિષ્ક્રિય રીતે સંચાલિત થાય છે. આમ, ઈન્ડેક્સ ફંડનો કુલ ખર્ચ ગુણોત્તર અથવા TER સક્રિય રીતે સંચાલિત ફંડ્સ કરતા ઓછો છે. આનો અર્થ એ છે કે તમારું રોકાણ ઓછું હશે, અને તમે જે ખર્ચની અપેક્ષા રાખી શકો છો તેટલો ઓછો હોઈ શકે છે0.2% થી 0.5% તમારા રોકાણની. ઈન્ડેક્સ ફંડમાં રોકાણ કરવાનો મુખ્ય ફાયદો ઓછો TER છે.
4. SBI નિફ્ટી ઇન્ડેક્સ ફંડ પાસેથી કેટલી અપેક્ષા રાખવી?
અ: SBI નિફ્ટી ઇન્ડેક્સ ફંડ નિષ્ક્રિય રીતે સંચાલિત થાય છે અને વૃદ્ધિ દર દર્શાવે છે15.19% નિફ્ટી 50 વિરુદ્ધ, જેનો વિકાસ દર છે15.5%. તેથી જો તમે SBI નિફ્ટી ઇન્ડેક્સ ફંડમાં 10-વર્ષનું રોકાણ કરો છો, તો તમે અપેક્ષા રાખી શકો છો85.77% તમારા રોકાણ પર વળતર.
5. જો તમે ICICI પ્રુડેન્શિયલ નિફ્ટી ઇન્ડેક્સ ફંડમાં રોકાણ કરો તો તમે શું અપેક્ષા રાખી શકો?
અ: ICICI પ્રુડેન્શિયલ નિફ્ટી ઇન્ડેક્સ ફંડની કેટેગરી એવરેજ છે16.78%. ધારો કે, જો તમે 5 વર્ષ માટે રોકાણ કરો છો, તો તમે સંપૂર્ણ વળતરની અપેક્ષા રાખી શકો છો45.88%.
6. ઇન્ડેક્સ ફંડ્સ વૈવિધ્યકરણમાં કેવી રીતે ઉમેરે છે?
અ: ઈન્ડેક્સ ફંડમાં મુખ્યત્વે ટોચની કંપનીઓનો સમાવેશ થાય છે જેમના સ્ટોકનો ઉપયોગ બેન્ચમાર્ક તરીકે થાય છે. વધુમાં, એક જ પોર્ટફોલિયોમાં, તમારી પાસે બહુવિધ અગ્રણી કંપનીઓ હશે, જેનો અર્થ છે કે તમારું રોકાણ ગુમાવવાની શક્યતા ઘટી જશે. આ ઓટો ડાઇવર્સિફિકેશન આપમેળે રોકાણકારોનું રોકાણ ગુમાવવાનું જોખમ ઘટાડે છે.
7. તમારે ઈન્ડેક્સ ફંડમાં ક્યારે રોકાણ કરવાનું વિચારવું જોઈએ?
અ: જ્યારે તમે તમારા રોકાણને ઓછામાં ઓછા 5 વર્ષ સુધી રાખવા માટે તૈયાર હોવ ત્યારે તમારે ઈન્ડેક્સ ફંડ્સમાં રોકાણ કરવું જોઈએ.
8. શું એવી કોઈ રીત છે કે જેનાથી હું શ્રેષ્ઠ ઈન્ડેક્સ ફંડ પસંદ કરી શકું?
અ: જો તમે નવા છો તો તમારે ફંડ મેનેજર સાથે તેની ચર્ચા કરવી જોઈએ. તેઓ તમને યોગ્ય ભંડોળ નક્કી કરવામાં મદદ કરે છે. વધુમાં, તમારે રોકાણનો સમયગાળો પણ ધ્યાનમાં લેવો જોઈએ.
9. ઈન્ડેક્સ ફંડ્સમાં રોકાણ કરવા માટે કોણ આદર્શ રીતે યોગ્ય છે?
અ: વ્યક્તિઓ કે જેઓ જ્યારે વધુ જોખમ લેવા માંગતા નથીમ્યુચ્યુઅલ ફંડમાં રોકાણ ઇન્ડેક્સ ફંડમાં રોકાણ કરવાનું વિચારી શકો છો. આ ભંડોળ માત્ર રોકાણકારોને ચોક્કસ વળતરની ખાતરી આપતા નથી, પરંતુ રોકાણકાર પાસેથી વ્યાપક રોકાણની પણ જરૂર નથી.
અહીં આપેલી માહિતી સચોટ છે તેની ખાતરી કરવા માટેના તમામ પ્રયાસો કરવામાં આવ્યા છે. જો કે, ડેટાની શુદ્ધતા અંગે કોઈ ગેરંટી આપવામાં આવતી નથી. કોઈપણ રોકાણ કરતા પહેલા કૃપા કરીને સ્કીમ માહિતી દસ્તાવેજ સાથે ચકાસો.
You Might Also Like


AMFI Registration No. 112358 | CIN: U74999MH2016PTC282153
Shepard Technologies Pvt. Ltd. (with ARN code 112358) makes no warranties or representations, express or implied, on products offered through the platform. It accepts no liability for any damages or losses, however caused, in connection with the use of, or on the reliance of its product or related services. Terms and conditions of the website are applicable.
©2024 Shepard Technologies Private Limited. All Rights Reserved
Quite detailed review which helps in deciding which is a better performing index fund