Table of Contents
Mutual Fund Return Calculator
Mutual Fund return calculator refers to a smart tool that helps us to check how the investment grows over a period of time. People can invest in Mutual Funds either through lumpsum or SIP mode. In the lumpsum mode, people invest a considerable amount at one stretch and hold it for a certain period. Contrarily, in SIP mode people invest in small amounts at regular intervals. Therefore, the calculator plays a key role in any investment mode. So, let us understand how the importance of Mutual Fund return calculator both lumpsum and SIP ones, how to use them and the best mutual funds for investment.
Mutual Fund SIP Calculator
sip calculator is a smart tool that helps to determine the amount to be invested along with the tenure to attain their objectives. It also shows how the SIP investment grows over a period of time. As SIP is known as a goal-based investment; through SIP people plan to attain various objectives such as purchasing a house, purchasing a vehicle, Retirement planning, and much more. The illustration given below shows how the SIP investment grows over a given period.
Know Your SIP Returns
Illustration
- Monthly Investment: INR 1,500
- Investment Tenure: 12 Years
- Total Amount Invested: INR 2,16,000
- Expected Long-term Growth on Investment: 16% (approx.)
- Expected Long-term Inflation: 5% (approx.)
The graph given below shows how the SIP investment grows given the above-mentioned parameters grows over the tenure 12 years.
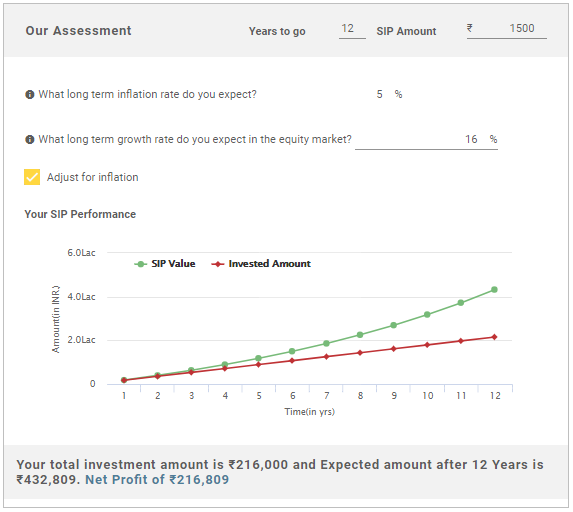
From the above image, we can say that at the end of 12th year, the total value of the investment would be INR 4,32,809 and the net profit on the investment would be INR 2,16,809.
Talk to our investment specialist
How does a Mutual Fund SIP Calculator Work?
In order to check how the SIP calculator works, there are certain details or questions whose related data need to be entered. So, let us look at the questions that need to be answered to find how the SIP calculator works:
- What would be the tenure of the investment or for how long are you planning to invest.
- How much amount are you planning to invest.
- Your expected growth rate in the equity Market for long-run.
- Your expected inflation rate in the long-term.
You need to be ready with the data related to the questions before doing the calculation. People also click on Next button after entering the details wherever required. Thus, we can say that by using Mutual Fund return calculator related to SIP, people can assess what will be their SIP value at the end of their expected tenure.
Now, let us shift our focus towards Lumpsum calculator.
Mutual Fund Lumpsum Return Calculator
Lumpsum investment in Mutual Fund refers to the Investing a considerable amount in Mutual Funds as a onetime activity. People having a considerable amount lying in their Bank account can choose to invest lump sum amount. There is a difference between a lumpsum calculator and SIP calculator. The lumpsum calculator helps people to assess how their onetime investment grows over a period of time. So, let us understand how the lumpsum returns grow over a given timeframe.
Illustration
- Onetime Investment Amount: INR 15,000
- Investment Tenure: 12 Years
- Total Amount Invested: INR 15,000
- Expected Long-term Growth on Investment: 16% (approx.)
- Expected Long-term Inflation: 5% (approx.)
The graph given below shows how the lumpsum investment grows given the above-mentioned parameters grows over the tenure 12 years.
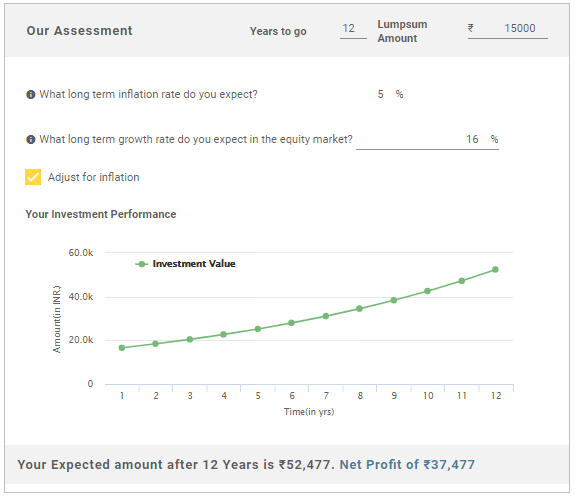
From the above image, we can say that at the end of 12th year, the total value of the investment would be INR 52,477 and the net profit on the investment would be INR 37,477.
How does a Mutual Fund Lumpsum Return Calculator Work?
The functioning process of a Mutual Fund lumpsum return calculator and SIP calculator is the same. However, people in this situation need to enter the lumpsum investment amount instead of SIP amount. However, the rest of the data related to investment tenure, expected long-term growth rate, and expected long-term inflation remains the same. Here too, you need to be ready with the data related to the questions before doing the calculation and click on Next button after entering the details wherever required.
Thus, we can say it is easy to use both the Mutual Fund calculators for lumpsum as well as SIP investment. Nevertheless, though people can use both of them but before making any investment; it is important to understand the modalities of the scheme completely. In addition, people can consult a financial advisor if required, to ensure that their investment gives them the required returns.
Top Funds for 2024
*Best funds based on 3 year performance.
The objective of the scheme would be to provide investors with opportunities for long-term growth in capital along with the liquidity of an open-ended scheme through an active management of investments in a diversified basket of equity stocks of domestic Public Sector Undertakings and in debt and money market instruments issued by PSUs AND others. SBI PSU Fund is a Equity - Sectoral fund was launched on 7 Jul 10. It is a fund with High risk and has given a Below is the key information for SBI PSU Fund Returns up to 1 year are on To seek long-term capital appreciation by investing predominantly in equity and equity related securities of companies engaged in or expected to benefit from growth and development of infrastructure. HDFC Infrastructure Fund is a Equity - Sectoral fund was launched on 10 Mar 08. It is a fund with High risk and has given a Below is the key information for HDFC Infrastructure Fund Returns up to 1 year are on 1. SBI PSU Fund
CAGR/Annualized return of 8.2% since its launch. Ranked 31 in Sectoral category. Return for 2023 was 54% , 2022 was 29% and 2021 was 32.4% . SBI PSU Fund
Growth Launch Date 7 Jul 10 NAV (19 Apr 24) ₹29.4771 ↑ 0.08 (0.28 %) Net Assets (Cr) ₹1,876 on 31 Mar 24 Category Equity - Sectoral AMC SBI Funds Management Private Limited Rating ☆☆ Risk High Expense Ratio 2.52 Sharpe Ratio 2.62 Information Ratio -1.01 Alpha Ratio -9.05 Min Investment 5,000 Min SIP Investment 500 Exit Load 0-1 Years (1%),1 Years and above(NIL) Growth of 10,000 investment over the years.
Date Value 31 Mar 19 ₹10,000 31 Mar 20 ₹7,245 31 Mar 21 ₹10,059 31 Mar 22 ₹12,594 31 Mar 23 ₹14,369 31 Mar 24 ₹26,864 Returns for SBI PSU Fund
absolute basis & more than 1 year are on CAGR (Compound Annual Growth Rate) basis. as on 19 Apr 24 Duration Returns 1 Month 10.5% 3 Month 14.3% 6 Month 47.4% 1 Year 89.8% 3 Year 42.4% 5 Year 23.3% 10 Year 15 Year Since launch 8.2% Historical performance (Yearly) on absolute basis
Year Returns 2023 54% 2022 29% 2021 32.4% 2020 -10% 2019 6% 2018 -23.8% 2017 21.9% 2016 16.2% 2015 -11.1% 2014 41.5% Fund Manager information for SBI PSU Fund
Name Since Tenure Richard D'souza 1 Aug 14 9.67 Yr. Data below for SBI PSU Fund as on 31 Mar 24
Equity Sector Allocation
Sector Value Financial Services 36.97% Utility 19.35% Industrials 12.44% Energy 12.3% Basic Materials 12.24% Asset Allocation
Asset Class Value Cash 6.7% Equity 93.3% Top Securities Holdings / Portfolio
Name Holding Value Quantity State Bank of India (Financial Services)
Equity, Since 31 Jul 10 | SBIN10% ₹170 Cr 2,277,500 NTPC Ltd (Utilities)
Equity, Since 31 Jul 10 | 5325558% ₹146 Cr 4,343,244
↑ 1,500,000 Power Grid Corp Of India Ltd (Utilities)
Equity, Since 31 Jul 10 | 5328987% ₹128 Cr 4,535,554
↑ 1,200,000 Oil & Natural Gas Corp Ltd (Energy)
Equity, Since 31 May 20 | 5003125% ₹91 Cr 3,455,000 Housing & Urban Development Corp Ltd (Financial Services)
Equity, Since 30 Nov 22 | 5405305% ₹83 Cr 4,350,000 RITES Ltd Ordinary Shares (Industrials)
Equity, Since 31 Oct 22 | RITES4% ₹73 Cr 930,000
↑ 235,000 Indian Oil Corp Ltd (Energy)
Equity, Since 31 Aug 15 | IOC4% ₹71 Cr 4,281,804
↑ 3,000,000 Bharat Heavy Electricals Ltd (Industrials)
Equity, Since 31 Jul 23 | 5001034% ₹68 Cr 3,000,000 NHPC Ltd (Utilities)
Equity, Since 31 Jan 24 | NHPC4% ₹67 Cr 7,600,000
↑ 4,100,000 Punjab National Bank (Financial Services)
Equity, Since 31 Dec 19 | 5324614% ₹66 Cr 5,425,000 2. HDFC Infrastructure Fund
CAGR/Annualized return of since its launch. Ranked 26 in Sectoral category. Return for 2023 was 55.4% , 2022 was 19.3% and 2021 was 43.2% . HDFC Infrastructure Fund
Growth Launch Date 10 Mar 08 NAV (19 Apr 24) ₹42.583 ↑ 0.32 (0.75 %) Net Assets (Cr) ₹1,663 on 31 Mar 24 Category Equity - Sectoral AMC HDFC Asset Management Company Limited Rating ☆☆☆ Risk High Expense Ratio 2.56 Sharpe Ratio 4.42 Information Ratio 0 Alpha Ratio 0 Min Investment 5,000 Min SIP Investment 300 Exit Load 0-1 Years (1%),1 Years and above(NIL) Growth of 10,000 investment over the years.
Date Value 31 Mar 19 ₹10,000 31 Mar 20 ₹5,234 31 Mar 21 ₹9,084 31 Mar 22 ₹11,372 31 Mar 23 ₹13,231 31 Mar 24 ₹23,733 Returns for HDFC Infrastructure Fund
absolute basis & more than 1 year are on CAGR (Compound Annual Growth Rate) basis. as on 19 Apr 24 Duration Returns 1 Month 7.5% 3 Month 10.6% 6 Month 28.6% 1 Year 81.1% 3 Year 41.2% 5 Year 20.1% 10 Year 15 Year Since launch Historical performance (Yearly) on absolute basis
Year Returns 2023 55.4% 2022 19.3% 2021 43.2% 2020 -7.5% 2019 -3.4% 2018 -29% 2017 43.3% 2016 -1.9% 2015 -2.5% 2014 73.9% Fund Manager information for HDFC Infrastructure Fund
Name Since Tenure Srinivasan Ramamurthy 12 Jan 24 0.22 Yr. Dhruv Muchhal 22 Jun 23 0.78 Yr. Data below for HDFC Infrastructure Fund as on 31 Mar 24
Equity Sector Allocation
Sector Value Industrials 39.92% Financial Services 19.36% Basic Materials 8.4% Energy 6.79% Utility 4.35% Communication Services 3.49% Consumer Cyclical 2.68% Technology 1.83% Real Estate 1.18% Asset Allocation
Asset Class Value Cash 10.58% Equity 88.01% Debt 1.41% Top Securities Holdings / Portfolio
Name Holding Value Quantity ICICI Bank Ltd (Financial Services)
Equity, Since 31 Oct 09 | ICICIBANK7% ₹113 Cr 1,075,000 J Kumar Infraprojects Ltd (Industrials)
Equity, Since 31 Oct 15 | JKIL6% ₹97 Cr 1,500,000
↓ -113,625 Coal India Ltd (Energy)
Equity, Since 31 Oct 18 | COALINDIA5% ₹83 Cr 1,900,000
↓ -265,000 Larsen & Toubro Ltd (Industrials)
Equity, Since 30 Jun 12 | LT5% ₹73 Cr 209,762 NTPC Ltd (Utilities)
Equity, Since 31 Dec 17 | 5325554% ₹70 Cr 2,084,125 Kalpataru Projects International Ltd (Industrials)
Equity, Since 31 Jan 23 | KPIL4% ₹66 Cr 683,608 Bharti Airtel Ltd (Communication Services)
Equity, Since 30 Sep 20 | BHARTIARTL3% ₹56 Cr 500,000
↑ 360,000 HDFC Bank Ltd (Financial Services)
Equity, Since 31 Aug 23 | HDFCBANK3% ₹56 Cr 400,000
↑ 50,000 State Bank of India (Financial Services)
Equity, Since 31 Mar 08 | SBIN3% ₹53 Cr 704,361 Inox Wind Ltd (Industrials)
Equity, Since 31 Oct 23 | INOXWIND3% ₹42 Cr 700,000
↓ -266,489
All efforts have been made to ensure the information provided here is accurate. However, no guarantees are made regarding correctness of data. Please verify with scheme information document before making any investment.


")
")


AMFI Registration No. 112358 | CIN: U74999MH2016PTC282153
Shepard Technologies Pvt. Ltd. (with ARN code 112358) makes no warranties or representations, express or implied, on products offered through the platform. It accepts no liability for any damages or losses, however caused, in connection with the use of, or on the reliance of its product or related services. Terms and conditions of the website are applicable.
©2024 Shepard Technologies Private Limited. All Rights Reserved