 +91-22-48913909
Table of Contents
- متوازن میوچل فنڈز میں کیوں سرمایہ کاری کریں؟
- ٹاپ بیلنسڈ فنڈز کے فائدے اور نقصانات
- مالی سال 22 - 23 کی سرمایہ کاری کے لیے بہترین کارکردگی کا مظاہرہ کرنے والے متوازن فنڈز یا ہائبرڈ فنڈز
- متوازن میوچل فنڈز میں آن لائن سرمایہ کاری کیسے کی جائے؟
Top 11 Funds
- ICICI Prudential Equity and Debt Fund
- HDFC Balanced Advantage Fund
- BOI AXA Mid and Small Cap Equity and Debt Fund
- ICICI Prudential Multi-Asset Fund
- JM Equity Hybrid Fund
- Edelweiss Multi Asset Allocation Fund
- UTI Hybrid Equity Fund
- UTI Multi Asset Fund
- Nippon India Equity Hybrid Fund
- BNP Paribas Substantial Equity Hybrid Fund
- Franklin India Equity Hybrid Fund
بہترین متوازن میوچل فنڈز 2022
اوپرمتوازن فنڈ ہیںباہمی چندہ جو اپنے اثاثوں کو ایکوئٹی اور قرض کے آلے دونوں میں لگاتے ہیں تاکہ مجموعی طور پر اچھا منافع حاصل ہو سکے۔ متوازن میوچل فنڈز ان سرمایہ کاروں کے لیے فائدہ مند ہیں جو ایک لینے کے لیے تیار ہیں۔مارکیٹ خطرے کے ساتھ ساتھ کچھ مقررہ واپسی کی تلاش میں۔
ایکوئٹی اور اسٹاک میں لگائے گئے اثاثے مارکیٹ سے منسلک منافع پیش کرتے ہیں جبکہ قرض کے آلات میں لگائے گئے اثاثے مقررہ منافع پیش کرتے ہیں۔ ایکویٹی اور قرض دونوں کا مجموعہ ہونے کی وجہ سے، سرمایہ کاروں کو بہت محتاط رہنا چاہیے۔سرمایہ کاری ان فنڈز میں. سرمایہ کاروں کو مشورہ دیا جاتا ہے کہ وہ متوازن میوچل فنڈز میں سرمایہ کاری کرنے سے پہلے اعلیٰ متوازن فنڈز تلاش کریں۔ ہم نے ذیل میں اعلیٰ متوازن میوچل فنڈز کی فہرست دی ہے۔
متوازن میوچل فنڈز میں کیوں سرمایہ کاری کریں؟
عام طور پر، سرمایہ کار اپنی سرمایہ کاری کو کم خطرے کے ساتھ کم وقت کے اندر متنوع بنانے کے طریقے تلاش کرتے ہیں۔ ایکویٹی اور قرض دونوں آلات کا مجموعہ ہونے کے ناطے، متوازن میوچل فنڈز ان دونوں جہانوں میں بہترین پیش کش کرتے ہیں۔ لہٰذا، یہ فنڈز مارکیٹ کے مسلسل بدلتے ہوئے حالات کی وجہ سے تنزلی کے خطرے کو کم کرتے ہیں جبکہ قرض کی نمائش کی وجہ سے کچھ بنیادی ریٹرن کا انتظام کرتے ہیں۔ یہ متوازن فنڈز ان سرمایہ کاروں کے لیے سرمایہ کاری کا ایک انتہائی موزوں آپشن بناتا ہے جو 100% میں سرمایہ کاری کے مقابلے میں قدرے کم رسک کے ساتھ منافع حاصل کرنے کے درمیانی راستے کی تلاش میں ہیں۔ایکویٹی فنڈز.
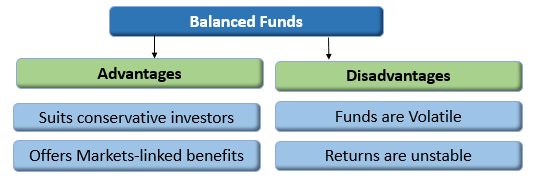
ٹاپ بیلنسڈ فنڈز کے فائدے اور نقصانات
فوائد
- 35-40% اثاثوں کو فکسڈ میں لگا کر مستحکم منافع فراہم کرتا ہے۔آمدنی اختیارات
- ایکوئٹی میں اثاثوں کا 60-65% سرمایہ کاری کرکے مارکیٹ سے منسلک منافع کی پیشکش کرتا ہے
- قدامت پسند سرمایہ کاروں کے لیے موزوں ہے جو اعتدال پسند خطرہ مول لینے کو تیار ہیں۔
نقصانات
- ایکویٹیز میں لگائے گئے فنڈز غیر مستحکم ہوتے ہیں اور ان کا خطرہ زیادہ ہوتا ہے۔عنصر
- مشترکہ منافع (قرض اور ایکویٹی میوچل فنڈز دونوں کی واپسی) طویل مدت میں بہت اچھا منافع نہیں دے سکتے
Talk to our investment specialist
مالی سال 22 - 23 کی سرمایہ کاری کے لیے بہترین کارکردگی کا مظاہرہ کرنے والے متوازن فنڈز یا ہائبرڈ فنڈز
اعلی کارکردگی کا مظاہرہ کرنے والے جارحانہ ہائبرڈ فنڈز
یہ فنڈ اپنے کل اثاثوں کا تقریباً 65 سے 85 فیصد ایکویٹی سے متعلقہ آلات میں اور تقریباً 20 سے 35 فیصد اپنے اثاثوں کو قرض کے آلات میں لگائے گا۔میوچل فنڈ ہاؤسز یا تو ایک متوازن ہائبرڈ یا جارحانہ ہائبرڈ فنڈ پیش کر سکتا ہے، دونوں نہیں۔
Fund NAV Net Assets (Cr) 3 MO (%) 6 MO (%) 1 YR (%) 3 YR (%) 5 YR (%) 2023 (%) ICICI Prudential Equity and Debt Fund Growth ₹337.92
↑ 1.46 ₹32,429 7.8 18.7 39 25.4 20.1 28.2 BOI AXA Mid and Small Cap Equity and Debt Fund Growth ₹33.52
↓ -0.01 ₹657 5.3 19.3 45.9 24.6 20.9 33.7 JM Equity Hybrid Fund Growth ₹108.136
↑ 0.04 ₹202 5.8 21 50.6 23.8 18.2 33.8 UTI Hybrid Equity Fund Growth ₹345.665
↑ 0.88 ₹5,243 4.1 13.7 31.4 18.7 15.2 25.5 Nippon India Equity Hybrid Fund Growth ₹91.0513
↑ 0.18 ₹3,399 4.2 13.1 29.4 17.1 10.5 24.1 Note: Returns up to 1 year are on absolute basis & more than 1 year are on CAGR basis. as on 19 Apr 24
اعلی کارکردگی کا مظاہرہ کرنے والے قدامت پسند ہائبرڈ فنڈز
یہ اسکیم بڑے پیمانے پر قرض کے آلات میں سرمایہ کاری کرے گی۔ ان کے کل اثاثوں کا تقریباً 75 سے 90 فیصد قرض کے آلات میں اور تقریباً 10 سے 25 فیصد ایکویٹی سے متعلقہ آلات میں سرمایہ کاری کریں گے۔ اس اسکیم کو قدامت پسندی کا نام دیا گیا ہے کیونکہ یہ ان لوگوں کے لیے ہے جو خطرے سے بچتے ہیں۔ وہ سرمایہ کار جو اپنی سرمایہ کاری میں زیادہ خطرہ مول نہیں لینا چاہتے وہ اس اسکیم میں سرمایہ کاری کو ترجیح دے سکتے ہیں۔
Fund NAV Net Assets (Cr) 3 MO (%) 6 MO (%) 1 YR (%) 3 YR (%) 5 YR (%) 2023 (%) HDFC Hybrid Debt Fund Growth ₹74.1033
↓ -0.03 ₹3,093 2.9 8.2 15.9 11.2 10.2 13.9 Kotak Debt Hybrid Fund Growth ₹52.2484
↓ -0.03 ₹2,310 2.2 8.7 15.9 10.5 11 13.9 SBI Debt Hybrid Fund Growth ₹64.6266
↓ -0.03 ₹9,538 2.5 5.9 13.9 10.4 10.3 12.2 Note: Returns up to 1 year are on absolute basis & more than 1 year are on CAGR basis. as on 19 Apr 24
اعلی کارکردگی کا مظاہرہ کرنے والے ثالثی فنڈز
یہ فنڈ ثالثی کی حکمت عملی پر عمل کرے گا اور اپنے اثاثوں کا کم از کم 65 فیصد ایکویٹی سے متعلقہ آلات میں لگائے گا۔ ثالثی فنڈز میوچل فنڈز ہیں جو کیش مارکیٹ اور ڈیریویٹیو مارکیٹ کے درمیان فرق کی قیمت کا فائدہ اٹھاتے ہیں تاکہ میوچل فنڈ کی واپسی حاصل کی جا سکے۔ ثالثی فنڈز سے حاصل ہونے والے منافع کا انحصار اسٹاک مارکیٹ کے اتار چڑھاؤ پر ہوتا ہے۔ ثالثی میوچل فنڈز فطرت میں ہائبرڈ ہوتے ہیں اور زیادہ یا مستقل اتار چڑھاؤ کے وقت، یہ فنڈز سرمایہ کاروں کو نسبتاً خطرے سے پاک واپسی پیش کرتے ہیں۔
Fund NAV Net Assets (Cr) 3 MO (%) 6 MO (%) 1 YR (%) 3 YR (%) 5 YR (%) 2023 (%) Kotak Equity Arbitrage Fund Growth ₹34.5337
↑ 0.03 ₹39,099 2.2 4.1 8.1 5.8 5.4 7.4 SBI Arbitrage Opportunities Fund Growth ₹31.1876
↑ 0.03 ₹27,798 2.1 3.9 8 5.9 5.3 7.4 Edelweiss Arbitrage Fund Growth ₹17.8898
↑ 0.02 ₹8,768 2.2 4 7.9 5.7 5.4 7.1 Note: Returns up to 1 year are on absolute basis & more than 1 year are on CAGR basis. as on 19 Apr 24
اعلی کارکردگی کا مظاہرہ کرنے والے متحرک اثاثہ مختص فنڈز
یہ اسکیم متحرک طور پر ایکویٹی اور قرض کے آلات میں ان کی سرمایہ کاری کا انتظام کرے گی۔ یہ فنڈز قرض کے لیے مختص میں اضافہ کرتے ہیں اور جب مارکیٹ مہنگی ہو جاتی ہے تو ایکویٹیز کے لیے ویٹیج کو کم کرتے ہیں۔ نیز، یہ فنڈز کم خطرے میں استحکام فراہم کرنے پر توجہ مرکوز کرتے ہیں۔Fund NAV Net Assets (Cr) 3 MO (%) 6 MO (%) 1 YR (%) 3 YR (%) 5 YR (%) 2023 (%) HDFC Balanced Advantage Fund Growth ₹455.29
↑ 0.64 ₹78,759 5.4 17.8 38.4 25.1 17.9 31.3 BOI AXA Equity Debt Rebalancer Fund Growth ₹23.4195
↑ 0.08 ₹119 3.8 14.7 25.2 14.5 9.1 18.4 ICICI Prudential Balanced Advantage Fund Growth ₹64.2
↑ 0.13 ₹55,229 3.8 10.5 20.8 13.2 12.5 16.5 Note: Returns up to 1 year are on absolute basis & more than 1 year are on CAGR basis. as on 19 Apr 24
اعلی کارکردگی کا مظاہرہ کرنے والے ایکویٹی سیونگ فنڈز
یہ اسکیم ایکویٹی، ثالثی اور قرض میں سرمایہ کاری کرے گی۔ ایکویٹی بچت کل اثاثوں کا کم از کم 65 فیصد اسٹاک میں اور کم از کم 10 فیصد قرض میں لگائے گی۔ اسکیم اسکیم کی معلومات کے دستاویز میں کم از کم ہیجڈ اور غیر ہیجڈ سرمایہ کاری کو بیان کرے گی۔Fund NAV Net Assets (Cr) 3 MO (%) 6 MO (%) 1 YR (%) 3 YR (%) 5 YR (%) 2023 (%) Principal Equity Savings Fund Growth ₹62.4345
↑ 0.13 ₹742 3.7 8.5 20.1 12.6 11.6 15.3 L&T Equity Savings Fund Growth ₹29.3645
↑ 0.07 ₹225 6.4 11 22.8 12.4 10.4 17 HDFC Equity Savings Fund Growth ₹60.008
↑ 0.08 ₹3,900 3.3 9.4 18.1 12 10.2 13.8 Note: Returns up to 1 year are on absolute basis & more than 1 year are on CAGR basis. as on 19 Apr 24
ٹاپ پرفارمنگ ملٹی ایسٹ ایلوکیشن فنڈز
یہ اسکیم تین اثاثہ کلاسوں میں سرمایہ کاری کر سکتی ہے، جس کا مطلب ہے کہ وہ ایکویٹی اور قرض کے علاوہ ایک اضافی اثاثہ کلاس میں سرمایہ کاری کر سکتے ہیں۔ فنڈ کو ہر اثاثہ کلاس میں کم از کم 10 فیصد سرمایہ کاری کرنی چاہیے۔ غیر ملکی سیکیورٹیز کو علیحدہ اثاثہ کلاس نہیں سمجھا جائے گا۔ (Erstwhile ICICI Prudential Balanced Fund) To generate long term capital appreciation and current income from a portfolio
that is invested in equity and equity related securities as well as in fixed income
securities. ICICI Prudential Equity and Debt Fund is a Hybrid - Hybrid Equity fund was launched on 3 Nov 99. It is a fund with Moderately High risk and has given a Below is the key information for ICICI Prudential Equity and Debt Fund Returns up to 1 year are on (Erstwhile HDFC Growth Fund and HDFC Prudence Fund) Aims to generate long term capital appreciation from a portfolio that is invested predominantly in equity and equity related instruments. HDFC Balanced Advantage Fund is a Hybrid - Dynamic Allocation fund was launched on 11 Sep 00. It is a fund with Moderately High risk and has given a Below is the key information for HDFC Balanced Advantage Fund Returns up to 1 year are on (Erstwhile BOI AXA Mid Cap Equity And Debt Fund) The scheme's objective is to provide capital appreciation and income distribution to investors from a portfolio constituting of mid cap equity and equity related securities as well as fixed income securities.However there can be no assurance that the investment objectives of the Scheme will be realized BOI AXA Mid and Small Cap Equity and Debt Fund is a Hybrid - Hybrid Equity fund was launched on 20 Jul 16. It is a fund with Moderately High risk and has given a Below is the key information for BOI AXA Mid and Small Cap Equity and Debt Fund Returns up to 1 year are on (Erstwhile ICICI Prudential Dynamic Plan) To generate capital appreciation by actively investing in equity and equity related securities. For defensive considerations, the Scheme may invest in debt, money market instruments and derivatives. The investment manager will have the discretion to take aggressive asset calls i.e. by staying 100% invested in equity market/equity related instruments at a given point of time and 0% at another, in which case, the fund may be invested in debt related instruments at its discretion. The AMC may choose to churn the portfolio of the Scheme in order to achieve the investment objective. The Scheme is suitable for investors seeking high returns and for those who are willing to take commensurate risks. ICICI Prudential Multi-Asset Fund is a Hybrid - Multi Asset fund was launched on 31 Oct 02. It is a fund with Moderately High risk and has given a Below is the key information for ICICI Prudential Multi-Asset Fund Returns up to 1 year are on (Erstwhile JM Balanced Fund) To provide steady current income as well as long term growth of capital. JM Equity Hybrid Fund is a Hybrid - Hybrid Equity fund was launched on 1 Apr 95. It is a fund with Moderately High risk and has given a Below is the key information for JM Equity Hybrid Fund Returns up to 1 year are on (Erstwhile Edelweiss Prudent Advantage Fund) The objective of the Scheme is to generate returns through capital appreciation by investing in diversified portfolio of equity and equity-related securities, fixed income instruments and Gold Exchange Traded Funds.
However, there is no assurance that the investment objective of the Scheme will be realized. Edelweiss Multi Asset Allocation Fund is a Hybrid - Multi Asset fund was launched on 12 Aug 09. It is a fund with Moderately High risk and has given a Below is the key information for Edelweiss Multi Asset Allocation Fund Returns up to 1 year are on (Erstwhile UTI Balanced Fund) The scheme aims to invest in a portfolio of equity/equity related securities and fixed income securities (debt and money market securities) with a view to generating regular income together with capital appreciation. UTI Hybrid Equity Fund is a Hybrid - Hybrid Equity fund was launched on 2 Jan 95. It is a fund with Moderately High risk and has given a Below is the key information for UTI Hybrid Equity Fund Returns up to 1 year are on (Erstwhile UTI Wealth Builder Fund) The objective of the Scheme is to achieve long term capital appreciation by investing predominantly in a diversified portfolio of equity and equity related instruments along with investments in Gold ETFs and Debt and Money Market Instruments. However, there can be no assurance that the investment objective of the Scheme will be achieved. UTI Multi Asset Fund is a Hybrid - Multi Asset fund was launched on 21 Oct 08. It is a fund with Moderately High risk and has given a Below is the key information for UTI Multi Asset Fund Returns up to 1 year are on (Erstwhile Reliance Regular Savings Fund - Balanced Plan) The primary investment objective of this option is to generate consistent returns and appreciation of capital by investing in mix of securities comprising of Equity, Equity related instruments & fixed income instruments. Nippon India Equity Hybrid Fund is a Hybrid - Hybrid Equity fund was launched on 8 Jun 05. It is a fund with Moderately High risk and has given a Below is the key information for Nippon India Equity Hybrid Fund Returns up to 1 year are on (Erstwhile BNP Paribas Balanced Fund) The Scheme seeks to generate income and capital appreciation by investing in a diversified portfolio of equity and equity related instruments and fixed income instruments. However, there can be no assurance that the investment objectives of the Scheme will be realized. The Scheme does not guarantee/indicate any returns BNP Paribas Substantial Equity Hybrid Fund is a Hybrid - Hybrid Equity fund was launched on 7 Apr 17. It is a fund with Moderately High risk and has given a Below is the key information for BNP Paribas Substantial Equity Hybrid Fund Returns up to 1 year are on (Erstwhile Franklin India Balanced Fund) The fund aims to provide long term capital appreciation and current income by investing in equity and equity related securities and high quality fixed income instruments. Franklin India Equity Hybrid Fund is a Hybrid - Hybrid Equity fund was launched on 10 Dec 99. It is a fund with Moderately High risk and has given a Below is the key information for Franklin India Equity Hybrid Fund Returns up to 1 year are on Fund NAV Net Assets (Cr) 3 MO (%) 6 MO (%) 1 YR (%) 3 YR (%) 5 YR (%) 2023 (%) ICICI Prudential Multi-Asset Fund Growth ₹645.927
↓ -1.43 ₹34,704 8.1 16.8 32.9 24.5 19.3 24.1 Edelweiss Multi Asset Allocation Fund Growth ₹53.99
↑ 0.07 ₹1,353 5 15.1 32.2 19.1 16.2 25.4 UTI Multi Asset Fund Growth ₹65.3893
↓ -0.03 ₹1,278 9.3 22.7 40.3 17.8 14.1 29.1 Note: Returns up to 1 year are on absolute basis & more than 1 year are on CAGR basis. as on 18 Apr 24 AUM > = 200 کروڑ اور ترتیب دیا گیا3 سالسی اے جی آر واپسی.1. ICICI Prudential Equity and Debt Fund
CAGR/Annualized return of 15.5% since its launch. Ranked 7 in Hybrid Equity category. Return for 2023 was 28.2% , 2022 was 11.7% and 2021 was 41.7% . ICICI Prudential Equity and Debt Fund
Growth Launch Date 3 Nov 99 NAV (19 Apr 24) ₹337.92 ↑ 1.46 (0.43 %) Net Assets (Cr) ₹32,429 on 29 Feb 24 Category Hybrid - Hybrid Equity AMC ICICI Prudential Asset Management Company Limited Rating ☆☆☆☆ Risk Moderately High Expense Ratio 1.78 Sharpe Ratio 3.33 Information Ratio 2.05 Alpha Ratio 9.77 Min Investment 5,000 Min SIP Investment 100 Exit Load 0-1 Years (1%),1 Years and above(NIL) Growth of 10,000 investment over the years.
Date Value 31 Mar 19 ₹10,000 31 Mar 20 ₹7,882 31 Mar 21 ₹12,623 31 Mar 22 ₹16,807 31 Mar 23 ₹17,757 31 Mar 24 ₹25,057 Returns for ICICI Prudential Equity and Debt Fund
absolute basis & more than 1 year are on CAGR (Compound Annual Growth Rate) basis. as on 19 Apr 24 Duration Returns 1 Month 2.1% 3 Month 7.8% 6 Month 18.7% 1 Year 39% 3 Year 25.4% 5 Year 20.1% 10 Year 15 Year Since launch 15.5% Historical performance (Yearly) on absolute basis
Year Returns 2023 28.2% 2022 11.7% 2021 41.7% 2020 9% 2019 9.3% 2018 -1.9% 2017 24.8% 2016 13.7% 2015 2.1% 2014 45.6% Fund Manager information for ICICI Prudential Equity and Debt Fund
Name Since Tenure Sankaran Naren 7 Dec 15 8.32 Yr. Manish Banthia 19 Sep 13 10.54 Yr. Mittul Kalawadia 29 Dec 20 3.26 Yr. Akhil Kakkar 22 Jan 24 0.19 Yr. Sri Sharma 30 Apr 21 2.92 Yr. Sharmila D’mello 31 Jul 22 1.67 Yr. Data below for ICICI Prudential Equity and Debt Fund as on 29 Feb 24
Asset Allocation
Asset Class Value Cash 7.93% Equity 73.81% Debt 18.26% Equity Sector Allocation
Sector Value Financial Services 18.86% Consumer Cyclical 12.86% Energy 8.04% Utility 7.56% Communication Services 5.65% Health Care 5.23% Industrials 4.34% Technology 4.2% Basic Materials 2.97% Consumer Defensive 2.26% Real Estate 1.72% Debt Sector Allocation
Sector Value Government 11.6% Cash Equivalent 7.53% Corporate 7.06% Credit Quality
Rating Value A 3.72% AA 26.54% AAA 67.99% Top Securities Holdings / Portfolio
Name Holding Value Quantity NTPC Ltd (Utilities)
Equity, Since 28 Feb 17 | 5325557% ₹2,362 Cr 70,386,803
↓ -6,546,000 ICICI Bank Ltd (Financial Services)
Equity, Since 31 Jul 12 | ICICIBANK7% ₹2,314 Cr 21,991,832 Bharti Airtel Ltd (Communication Services)
Equity, Since 31 May 16 | BHARTIARTL5% ₹1,640 Cr 14,595,380 Maruti Suzuki India Ltd (Consumer Cyclical)
Equity, Since 31 Jul 21 | MARUTI4% ₹1,445 Cr 1,280,135 Reliance Industries Ltd (Energy)
Equity, Since 30 Jun 22 | RELIANCE4% ₹1,303 Cr 4,459,343 HDFC Bank Ltd (Financial Services)
Equity, Since 30 Apr 21 | HDFCBANK4% ₹1,279 Cr 9,116,385
↑ 1,794,215 Sun Pharmaceuticals Industries Ltd (Healthcare)
Equity, Since 31 May 16 | SUNPHARMA4% ₹1,236 Cr 7,835,635
↓ -137,861 7.18% Govt Stock 2033
Sovereign Bonds | -4% ₹1,215 Cr 120,666,240 8.25% Govt Stock 2033
Sovereign Bonds | -3% ₹1,065 Cr 105,279,550
↑ 20,000,000 Oil & Natural Gas Corp Ltd (Energy)
Equity, Since 30 Apr 17 | 5003123% ₹1,051 Cr 39,721,201
↓ -3,927,000 2. HDFC Balanced Advantage Fund
CAGR/Annualized return of 18.5% since its launch. Ranked 23 in Dynamic Allocation category. Return for 2023 was 31.3% , 2022 was 18.8% and 2021 was 26.4% . HDFC Balanced Advantage Fund
Growth Launch Date 11 Sep 00 NAV (19 Apr 24) ₹455.29 ↑ 0.64 (0.14 %) Net Assets (Cr) ₹78,759 on 29 Feb 24 Category Hybrid - Dynamic Allocation AMC HDFC Asset Management Company Limited Rating ☆☆☆☆ Risk Moderately High Expense Ratio 1.61 Sharpe Ratio 3.45 Information Ratio 0 Alpha Ratio 0 Min Investment 5,000 Min SIP Investment 300 Exit Load 0-1 Years (1%),1 Years and above(NIL) Growth of 10,000 investment over the years.
Date Value 31 Mar 19 ₹10,000 31 Mar 20 ₹7,472 31 Mar 21 ₹11,728 31 Mar 22 ₹14,196 31 Mar 23 ₹16,080 31 Mar 24 ₹22,455 Returns for HDFC Balanced Advantage Fund
absolute basis & more than 1 year are on CAGR (Compound Annual Growth Rate) basis. as on 19 Apr 24 Duration Returns 1 Month 2.5% 3 Month 5.4% 6 Month 17.8% 1 Year 38.4% 3 Year 25.1% 5 Year 17.9% 10 Year 15 Year Since launch 18.5% Historical performance (Yearly) on absolute basis
Year Returns 2023 31.3% 2022 18.8% 2021 26.4% 2020 7.6% 2019 6.9% 2018 -3.1% 2017 27.9% 2016 9.4% 2015 0.3% 2014 51.8% Fund Manager information for HDFC Balanced Advantage Fund
Name Since Tenure Anil Bamboli 29 Jul 22 1.68 Yr. Gopal Agrawal 29 Jul 22 1.68 Yr. Arun Agarwal 6 Oct 22 1.49 Yr. Srinivasan Ramamurthy 29 Jul 22 1.68 Yr. Nirman Morakhia 15 Feb 23 1.13 Yr. Dhruv Muchhal 22 Jun 23 0.78 Yr. Data below for HDFC Balanced Advantage Fund as on 29 Feb 24
Asset Allocation
Asset Class Value Cash 15.85% Equity 58.48% Debt 25.67% Equity Sector Allocation
Sector Value Financial Services 23.42% Industrials 10.46% Energy 8.97% Utility 6.3% Technology 4.01% Consumer Cyclical 4% Health Care 3.78% Consumer Defensive 2.34% Basic Materials 1.82% Communication Services 1.69% Real Estate 1.43% Debt Sector Allocation
Sector Value Government 17.95% Cash Equivalent 15.28% Corporate 8.29% Credit Quality
Rating Value AA 1.29% AAA 97.06% Top Securities Holdings / Portfolio
Name Holding Value Quantity HDFC Bank Ltd (Financial Services)
Equity, Since 31 Mar 22 | HDFCBANK6% ₹4,463 Cr 31,804,751 Coal India Ltd (Energy)
Equity, Since 31 Jan 18 | COALINDIA4% ₹3,218 Cr 73,700,000
↓ -2,000,000 State Bank of India (Financial Services)
Equity, Since 31 May 07 | SBIN4% ₹3,024 Cr 40,426,000
↓ -666,271 7.38% Govt Stock 2027
Sovereign Bonds | -3% ₹2,750 Cr 272,581,800 NTPC Ltd (Utilities)
Equity, Since 31 Aug 16 | 5325553% ₹2,691 Cr 80,175,943
↓ -3,598,464 ICICI Bank Ltd (Financial Services)
Equity, Since 31 Oct 09 | ICICIBANK3% ₹2,690 Cr 25,564,524 Infosys Ltd (Technology)
Equity, Since 31 Oct 09 | INFY3% ₹2,003 Cr 11,967,098 Reliance Industries Ltd (Energy)
Equity, Since 31 Dec 21 | RELIANCE2% ₹1,949 Cr 6,672,683 Larsen & Toubro Ltd (Industrials)
Equity, Since 30 Jun 12 | LT2% ₹1,932 Cr 5,556,183 Power Finance Corp Ltd (Financial Services)
Equity, Since 30 Apr 17 | 5328102% ₹1,752 Cr 43,712,162 3. BOI AXA Mid and Small Cap Equity and Debt Fund
CAGR/Annualized return of 16.9% since its launch. Return for 2023 was 33.7% , 2022 was -4.8% and 2021 was 54.5% . BOI AXA Mid and Small Cap Equity and Debt Fund
Growth Launch Date 20 Jul 16 NAV (19 Apr 24) ₹33.52 ↓ -0.01 (-0.03 %) Net Assets (Cr) ₹657 on 29 Feb 24 Category Hybrid - Hybrid Equity AMC BOI AXA Investment Mngrs Private Ltd Rating Risk Moderately High Expense Ratio 2.58 Sharpe Ratio 3.13 Information Ratio 0 Alpha Ratio 0 Min Investment 5,000 Min SIP Investment 1,000 Exit Load 0-1 Years (1%),1 Years and above(NIL) Growth of 10,000 investment over the years.
Date Value 31 Mar 19 ₹10,000 31 Mar 20 ₹7,855 31 Mar 21 ₹13,318 31 Mar 22 ₹17,901 31 Mar 23 ₹17,253 31 Mar 24 ₹25,193 Returns for BOI AXA Mid and Small Cap Equity and Debt Fund
absolute basis & more than 1 year are on CAGR (Compound Annual Growth Rate) basis. as on 19 Apr 24 Duration Returns 1 Month 6.2% 3 Month 5.3% 6 Month 19.3% 1 Year 45.9% 3 Year 24.6% 5 Year 20.9% 10 Year 15 Year Since launch 16.9% Historical performance (Yearly) on absolute basis
Year Returns 2023 33.7% 2022 -4.8% 2021 54.5% 2020 31.1% 2019 -4.7% 2018 -14.2% 2017 47.1% 2016 2015 2014 Fund Manager information for BOI AXA Mid and Small Cap Equity and Debt Fund
Name Since Tenure Alok Singh 16 Feb 17 7.13 Yr. Data below for BOI AXA Mid and Small Cap Equity and Debt Fund as on 29 Feb 24
Asset Allocation
Asset Class Value Cash 16.76% Equity 71.24% Debt 12% Equity Sector Allocation
Sector Value Basic Materials 13.98% Financial Services 13.14% Consumer Cyclical 11.06% Health Care 9.2% Industrials 6.99% Energy 5.34% Technology 3.82% Consumer Defensive 3.21% Communication Services 2.41% Utility 2.09% Debt Sector Allocation
Sector Value Government 12.45% Corporate 10.42% Cash Equivalent 5.88% Credit Quality
Rating Value AAA 100% Top Securities Holdings / Portfolio
Name Holding Value Quantity Oil India Ltd (Energy)
Equity, Since 31 Mar 23 | OIL3% ₹22 Cr 406,000 Jindal Stainless Ltd (Basic Materials)
Equity, Since 30 Sep 21 | JSL3% ₹20 Cr 305,000
↓ -55,000 Indus Towers Ltd Ordinary Shares (Communication Services)
Equity, Since 31 Jan 24 | 5348162% ₹16 Cr 625,000 Power Grid Corporation Of India Limited
Debentures | -2% ₹15 Cr 150,000,000 UNO Minda Ltd (Consumer Cyclical)
Equity, Since 31 Jul 19 | UNOMINDA2% ₹15 Cr 220,000
↓ -40,000 JK Cement Ltd (Basic Materials)
Equity, Since 31 Aug 22 | JKCEMENT2% ₹14 Cr 31,900 CRISIL Ltd (Financial Services)
Equity, Since 29 Feb 24 | CRISIL2% ₹14 Cr 27,000
↑ 27,000 7.26% Govt Stock 2033
Sovereign Bonds | -2% ₹13 Cr 1,300,000 Astral Ltd (Industrials)
Equity, Since 30 Jun 17 | ASTRAL2% ₹13 Cr 63,000
↓ -9,000 Kotak Mahindra Bank Ltd.
Debentures | -2% ₹13 Cr 1,350,000 4. ICICI Prudential Multi-Asset Fund
CAGR/Annualized return of 21.4% since its launch. Ranked 53 in Multi Asset category. Return for 2023 was 24.1% , 2022 was 16.8% and 2021 was 34.7% . ICICI Prudential Multi-Asset Fund
Growth Launch Date 31 Oct 02 NAV (18 Apr 24) ₹645.927 ↓ -1.43 (-0.22 %) Net Assets (Cr) ₹34,704 on 29 Feb 24 Category Hybrid - Multi Asset AMC ICICI Prudential Asset Management Company Limited Rating ☆☆ Risk Moderately High Expense Ratio 1.83 Sharpe Ratio 3.32 Information Ratio 0 Alpha Ratio 0 Min Investment 5,000 Min SIP Investment 100 Exit Load 0-1 Years (1%),1 Years and above(NIL) Growth of 10,000 investment over the years.
Date Value 31 Mar 19 ₹10,000 31 Mar 20 ₹7,873 31 Mar 21 ₹12,356 31 Mar 22 ₹16,198 31 Mar 23 ₹17,881 31 Mar 24 ₹23,704 Returns for ICICI Prudential Multi-Asset Fund
absolute basis & more than 1 year are on CAGR (Compound Annual Growth Rate) basis. as on 19 Apr 24 Duration Returns 1 Month 3.6% 3 Month 8.1% 6 Month 16.8% 1 Year 32.9% 3 Year 24.5% 5 Year 19.3% 10 Year 15 Year Since launch 21.4% Historical performance (Yearly) on absolute basis
Year Returns 2023 24.1% 2022 16.8% 2021 34.7% 2020 9.9% 2019 7.7% 2018 -2.2% 2017 28.2% 2016 12.5% 2015 -1.4% 2014 37% Fund Manager information for ICICI Prudential Multi-Asset Fund
Name Since Tenure Sankaran Naren 1 Feb 12 12.17 Yr. Manish Banthia 22 Jan 24 0.19 Yr. Ihab Dalwai 3 Jun 17 6.83 Yr. Akhil Kakkar 22 Jan 24 0.19 Yr. Sri Sharma 30 Apr 21 2.92 Yr. Gaurav Chikane 2 Aug 21 2.66 Yr. Sharmila D’mello 31 Jul 22 1.67 Yr. Data below for ICICI Prudential Multi-Asset Fund as on 29 Feb 24
Asset Allocation
Asset Class Value Cash 19.11% Equity 67.25% Debt 8.8% Other 4.84% Equity Sector Allocation
Sector Value Financial Services 20.87% Consumer Cyclical 7.59% Energy 7.4% Utility 5.84% Basic Materials 5.07% Health Care 4.92% Technology 4.59% Industrials 3.74% Consumer Defensive 3.22% Communication Services 2.95% Real Estate 1.06% Debt Sector Allocation
Sector Value Cash Equivalent 18.07% Government 5.63% Corporate 4.21% Credit Quality
Rating Value A 2.72% AA 9.35% AAA 85.49% Top Securities Holdings / Portfolio
Name Holding Value Quantity ICICI Bank Ltd (Financial Services)
Equity, Since 31 May 06 | ICICIBANK6% ₹1,981 Cr 18,829,681
↓ -308,700 NTPC Ltd (Utilities)
Equity, Since 31 Mar 17 | 5325555% ₹1,646 Cr 49,047,163
↓ -4,467,000 HDFC Bank Ltd (Financial Services)
Equity, Since 31 Jan 22 | HDFCBANK4% ₹1,552 Cr 11,057,759
↑ 3,218,650 Maruti Suzuki India Ltd (Consumer Cyclical)
Equity, Since 31 Aug 21 | MARUTI4% ₹1,306 Cr 1,157,159
↓ -23,500 Reliance Industries Ltd (Energy)
Equity, Since 31 Dec 20 | RELIANCE3% ₹1,118 Cr 3,827,758
↑ 450,000 ICICI Pru Gold ETF
- | -3% ₹971 Cr 179,088,851
↑ 15,175,925 SBI Cards and Payment Services Ltd Ordinary Shares (Financial Services)
Equity, Since 30 Nov 22 | SBICARD3% ₹882 Cr 12,250,556
↑ 247,558 Infosys Ltd (Technology)
Equity, Since 31 Oct 19 | INFY2% ₹819 Cr 4,891,022
↑ 216,800 Bharti Airtel Ltd (Communication Services)
Equity, Since 31 May 16 | BHARTIARTL2% ₹794 Cr 7,066,516
↑ 506,878 ICICI Lombard General Insurance Co Ltd (Financial Services)
Equity, Since 31 Oct 21 | ICICIGI2% ₹787 Cr 4,600,295
↓ -101,900 5. JM Equity Hybrid Fund
CAGR/Annualized return of 12.7% since its launch. Ranked 35 in Hybrid Equity category. Return for 2023 was 33.8% , 2022 was 8.1% and 2021 was 22.9% . JM Equity Hybrid Fund
Growth Launch Date 1 Apr 95 NAV (19 Apr 24) ₹108.136 ↑ 0.04 (0.04 %) Net Assets (Cr) ₹202 on 29 Feb 24 Category Hybrid - Hybrid Equity AMC JM Financial Asset Management Limited Rating ☆ Risk Moderately High Expense Ratio 2.46 Sharpe Ratio 3.61 Information Ratio 1.47 Alpha Ratio 20.88 Min Investment 5,000 Min SIP Investment 500 Exit Load 0-60 Days (1%),60 Days and above(NIL) Growth of 10,000 investment over the years.
Date Value 31 Mar 19 ₹10,000 31 Mar 20 ₹6,954 31 Mar 21 ₹12,368 31 Mar 22 ₹14,221 31 Mar 23 ₹15,051 31 Mar 24 ₹22,422 Returns for JM Equity Hybrid Fund
absolute basis & more than 1 year are on CAGR (Compound Annual Growth Rate) basis. as on 19 Apr 24 Duration Returns 1 Month 5.4% 3 Month 5.8% 6 Month 21% 1 Year 50.6% 3 Year 23.8% 5 Year 18.2% 10 Year 15 Year Since launch 12.7% Historical performance (Yearly) on absolute basis
Year Returns 2023 33.8% 2022 8.1% 2021 22.9% 2020 30.5% 2019 -8.1% 2018 1.7% 2017 18.5% 2016 3% 2015 -0.2% 2014 33.4% Fund Manager information for JM Equity Hybrid Fund
Name Since Tenure Asit Bhandarkar 31 Dec 21 2.25 Yr. Gurvinder Wasan 1 Dec 22 1.33 Yr. Chaitanya Choksi 20 Aug 21 2.61 Yr. Data below for JM Equity Hybrid Fund as on 29 Feb 24
Asset Allocation
Asset Class Value Cash 6.67% Equity 75.15% Debt 18.18% Equity Sector Allocation
Sector Value Consumer Cyclical 15.84% Financial Services 14.04% Industrials 12.77% Technology 10.67% Health Care 7.66% Real Estate 4.05% Basic Materials 3.64% Utility 1.98% Energy 1.76% Consumer Defensive 1.46% Communication Services 1.28% Debt Sector Allocation
Sector Value Corporate 10.51% Government 7.68% Cash Equivalent 6.67% Credit Quality
Rating Value AAA 100% Top Securities Holdings / Portfolio
Name Holding Value Quantity 7.18% Govt Stock 2037
Sovereign Bonds | -4% ₹9 Cr 900,000 Infosys Ltd (Technology)
Equity, Since 30 Nov 20 | INFY4% ₹7 Cr 44,050
↑ 12,000 ICICI Bank Ltd (Financial Services)
Equity, Since 31 Oct 21 | ICICIBANK3% ₹7 Cr 64,100
↑ 20,000 Mahindra & Mahindra Ltd (Consumer Cyclical)
Equity, Since 29 Feb 24 | M&M3% ₹6 Cr 33,000
↑ 33,000 Sobha Ltd (Real Estate)
Equity, Since 30 Sep 23 | SOBHA3% ₹6 Cr 38,239 REC Ltd (Financial Services)
Equity, Since 30 Nov 22 | 5329553% ₹6 Cr 134,000
↑ 40,000 GE T&D India Ltd (Industrials)
Equity, Since 30 Nov 23 | 5222753% ₹6 Cr 64,050
↑ 6,500 Tata Motors Ltd Class A (Consumer Cyclical)
Equity, Since 31 Jul 23 | TATAMTRDVR3% ₹6 Cr 91,000 Tata Consultancy Services Ltd (Technology)
Equity, Since 29 Feb 24 | TCS3% ₹5 Cr 13,000
↑ 13,000 Voltas Ltd (Industrials)
Equity, Since 31 Oct 23 | VOLTAS2% ₹5 Cr 45,000 6. Edelweiss Multi Asset Allocation Fund
CAGR/Annualized return of since its launch. Ranked 71 in Multi Asset category. Return for 2023 was 25.4% , 2022 was 5.3% and 2021 was 27.1% . Edelweiss Multi Asset Allocation Fund
Growth Launch Date 12 Aug 09 NAV (19 Apr 24) ₹53.99 ↑ 0.07 (0.13 %) Net Assets (Cr) ₹1,353 on 29 Feb 24 Category Hybrid - Multi Asset AMC Edelweiss Asset Management Limited Rating ☆ Risk Moderately High Expense Ratio 2.5 Sharpe Ratio 2.95 Information Ratio 1.72 Alpha Ratio 5.23 Min Investment 5,000 Min SIP Investment 500 Exit Load NIL Growth of 10,000 investment over the years.
Date Value 31 Mar 19 ₹10,000 31 Mar 20 ₹8,441 31 Mar 21 ₹12,687 31 Mar 22 ₹15,192 31 Mar 23 ₹15,920 31 Mar 24 ₹21,401 Returns for Edelweiss Multi Asset Allocation Fund
absolute basis & more than 1 year are on CAGR (Compound Annual Growth Rate) basis. as on 19 Apr 24 Duration Returns 1 Month 1.9% 3 Month 5% 6 Month 15.1% 1 Year 32.2% 3 Year 19.1% 5 Year 16.2% 10 Year 15 Year Since launch Historical performance (Yearly) on absolute basis
Year Returns 2023 25.4% 2022 5.3% 2021 27.1% 2020 12.7% 2019 10.4% 2018 -0.1% 2017 26.1% 2016 0.2% 2015 2.2% 2014 38.4% Fund Manager information for Edelweiss Multi Asset Allocation Fund
Name Since Tenure Dhawal Dalal 23 Nov 21 2.35 Yr. Bhavesh Jain 14 Oct 15 8.47 Yr. Bharat Lahoti 1 Oct 21 2.5 Yr. Data below for Edelweiss Multi Asset Allocation Fund as on 29 Feb 24
Asset Allocation
Asset Class Value Cash 4.71% Equity 75.43% Debt 19.86% Other 0% Equity Sector Allocation
Sector Value Financial Services 21.31% Consumer Cyclical 9.55% Health Care 7.5% Energy 6.64% Technology 6.62% Industrials 5.55% Consumer Defensive 4.68% Utility 3.81% Basic Materials 3.38% Communication Services 2.21% Real Estate 1.49% Debt Sector Allocation
Sector Value Government 16.58% Cash Equivalent 4.61% Corporate 3.36% Securitized 0.02% Credit Quality
Rating Value AAA 100% Top Securities Holdings / Portfolio
Name Holding Value Quantity 7.06% Govt Stock 2028
Sovereign Bonds | -11% ₹150 Cr 15,000,000 ICICI Bank Ltd (Financial Services)
Equity, Since 31 Mar 15 | ICICIBANK5% ₹66 Cr 628,995
↑ 149,709 Reliance Industries Ltd (Energy)
Equity, Since 31 Aug 20 | RELIANCE4% ₹49 Cr 166,486
↑ 43,736 HDFC Bank Ltd (Financial Services)
Equity, Since 31 Oct 15 | HDFCBANK3% ₹39 Cr 280,000
↑ 29,255 7.18% Govt Stock 2033
Sovereign Bonds | -3% ₹39 Cr 3,850,000
↑ 3,850,000 7.1% Govt Stock 2029
Sovereign Bonds | -3% ₹35 Cr 3,500,000 Larsen & Toubro Ltd (Industrials)
Equity, Since 30 Jun 16 | LT3% ₹34 Cr 98,194 ITC Ltd (Consumer Defensive)
Equity, Since 30 Sep 16 | ITC3% ₹34 Cr 839,944 State Bank of India (Financial Services)
Equity, Since 30 Jun 15 | SBIN2% ₹33 Cr 439,145
↑ 95,703 NTPC Ltd (Utilities)
Equity, Since 30 Nov 21 | 5325552% ₹32 Cr 960,772
↑ 110,158 7. UTI Hybrid Equity Fund
CAGR/Annualized return of 15.1% since its launch. Ranked 12 in Hybrid Equity category. Return for 2023 was 25.5% , 2022 was 5.6% and 2021 was 30.5% . UTI Hybrid Equity Fund
Growth Launch Date 2 Jan 95 NAV (19 Apr 24) ₹345.665 ↑ 0.88 (0.26 %) Net Assets (Cr) ₹5,243 on 29 Feb 24 Category Hybrid - Hybrid Equity AMC UTI Asset Management Company Ltd Rating ☆☆☆ Risk Moderately High Expense Ratio 1.95 Sharpe Ratio 2.73 Information Ratio 1.25 Alpha Ratio 3.63 Min Investment 1,000 Min SIP Investment 500 Exit Load 0-12 Months (1%),12 Months and above(NIL) Growth of 10,000 investment over the years.
Date Value 31 Mar 19 ₹10,000 31 Mar 20 ₹7,508 31 Mar 21 ₹12,119 31 Mar 22 ₹14,529 31 Mar 23 ₹15,145 31 Mar 24 ₹20,211 Returns for UTI Hybrid Equity Fund
absolute basis & more than 1 year are on CAGR (Compound Annual Growth Rate) basis. as on 19 Apr 24 Duration Returns 1 Month 2% 3 Month 4.1% 6 Month 13.7% 1 Year 31.4% 3 Year 18.7% 5 Year 15.2% 10 Year 15 Year Since launch 15.1% Historical performance (Yearly) on absolute basis
Year Returns 2023 25.5% 2022 5.6% 2021 30.5% 2020 13.2% 2019 2.5% 2018 -5.6% 2017 25.7% 2016 8.8% 2015 2.4% 2014 32.8% Fund Manager information for UTI Hybrid Equity Fund
Name Since Tenure V Srivatsa 24 Sep 09 14.53 Yr. Sunil Patil 5 Feb 18 6.16 Yr. Data below for UTI Hybrid Equity Fund as on 29 Feb 24
Asset Allocation
Asset Class Value Cash 3.58% Equity 70.29% Debt 26.14% Equity Sector Allocation
Sector Value Financial Services 23.13% Consumer Cyclical 10.48% Technology 7.08% Industrials 6.19% Health Care 6.16% Energy 5.07% Basic Materials 3.74% Consumer Defensive 3.28% Communication Services 2.18% Utility 1.98% Real Estate 1% Debt Sector Allocation
Sector Value Government 17.82% Corporate 8.32% Cash Equivalent 3.58% Credit Quality
Rating Value AA 10.02% AAA 89.98% Top Securities Holdings / Portfolio
Name Holding Value Quantity HDFC Bank Ltd (Financial Services)
Equity, Since 29 Feb 20 | HDFCBANK7% ₹350 Cr 2,495,825
↑ 105,971 ICICI Bank Ltd (Financial Services)
Equity, Since 31 Mar 10 | ICICIBANK6% ₹302 Cr 2,867,404
↑ 85,278 7.18% Govt Stock 2037
Sovereign Bonds | -5% ₹276 Cr 2,750,000,000
↑ 250,000,000 7.26% Govt Stock 2033
Sovereign Bonds | -5% ₹253 Cr 2,500,000,000 Reliance Industries Ltd (Energy)
Equity, Since 31 Dec 19 | RELIANCE4% ₹225 Cr 770,258
↓ -131,541 Infosys Ltd (Technology)
Equity, Since 31 Mar 06 | INFY4% ₹211 Cr 1,260,664
↓ -127,428 Larsen & Toubro Ltd (Industrials)
Equity, Since 31 Mar 12 | LT3% ₹165 Cr 473,882
↓ -32,267 Mahindra & Mahindra Ltd (Consumer Cyclical)
Equity, Since 31 Mar 21 | M&M3% ₹145 Cr 748,614 ITC Ltd (Consumer Defensive)
Equity, Since 31 Aug 06 | ITC3% ₹132 Cr 3,254,420 7.41% Govt Stock 2036
Sovereign Bonds | -2% ₹128 Cr 1,250,000,000 8. UTI Multi Asset Fund
CAGR/Annualized return of 12.9% since its launch. Ranked 34 in Multi Asset category. Return for 2023 was 29.1% , 2022 was 4.4% and 2021 was 11.8% . UTI Multi Asset Fund
Growth Launch Date 21 Oct 08 NAV (19 Apr 24) ₹65.3893 ↓ -0.03 (-0.04 %) Net Assets (Cr) ₹1,278 on 29 Feb 24 Category Hybrid - Multi Asset AMC UTI Asset Management Company Ltd Rating ☆ Risk Moderately High Expense Ratio 1.61 Sharpe Ratio 3.81 Information Ratio 0 Alpha Ratio 0 Min Investment 5,000 Min SIP Investment 500 Exit Load 0-12 Months (1%),12 Months and above(NIL) Growth of 10,000 investment over the years.
Date Value 31 Mar 19 ₹10,000 31 Mar 20 ₹8,630 31 Mar 21 ₹11,823 31 Mar 22 ₹13,004 31 Mar 23 ₹13,630 31 Mar 24 ₹19,045 Returns for UTI Multi Asset Fund
absolute basis & more than 1 year are on CAGR (Compound Annual Growth Rate) basis. as on 19 Apr 24 Duration Returns 1 Month 3.7% 3 Month 9.3% 6 Month 22.7% 1 Year 40.3% 3 Year 17.8% 5 Year 14.1% 10 Year 15 Year Since launch 12.9% Historical performance (Yearly) on absolute basis
Year Returns 2023 29.1% 2022 4.4% 2021 11.8% 2020 13.1% 2019 3.9% 2018 -0.5% 2017 17.1% 2016 7.3% 2015 -3.7% 2014 22.7% Fund Manager information for UTI Multi Asset Fund
Name Since Tenure Sunil Patil 1 Sep 21 2.58 Yr. Sharwan Kumar Goyal 12 Nov 21 2.38 Yr. Data below for UTI Multi Asset Fund as on 29 Feb 24
Asset Allocation
Asset Class Value Cash 11.61% Equity 56.39% Debt 10.67% Other 21.33% Equity Sector Allocation
Sector Value Financial Services 14.43% Consumer Cyclical 14.09% Industrials 10.54% Consumer Defensive 6.53% Health Care 6.24% Energy 4.28% Technology 3.99% Utility 3.09% Real Estate 1.75% Basic Materials 1.23% Debt Sector Allocation
Sector Value Cash Equivalent 11.61% Government 9.89% Corporate 0.78% Credit Quality
Rating Value AAA 100% Top Securities Holdings / Portfolio
Name Holding Value Quantity UTI Gold ETF
- | -21% ₹275 Cr 51,807,715
↑ 10,012,999 7.41% Govt Stock 2036
Sovereign Bonds | -4% ₹51 Cr 500,000,000 Larsen & Toubro Ltd (Industrials)
Equity, Since 30 Apr 23 | LT4% ₹47 Cr 135,740
↑ 5,000 Axis Bank Ltd (Financial Services)
Equity, Since 30 Apr 23 | 5322153% ₹36 Cr 332,408
↑ 4,000 ITC Ltd (Consumer Defensive)
Equity, Since 31 Oct 22 | ITC3% ₹33 Cr 824,415
↑ 10,000 ICICI Bank Ltd (Financial Services)
Equity, Since 29 Feb 24 | ICICIBANK2% ₹31 Cr 299,132
↑ 299,132 7.18% Govt Stock 2037
Sovereign Bonds | -2% ₹30 Cr 300,000,000
↓ -200,000,000 NTPC Ltd (Utilities)
Equity, Since 31 Oct 22 | 5325552% ₹28 Cr 841,623
↓ -452,074 Tata Motors Ltd (Consumer Cyclical)
Equity, Since 31 Jul 23 | TATAMOTORS2% ₹26 Cr 271,486
↓ -146,841 Trent Ltd (Consumer Cyclical)
Equity, Since 31 Oct 23 | 5002512% ₹25 Cr 63,408 9. Nippon India Equity Hybrid Fund
CAGR/Annualized return of 12.4% since its launch. Ranked 8 in Hybrid Equity category. Return for 2023 was 24.1% , 2022 was 6.6% and 2021 was 27.8% . Nippon India Equity Hybrid Fund
Growth Launch Date 8 Jun 05 NAV (19 Apr 24) ₹91.0513 ↑ 0.18 (0.20 %) Net Assets (Cr) ₹3,399 on 29 Feb 24 Category Hybrid - Hybrid Equity AMC Nippon Life Asset Management Ltd. Rating ☆☆☆☆ Risk Moderately High Expense Ratio 2.06 Sharpe Ratio 3 Information Ratio 1.25 Alpha Ratio 4.97 Min Investment 500 Min SIP Investment 100 Exit Load 0-12 Months (1%),12 Months and above(NIL) Growth of 10,000 investment over the years.
Date Value 31 Mar 19 ₹10,000 31 Mar 20 ₹6,418 31 Mar 21 ₹10,243 31 Mar 22 ₹12,041 31 Mar 23 ₹12,577 31 Mar 24 ₹16,526 Returns for Nippon India Equity Hybrid Fund
absolute basis & more than 1 year are on CAGR (Compound Annual Growth Rate) basis. as on 19 Apr 24 Duration Returns 1 Month 1.7% 3 Month 4.2% 6 Month 13.1% 1 Year 29.4% 3 Year 17.1% 5 Year 10.5% 10 Year 15 Year Since launch 12.4% Historical performance (Yearly) on absolute basis
Year Returns 2023 24.1% 2022 6.6% 2021 27.8% 2020 -5.3% 2019 3% 2018 -4.9% 2017 29.5% 2016 4.2% 2015 8.7% 2014 43.2% Fund Manager information for Nippon India Equity Hybrid Fund
Name Since Tenure Meenakshi Dawar 10 Sep 21 2.56 Yr. Kinjal Desai 25 May 18 5.85 Yr. Sushil Budhia 1 Feb 20 4.16 Yr. Akshay Sharma 1 Dec 22 1.33 Yr. Data below for Nippon India Equity Hybrid Fund as on 29 Feb 24
Asset Allocation
Asset Class Value Cash 2.45% Equity 73.4% Debt 23.7% Other 0.44% Equity Sector Allocation
Sector Value Financial Services 22.4% Industrials 8.98% Consumer Cyclical 8.13% Health Care 7.6% Technology 6.63% Energy 5.63% Utility 3.83% Consumer Defensive 3.8% Basic Materials 2.88% Communication Services 2.57% Real Estate 0.95% Debt Sector Allocation
Sector Value Corporate 18.18% Government 5.52% Cash Equivalent 2.45% Credit Quality
Rating Value A 2.49% AA 41.39% AAA 56.12% Top Securities Holdings / Portfolio
Name Holding Value Quantity HDFC Bank Ltd (Financial Services)
Equity, Since 31 Jul 10 | HDFCBANK5% ₹166 Cr 1,182,356 ICICI Bank Ltd (Financial Services)
Equity, Since 30 Apr 12 | ICICIBANK5% ₹165 Cr 1,570,000 Reliance Industries Ltd (Energy)
Equity, Since 31 Jul 14 | RELIANCE4% ₹147 Cr 503,000
↓ -45,000 Larsen & Toubro Ltd (Industrials)
Equity, Since 28 Feb 13 | LT4% ₹123 Cr 354,838
↓ -56,000 Infosys Ltd (Technology)
Equity, Since 28 Feb 11 | INFY4% ₹122 Cr 730,000
↓ -150,000 Sun Pharmaceuticals Industries Ltd (Healthcare)
Equity, Since 31 Oct 11 | SUNPHARMA3% ₹110 Cr 700,000
↓ -50,000 Axis Bank Ltd (Financial Services)
Equity, Since 30 Sep 18 | 5322153% ₹100 Cr 933,200 NTPC Ltd (Utilities)
Equity, Since 31 Aug 20 | 5325553% ₹99 Cr 2,950,620 State Bank of India (Financial Services)
Equity, Since 31 Jul 16 | SBIN2% ₹82 Cr 1,100,000 Bharti Airtel Ltd (Communication Services)
Equity, Since 31 Dec 19 | BHARTIARTL2% ₹77 Cr 685,000 10. BNP Paribas Substantial Equity Hybrid Fund
CAGR/Annualized return of 13.8% since its launch. Return for 2023 was 21% , 2022 was 4.3% and 2021 was 22.2% . BNP Paribas Substantial Equity Hybrid Fund
Growth Launch Date 7 Apr 17 NAV (19 Apr 24) ₹24.8424 ↑ 0.05 (0.20 %) Net Assets (Cr) ₹969 on 29 Feb 24 Category Hybrid - Hybrid Equity AMC BNP Paribas Asset Mgmt India Pvt. Ltd Rating Risk Moderately High Expense Ratio 2.29 Sharpe Ratio 3.16 Information Ratio 0.33 Alpha Ratio 6.1 Min Investment 5,000 Min SIP Investment 300 Exit Load 0-1 Years (1%),1 Years and above(NIL) Growth of 10,000 investment over the years.
Date Value 31 Mar 19 ₹10,000 31 Mar 20 ₹9,342 31 Mar 21 ₹13,443 31 Mar 22 ₹15,734 31 Mar 23 ₹15,880 31 Mar 24 ₹21,206 Returns for BNP Paribas Substantial Equity Hybrid Fund
absolute basis & more than 1 year are on CAGR (Compound Annual Growth Rate) basis. as on 19 Apr 24 Duration Returns 1 Month 2.1% 3 Month 7% 6 Month 16.4% 1 Year 32.1% 3 Year 16.5% 5 Year 16.2% 10 Year 15 Year Since launch 13.8% Historical performance (Yearly) on absolute basis
Year Returns 2023 21% 2022 4.3% 2021 22.2% 2020 14.9% 2019 16.3% 2018 0.4% 2017 2016 2015 2014 Fund Manager information for BNP Paribas Substantial Equity Hybrid Fund
Name Since Tenure Jitendra Sriram 16 Jun 22 1.79 Yr. Mayank Prakash 7 Apr 17 6.99 Yr. Pratish Krishnan 14 Mar 22 2.05 Yr. Miten Vora 1 Dec 22 1.33 Yr. Data below for BNP Paribas Substantial Equity Hybrid Fund as on 29 Feb 24
Asset Allocation
Asset Class Value Cash 0.6% Equity 77.13% Debt 22.28% Equity Sector Allocation
Sector Value Financial Services 19.22% Consumer Cyclical 13.69% Industrials 11.65% Technology 9.71% Energy 9.15% Consumer Defensive 3.55% Basic Materials 2.56% Health Care 2.08% Communication Services 1.46% Utility 1.14% Debt Sector Allocation
Sector Value Corporate 11.71% Government 10.05% Cash Equivalent 0.6% Securitized 0.52% Credit Quality
Rating Value AA 24.26% AAA 73.66% Top Securities Holdings / Portfolio
Name Holding Value Quantity Reliance Industries Ltd (Energy)
Equity, Since 31 May 21 | RELIANCE6% ₹60 Cr 207,000 HDFC Bank Ltd (Financial Services)
Equity, Since 30 Apr 17 | HDFCBANK6% ₹54 Cr 387,000 ICICI Bank Ltd (Financial Services)
Equity, Since 30 Apr 17 | ICICIBANK5% ₹53 Cr 504,000 Larsen & Toubro Ltd (Industrials)
Equity, Since 31 May 21 | LT5% ₹50 Cr 144,000 Tata Consultancy Services Ltd (Technology)
Equity, Since 31 Mar 20 | TCS4% ₹37 Cr 90,000
↓ -6,639 ITC Ltd (Consumer Defensive)
Equity, Since 30 Sep 21 | ITC3% ₹29 Cr 702,000 Stock Futures Total
Derivatives, Since 29 Feb 24 | -3% ₹28 Cr Tata Motors Ltd (Consumer Cyclical)
Equity, Since 30 Sep 23 | TATAMOTORS3% ₹26 Cr 270,000
↓ -45,000 Infosys Ltd (Technology)
Equity, Since 30 Apr 17 | INFY2% ₹24 Cr 144,000 Bosch Ltd (Consumer Cyclical)
Equity, Since 31 Jul 22 | 5005302% ₹21 Cr 7,200 11. Franklin India Equity Hybrid Fund
CAGR/Annualized return of 13.9% since its launch. Ranked 16 in Hybrid Equity category. Return for 2023 was 22.5% , 2022 was 4.7% and 2021 was 23.8% . Franklin India Equity Hybrid Fund
Growth Launch Date 10 Dec 99 NAV (19 Apr 24) ₹236.456 ↑ 0.48 (0.21 %) Net Assets (Cr) ₹1,701 on 29 Feb 24 Category Hybrid - Hybrid Equity AMC Franklin Templeton Asst Mgmt(IND)Pvt Ltd Rating ☆☆☆ Risk Moderately High Expense Ratio 2.22 Sharpe Ratio 2.84 Information Ratio 0.5 Alpha Ratio 4.78 Min Investment 5,000 Min SIP Investment 500 Exit Load 0-1 Years (1%),1 Years and above(NIL) Growth of 10,000 investment over the years.
Date Value 31 Mar 19 ₹10,000 31 Mar 20 ₹8,083 31 Mar 21 ₹12,586 31 Mar 22 ₹14,279 31 Mar 23 ₹14,841 31 Mar 24 ₹19,464 Returns for Franklin India Equity Hybrid Fund
absolute basis & more than 1 year are on CAGR (Compound Annual Growth Rate) basis. as on 19 Apr 24 Duration Returns 1 Month 1.8% 3 Month 4.8% 6 Month 14.3% 1 Year 31% 3 Year 16.1% 5 Year 14.3% 10 Year 15 Year Since launch 13.9% Historical performance (Yearly) on absolute basis
Year Returns 2023 22.5% 2022 4.7% 2021 23.8% 2020 13.7% 2019 7.9% 2018 -1.6% 2017 21% 2016 7.6% 2015 4.8% 2014 47% Fund Manager information for Franklin India Equity Hybrid Fund
Name Since Tenure Anuj Tagra 7 Mar 24 0.07 Yr. Chandni Gupta 7 Mar 24 0.07 Yr. Varun Sharma 1 Sep 23 0.58 Yr. Sandeep Manam 18 Oct 21 2.45 Yr. Rajasa Kakulavarapu 6 Sep 21 2.57 Yr. Data below for Franklin India Equity Hybrid Fund as on 29 Feb 24
Asset Allocation
Asset Class Value Cash 11.64% Equity 69.48% Debt 18.87% Equity Sector Allocation
Sector Value Financial Services 18.44% Industrials 11.44% Consumer Cyclical 10.67% Technology 7.09% Health Care 4.98% Utility 4.31% Energy 3.49% Basic Materials 3.18% Consumer Defensive 3.13% Communication Services 2.74% Debt Sector Allocation
Sector Value Government 15.66% Corporate 7.61% Cash Equivalent 7.25% Credit Quality
Rating Value AAA 100% Top Securities Holdings / Portfolio
Name Holding Value Quantity ICICI Bank Ltd (Financial Services)
Equity, Since 31 Oct 18 | ICICIBANK5% ₹88 Cr 839,000 HDFC Bank Ltd (Financial Services)
Equity, Since 31 Mar 07 | HDFCBANK4% ₹71 Cr 506,400 Larsen & Toubro Ltd (Industrials)
Equity, Since 31 Dec 19 | LT4% ₹67 Cr 191,263 5.63% Govt Stock 2026
Sovereign Bonds | -4% ₹65 Cr 6,500,000 Infosys Ltd (Technology)
Equity, Since 29 Feb 12 | INFY4% ₹60 Cr 356,567 5.74% Govt Stock 2026
Sovereign Bonds | -3% ₹49 Cr 5,000,000 Tata Motors Ltd (Consumer Cyclical)
Equity, Since 30 Sep 14 | TATAMOTORS3% ₹47 Cr 492,000 HCL Technologies Ltd (Technology)
Equity, Since 30 Nov 21 | HCLTECH3% ₹45 Cr 269,300 Axis Bank Ltd (Financial Services)
Equity, Since 30 Jun 14 | 5322153% ₹43 Cr 403,000 Sun Pharmaceuticals Industries Ltd (Healthcare)
Equity, Since 30 Sep 22 | SUNPHARMA2% ₹42 Cr 265,500
متوازن میوچل فنڈز میں آن لائن سرمایہ کاری کیسے کی جائے؟
Fincash.com پر لائف ٹائم کے لیے مفت انویسٹمنٹ اکاؤنٹ کھولیں۔
اپنی رجسٹریشن اور KYC کا عمل مکمل کریں۔
دستاویزات اپ لوڈ کریں (PAN، آدھار، وغیرہ)۔اور، آپ سرمایہ کاری کے لیے تیار ہیں!
یہاں فراہم کردہ معلومات کے درست ہونے کو یقینی بنانے کے لیے تمام کوششیں کی گئی ہیں۔ تاہم، ڈیٹا کی درستگی کے حوالے سے کوئی ضمانت نہیں دی جاتی ہے۔ براہ کرم کوئی بھی سرمایہ کاری کرنے سے پہلے اسکیم کی معلومات کے دستاویز کے ساتھ تصدیق کریں۔


AMFI Registration No. 112358 | CIN: U74999MH2016PTC282153
Shepard Technologies Pvt. Ltd. (with ARN code 112358) makes no warranties or representations, express or implied, on products offered through the platform. It accepts no liability for any damages or losses, however caused, in connection with the use of, or on the reliance of its product or related services. Terms and conditions of the website are applicable.
©2024 Shepard Technologies Private Limited. All Rights Reserved