IndusInd ಬ್ಯಾಂಕ್ನಲ್ಲಿ SIP ವಹಿವಾಟುಗಳಿಗಾಗಿ ಬಿಲ್ಲರ್ ಅನ್ನು ಹೇಗೆ ಸೇರಿಸುವುದು?
SIP ಅಥವಾ ವ್ಯವಸ್ಥಿತಹೂಡಿಕೆ ಯೋಜನೆ ಹೂಡಿಕೆಯ ವಿಧಾನವಾಗಿದೆಮ್ಯೂಚುಯಲ್ ಫಂಡ್ ಇದರ ಮೂಲಕ ವ್ಯಕ್ತಿಗಳು ನಿಯಮಿತ ಮಧ್ಯಂತರದಲ್ಲಿ ಸಣ್ಣ ಮೊತ್ತವನ್ನು ಠೇವಣಿ ಮಾಡುತ್ತಾರೆ. ಇಲ್ಲಿ ವ್ಯಕ್ತಿಗಳು ಅರ್ಥಮಾಡಿಕೊಳ್ಳಬೇಕಾದ ಪ್ರಮುಖ ಅಂಶವೆಂದರೆ, ನಿಯಮಿತ ಮಧ್ಯಂತರಗಳಲ್ಲಿ ಮೊತ್ತವನ್ನು ಕಡಿತಗೊಳಿಸಲಾಗುತ್ತದೆ. ಪರಿಣಾಮವಾಗಿ, ಸಂಪೂರ್ಣ ಎಂದು ಖಚಿತಪಡಿಸಿಕೊಳ್ಳಲುSIP ಹೂಡಿಕೆ ಪ್ರಕ್ರಿಯೆಯು ಸರಾಗವಾಗಿ ನಡೆಯುತ್ತದೆ; ವ್ಯಕ್ತಿಗಳು ತಮ್ಮ ಬಿಲ್ಲರ್ ಅನ್ನು ಸೇರಿಸಬಹುದುಬ್ಯಾಂಕ್ ಖಾತೆಗಳು. ಬ್ಯಾಂಕ್ ಖಾತೆಗಳಲ್ಲಿ ಬಿಲ್ಲರ್ ಅನ್ನು ಸೇರಿಸಲು, ವ್ಯಕ್ತಿಗಳಿಗೆ ನೆಟ್ ಬ್ಯಾಂಕಿಂಗ್ ಅಥವಾ ಮೊಬೈಲ್ ಬ್ಯಾಂಕಿಂಗ್ ಪ್ರಕ್ರಿಯೆಯ ಮೂಲಕ ಬ್ಯಾಂಕ್ ಖಾತೆಗೆ ಸೇರಿಸಬೇಕಾದ SIP ನ ವಿಶಿಷ್ಟ ನೋಂದಣಿ ಸಂಖ್ಯೆ ಅಥವಾ URN ಅಗತ್ಯವಿರುತ್ತದೆ. ಪ್ರತಿ ಬ್ಯಾಂಕ್ಗೆ ಬಿಲ್ಲರ್ ಸೇರಿಸುವ ಪ್ರಕ್ರಿಯೆಯು ವಿಭಿನ್ನವಾಗಿರುತ್ತದೆ. ಆದ್ದರಿಂದ, ನಾವು IndusInd ಬ್ಯಾಂಕ್ನಲ್ಲಿ SIP ವಹಿವಾಟುಗಳಿಗೆ ಬಿಲ್ಲರ್ ಅನ್ನು ಸೇರಿಸುವ ಪ್ರಕ್ರಿಯೆಯನ್ನು ಪರಿಶೀಲಿಸೋಣ.
ನಿಮ್ಮ IndusInd ಬ್ಯಾಂಕ್ ಖಾತೆಗೆ ಲಾಗಿನ್ ಮಾಡಿ ಮತ್ತು ಬಿಲ್ ಪಾವತಿ ಆಯ್ಕೆಯನ್ನು ಕ್ಲಿಕ್ ಮಾಡಿ
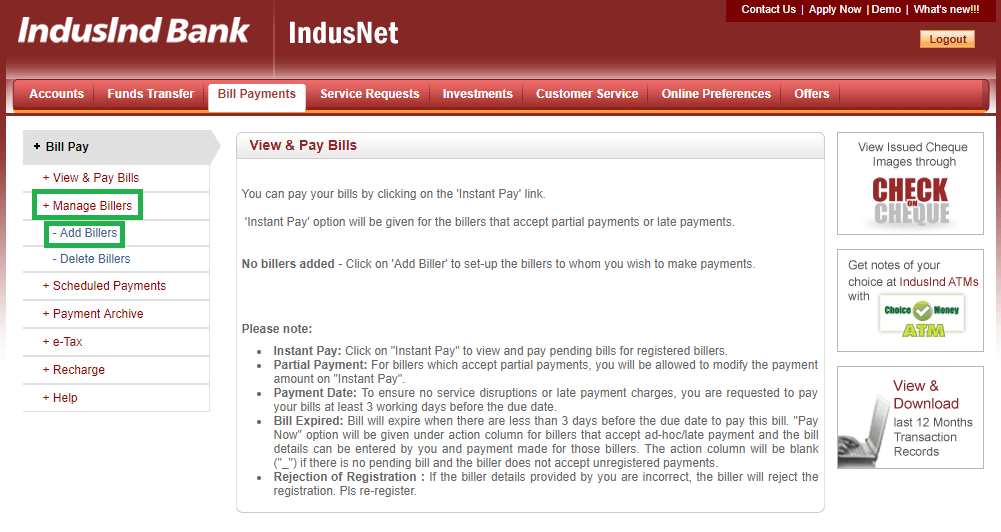
ವ್ಯಕ್ತಿಗಳು ತಮ್ಮ ಬ್ಯಾಂಕ್ ಖಾತೆಗಳಿಗೆ ಲಾಗ್ ಇನ್ ಮಾಡಬೇಕಾದ ಹೆಚ್ಚಿನ ಬ್ಯಾಂಕ್ಗಳಲ್ಲಿ ಮೊದಲ ಹಂತವು ಬಹುತೇಕ ಹೋಲುತ್ತದೆ. ಈ ಸಂದರ್ಭದಲ್ಲಿ ಸಹ, ನಿಮ್ಮ ಲಾಗಿನ್ ರುಜುವಾತುಗಳನ್ನು ಬಳಸಿಕೊಂಡು ನೀವು ಮೊದಲು ನಿಮ್ಮ ಖಾತೆಗೆ ಲಾಗ್ ಇನ್ ಮಾಡಬೇಕಾಗುತ್ತದೆ. ಲಾಗ್ ಇನ್ ಮಾಡಿದ ನಂತರ, ನೀವು ಹೋಮ್ ಸ್ಕ್ರೀನ್ ಅನ್ನು ತಲುಪಿದ ನಂತರ, ನೀವು ಕ್ಲಿಕ್ ಮಾಡಬೇಕಾಗುತ್ತದೆಬಿಲ್ ಪಾವತಿಗಳು ಪರದೆಯ ಮೇಲ್ಭಾಗದಲ್ಲಿರುವ ಟ್ಯಾಬ್. ಈ ಹಂತದ ಚಿತ್ರವನ್ನು ಕೆಳಗೆ ನೀಡಲಾಗಿದೆಬಿಲ್ ಪಾವತಿಗಳು ಟ್ಯಾಬ್ ಅನ್ನು ಹಸಿರು ಬಣ್ಣದಲ್ಲಿ ಹೈಲೈಟ್ ಮಾಡಲಾಗಿದೆ.

ಬಿಲ್ಲರ್ ಟ್ಯಾಬ್ ಅನ್ನು ನಿರ್ವಹಿಸಿ ಮತ್ತು ಆಡ್ ಬಿಲ್ಲರ್ ಆಯ್ಕೆಯನ್ನು ಆಯ್ಕೆಮಾಡಿ
ಒಮ್ಮೆ ನೀವು ಬಿಲ್ ಪಾವತಿಗಳ ಮೇಲೆ ಕ್ಲಿಕ್ ಮಾಡಿದರೆ, ಹೊಸ ಪರದೆಯು ತೆರೆಯುತ್ತದೆ. ಈ ಪರದೆಯಲ್ಲಿ, ನೀವು ಕ್ಲಿಕ್ ಮಾಡಬೇಕಾಗುತ್ತದೆಬಿಲ್ಲರ್ಗಳನ್ನು ನಿರ್ವಹಿಸಿ ಪರದೆಯ ಎಡಭಾಗದಲ್ಲಿರುವ ಟ್ಯಾಬ್. ಒಮ್ಮೆ, ನೀವು ಬಿಲ್ಲರ್ ಅನ್ನು ನಿರ್ವಹಿಸಿ ಆಯ್ಕೆಯನ್ನು ಕ್ಲಿಕ್ ಮಾಡಿ, ಟ್ಯಾಬ್ ವಿಸ್ತರಿಸುತ್ತದೆ ಮತ್ತು ಆ ಟ್ಯಾಬ್ನಲ್ಲಿ, ನೀವು ಕ್ಲಿಕ್ ಮಾಡಬೇಕಾಗುತ್ತದೆಬಿಲ್ಲರ್ಗಳನ್ನು ಸೇರಿಸಿ ಆಯ್ಕೆಯನ್ನು. ಈ ಹಂತದ ಚಿತ್ರವನ್ನು ಕೆಳಗೆ ನೀಡಲಾಗಿದೆ ಅಲ್ಲಿ ಬಿಲ್ಲರ್ಗಳನ್ನು ನಿರ್ವಹಿಸಿ ಮತ್ತು ಬಿಲ್ಲರ್ಗಳನ್ನು ಸೇರಿಸಿ ಆಯ್ಕೆಯನ್ನು ಹಸಿರು ಬಣ್ಣದಲ್ಲಿ ಹೈಲೈಟ್ ಮಾಡಲಾಗಿದೆ.
ಮ್ಯೂಚುವಲ್ ಫಂಡ್ ಆಯ್ಕೆಯ ಮೇಲೆ ಕ್ಲಿಕ್ ಮಾಡಿ ಮತ್ತು ಬಿಎಸ್ಇ ಲಿಮಿಟೆಡ್ ಆಯ್ಕೆಮಾಡಿ
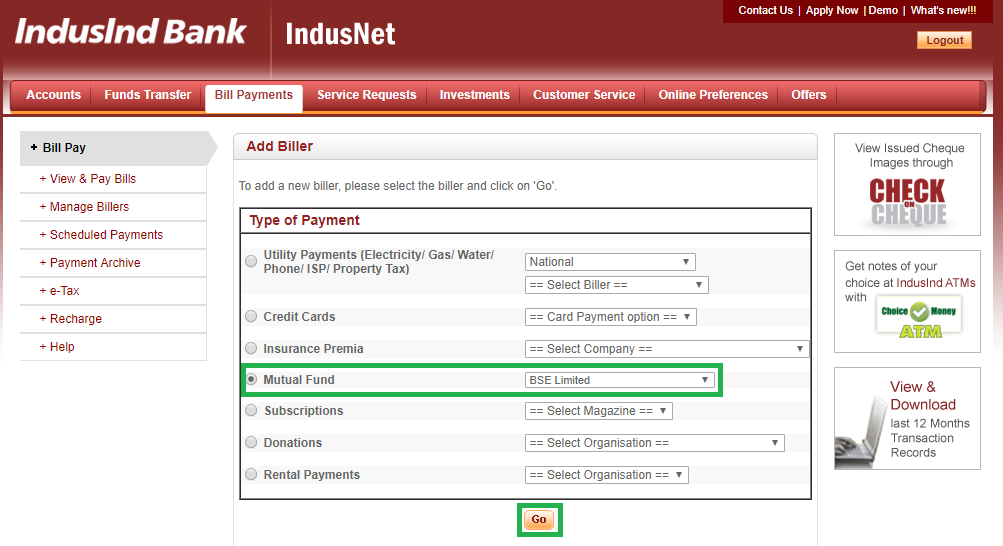
ಒಮ್ಮೆ ನೀವು ಕ್ಲಿಕ್ ಮಾಡಿಬಿಲ್ಲರ್ ಸೇರಿಸಿ ಹಿಂದಿನ ಹಂತದಲ್ಲಿ, ಪಾವತಿಯ ಪ್ರಕಾರವನ್ನು ತೋರಿಸುವ ಹೊಸ ಪರದೆಗೆ ನಿಮ್ಮನ್ನು ಮರುನಿರ್ದೇಶಿಸಲಾಗುತ್ತದೆ. ಈ ವಿಭಾಗದಲ್ಲಿ, ಯುಟಿಲಿಟಿ ಪಾವತಿಗಳಂತಹ ವಿವಿಧ ಆಯ್ಕೆಗಳಿವೆ,ಕ್ರೆಡಿಟ್ ಕಾರ್ಡ್ಗಳು,ವಿಮೆ ಪ್ರೀಮಿಯಾ, ಮತ್ತು ಹೆಚ್ಚು. ಈ ವಿಭಾಗದಲ್ಲಿ, ನೀವು ಕ್ಲಿಕ್ ಮಾಡಬೇಕಾಗುತ್ತದೆಮ್ಯೂಚುಯಲ್ ಫಂಡ್ ಆಯ್ಕೆ ಮತ್ತು ಆಯ್ಕೆBSE ಲಿಮಿಟೆಡ್ ಅದರ ಮುಂದಿನ ಡ್ರಾಪ್ ಡೌನ್ ನಲ್ಲಿ. ಆಯ್ಕೆ ಮಾಡಿದ ನಂತರBSE ಲಿಮಿಟೆಡ್ ನೀವು ಕ್ಲಿಕ್ ಮಾಡಬೇಕಾದ ಆಯ್ಕೆಹೋಗು ಆಯ್ಕೆಯನ್ನು. ಈ ಹಂತದ ಚಿತ್ರವನ್ನು ಕೆಳಗೆ ನೀಡಲಾಗಿದೆ ಅಲ್ಲಿ ಮ್ಯೂಚುಯಲ್ ಫಂಡ್, ಬಿಎಸ್ಇ ಲಿಮಿಟೆಡ್ ಮತ್ತು ಗೋ ಬಟನ್ ಅನ್ನು ಹಸಿರು ಬಣ್ಣದಲ್ಲಿ ಹೈಲೈಟ್ ಮಾಡಲಾಗಿದೆ.
URN ವಿವರಗಳನ್ನು ನಮೂದಿಸಿ
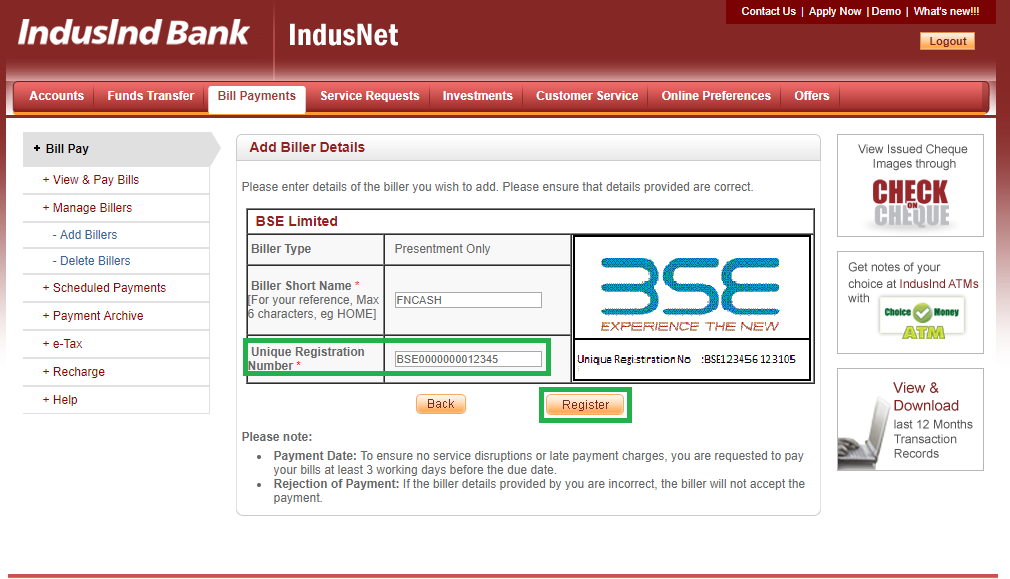
ಆಡ್ ಬಿಲ್ಲರ್ ಪ್ರಕ್ರಿಯೆಯಲ್ಲಿ ಇದು ಪ್ರಮುಖ ಹಂತವಾಗಿದೆ. ಒಮ್ಮೆ ನೀವು ಹೋಗಿ ಕ್ಲಿಕ್ ಮಾಡಿ, ಈ ಹಂತದಲ್ಲಿ, ನಿಮ್ಮನ್ನು ಹೊಸ ಪರದೆಗೆ ಮರುನಿರ್ದೇಶಿಸಲಾಗುತ್ತದೆ, ಇದರಲ್ಲಿ ನೀವು ನಿಮ್ಮ URN ಮತ್ತು ಇತರ ವಿವರಗಳನ್ನು ನಮೂದಿಸಬೇಕಾಗುತ್ತದೆ. ನೀವು ಆರಂಭಿಕ ಪಾವತಿಯನ್ನು ಮಾಡಿದ ನಂತರ ಫಿನ್ಕ್ಯಾಶ್ನಿಂದ ಇಮೇಲ್ ಮೂಲಕ ನಿಮ್ಮ SIP ಗಾಗಿ ಈ URN ಸಂಖ್ಯೆಯನ್ನು ನೀವು ಸ್ವೀಕರಿಸುತ್ತೀರಿ. ನೀವು ಅದನ್ನು ಸ್ವೀಕರಿಸದಿದ್ದರೆ ನಂತರ ನೀವು ಅದೇ ರೀತಿ ಕಾಣಬಹುದುನನ್ನ SIP ಗಳು section of your Fincash Account. URN ಪಡೆದ ನಂತರ, ನೀವು ಅದನ್ನು ಇಲ್ಲಿ ನಮೂದಿಸಬೇಕು ಮತ್ತು ಇತರ ವಿವರಗಳನ್ನು ಸೇರಿಸಬೇಕು. ವಿವರಗಳನ್ನು ನಮೂದಿಸಿದ ನಂತರ, ನೀವು ಕ್ಲಿಕ್ ಮಾಡಬೇಕಾಗುತ್ತದೆನೋಂದಣಿ ಆಯ್ಕೆಯನ್ನು. ಈ ಹಂತದ ಚಿತ್ರವನ್ನು ಕೆಳಗೆ ನೀಡಲಾಗಿದೆ ಅಲ್ಲಿ URN ವಿವರಗಳು ಮತ್ತು ರಿಜಿಸ್ಟರ್ ಬಟನ್ ಎರಡನ್ನೂ ಹಸಿರು ಬಣ್ಣದಲ್ಲಿ ಹೈಲೈಟ್ ಮಾಡಲಾಗಿದೆ.
ಸಾರಾಂಶ ದೃಢೀಕರಣ
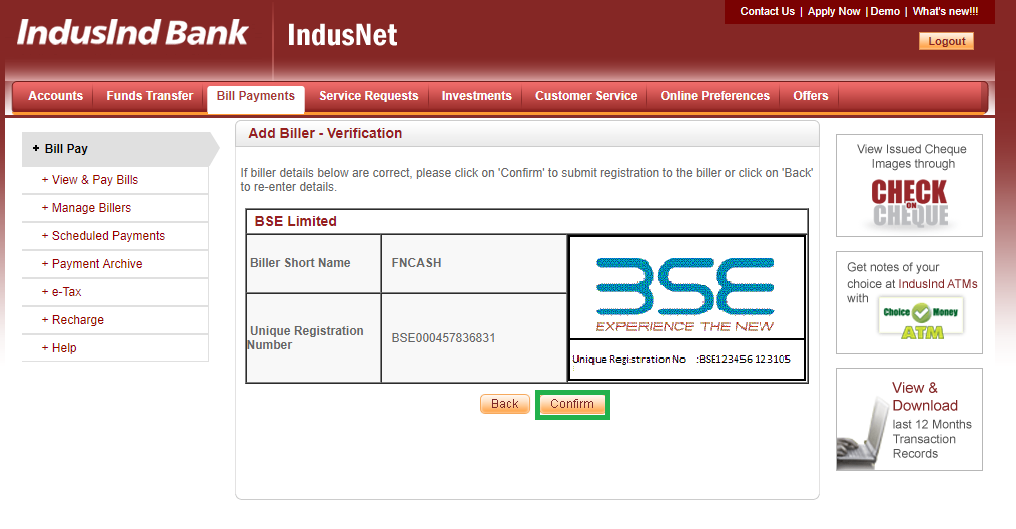
ಒಮ್ಮೆ ನೀವು ಕ್ಲಿಕ್ ಮಾಡಿನೋಂದಣಿ ಹಿಂದಿನ ಹಂತದಲ್ಲಿ, ಹೊಸ ಪರದೆಯು ತೆರೆಯುತ್ತದೆ, ಅದರಲ್ಲಿ ನೀವು ನಮೂದಿಸಿದ ವಿವರಗಳ ಸಾರಾಂಶವನ್ನು ನೀವು ನೋಡಬಹುದು. ಈ ಹಂತದಲ್ಲಿ, ನಮೂದಿಸಿದ ವಿವರಗಳು ಸರಿಯಾಗಿವೆಯೇ ಅಥವಾ ಇಲ್ಲವೇ ಎಂಬುದನ್ನು ನೀವು ಪರಿಶೀಲಿಸಬೇಕು. ಒಮ್ಮೆ ನೀವು ವಿವರಗಳೊಂದಿಗೆ ಪರಿಶೀಲಿಸಿದ ನಂತರ, ನೀವು ಕ್ಲಿಕ್ ಮಾಡಬೇಕಾಗುತ್ತದೆದೃಢೀಕರಿಸಿ. ಈ ಹಂತದ ಚಿತ್ರವನ್ನು ಕೆಳಗೆ ನೀಡಲಾಗಿದೆದೃಢೀಕರಿಸಿ ಬಟನ್ ಅನ್ನು ಹಸಿರು ಬಣ್ಣದಲ್ಲಿ ಹೈಲೈಟ್ ಮಾಡಲಾಗಿದೆ.
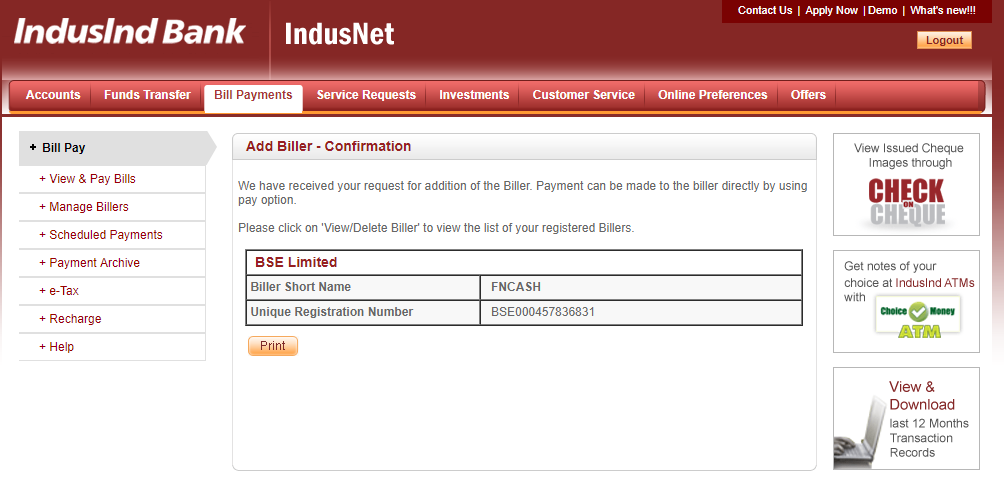
ಬಿಲ್ಲರ್ ದೃಢೀಕರಣ
ಈ ಹಂತದಲ್ಲಿ, ನಿಮ್ಮ ಬಿಲ್ಲರ್ ಅನ್ನು ಯಶಸ್ವಿಯಾಗಿ ಸೇರಿಸಲಾಗಿದೆ ಎಂದು ಹೇಳುವ ಬಿಲ್ಲರ್ ದೃಢೀಕರಣವನ್ನು ನೀವು ಸ್ವೀಕರಿಸುತ್ತೀರಿ. ಈ ಹಂತದ ಚಿತ್ರವನ್ನು ಕೆಳಗೆ ನೀಡಲಾಗಿದೆ.
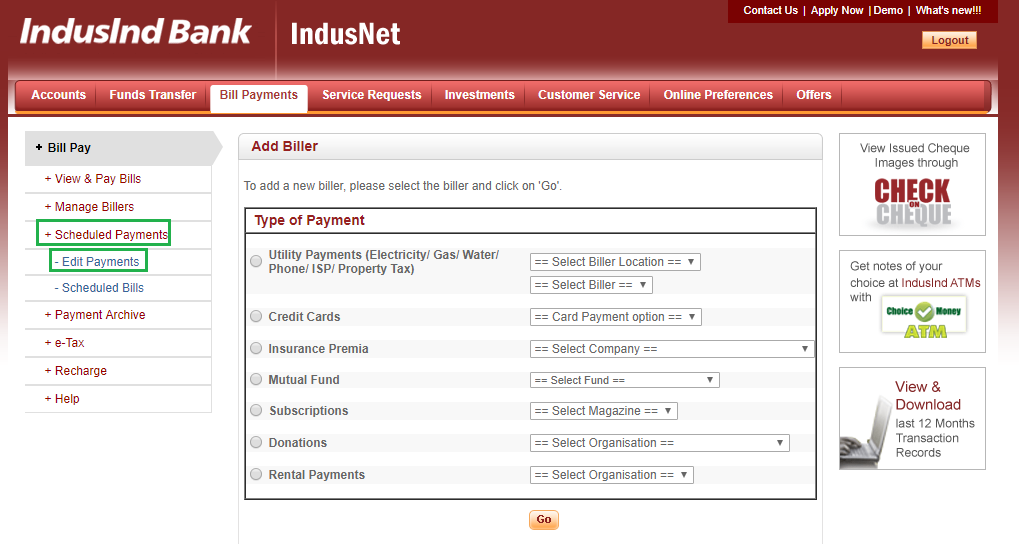
ವೇಳಾಪಟ್ಟಿ ಪಾವತಿಗಳ ಮೇಲೆ ಕ್ಲಿಕ್ ಮಾಡಿ ಮತ್ತು ಪಾವತಿಗಳನ್ನು ಸಂಪಾದಿಸಿ ಆಯ್ಕೆಮಾಡಿ
ಬಿಲ್ಲರ್ ಅನ್ನು ಸೇರಿಸುವ ನಿಮ್ಮ ಪ್ರಕ್ರಿಯೆಯು ಬಿಲ್ಲರ್ ಅನ್ನು ಸೇರಿಸುವ ಮೂಲಕ ನಿಲ್ಲುವುದಿಲ್ಲ. ಒಮ್ಮೆ ನೀವು ಯಶಸ್ವಿಯಾಗಿ ಬಿಲ್ಲರ್ ಅನ್ನು ಸೇರಿಸಿದರೆ, ನಂತರ ನೀವು ಕ್ಲಿಕ್ ಮಾಡಬೇಕಾಗುತ್ತದೆಪಾವತಿಗಳನ್ನು ನಿಗದಿಪಡಿಸಿ ಪರದೆಯ ಎಡಭಾಗದಲ್ಲಿರುವ ಟ್ಯಾಬ್. ಒಮ್ಮೆ ನೀವು ಕ್ಲಿಕ್ ಮಾಡಿದರೆ, ಅದರ ಮೇಲೆ ಟ್ಯಾಬ್ ವಿಸ್ತರಿಸುತ್ತದೆ ಮತ್ತು ಅದರ ಅಡಿಯಲ್ಲಿ ಅನೇಕ ಆಯ್ಕೆಗಳನ್ನು ತೋರಿಸುತ್ತದೆ. ಇಲ್ಲಿ, ನೀವು ಕ್ಲಿಕ್ ಮಾಡಬೇಕಾಗುತ್ತದೆಪಾವತಿಗಳನ್ನು ಸಂಪಾದಿಸಿ ಆಯ್ಕೆಯನ್ನು. ಈ ಹಂತದ ಚಿತ್ರವನ್ನು ಕೆಳಗೆ ನೀಡಲಾಗಿದೆ, ಅಲ್ಲಿ ವೇಳಾಪಟ್ಟಿ ಪಾವತಿಗಳ ಟ್ಯಾಬ್ ಮತ್ತು ಪಾವತಿಗಳನ್ನು ಸಂಪಾದಿಸು ಆಯ್ಕೆಯನ್ನು ಹಸಿರು ಬಣ್ಣದಲ್ಲಿ ಹೈಲೈಟ್ ಮಾಡಲಾಗಿದೆ.
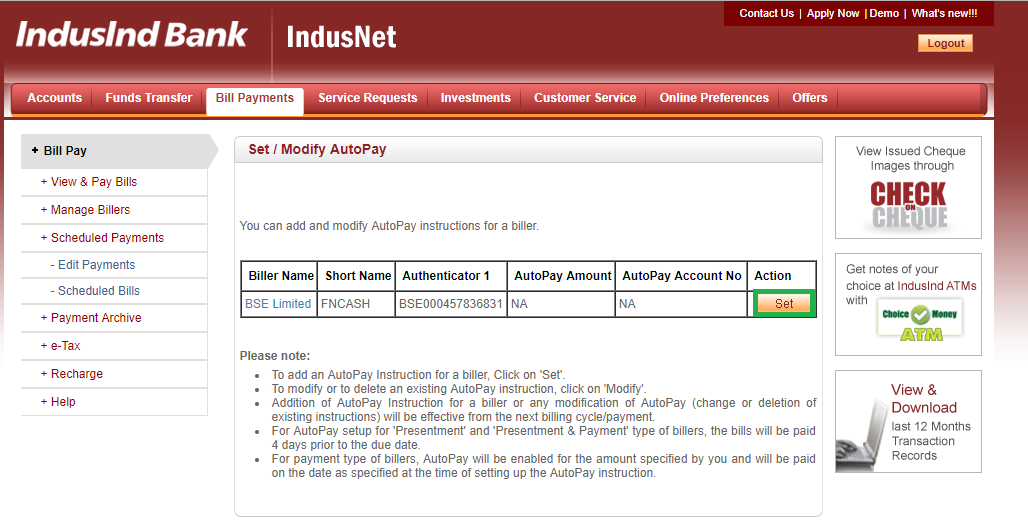
ಮಾರ್ಪಡಿಸಿ ಸ್ವಯಂ ಪಾವತಿ ಪರದೆಯಲ್ಲಿ ಹೊಂದಿಸಿ ಆಯ್ಕೆಯನ್ನು ಕ್ಲಿಕ್ ಮಾಡಿ
ಒಮ್ಮೆ ನೀವು ಕ್ಲಿಕ್ ಮಾಡಿಪಾವತಿಗಳನ್ನು ಸಂಪಾದಿಸಿ, ಹೊಸ ಪರದೆಯು ತೆರೆಯುತ್ತದೆ, ಇದರಲ್ಲಿ ನೀವು ಮ್ಯೂಚುಯಲ್ ಫಂಡ್ ಬಿಲ್ಲರ್ ಅನ್ನು ಸೇರಿಸುವುದನ್ನು ನೋಡಬಹುದು. ನೀವು ಬಿಲ್ಲರ್ ವಿರುದ್ಧ SIP ನ URN ಅನ್ನು ಸಹ ನೋಡಬಹುದು. ಇಲ್ಲಿ, ನೀವು ಕ್ಲಿಕ್ ಮಾಡಬೇಕಾಗುತ್ತದೆಹೊಂದಿಸಿ ಮ್ಯೂಚುಯಲ್ ಫಂಡ್ ಬಿಲ್ಲರ್ ವಿರುದ್ಧ ಆಯ್ಕೆ. ಈ ಹಂತದ ಚಿತ್ರವನ್ನು ಕೆಳಗೆ ನೀಡಲಾಗಿದೆ ಅಲ್ಲಿ ಸೆಟ್ ಆಯ್ಕೆಯನ್ನು ಹಸಿರು ಬಣ್ಣದಲ್ಲಿ ಹೈಲೈಟ್ ಮಾಡಲಾಗಿದೆ.
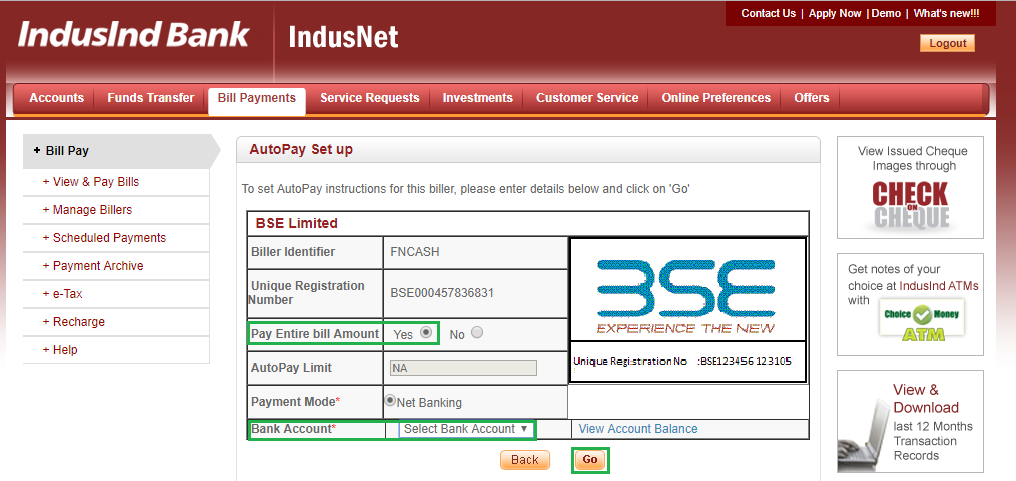
ಪಾವತಿಗಳ ವಿವರಗಳನ್ನು ನಮೂದಿಸಿ ಮತ್ತು ಹೋಗಿ ಕ್ಲಿಕ್ ಮಾಡಿ
ಈ ಹಂತದಲ್ಲಿ, ನೀವು ಪಾವತಿ ವಿವರಗಳನ್ನು ನಮೂದಿಸಬೇಕಾಗುತ್ತದೆ. ಒಮ್ಮೆ ನೀವು ಕ್ಲಿಕ್ ಮಾಡಿಹೊಂದಿಸಿ ಹಿಂದಿನ ಹಂತದಲ್ಲಿ, ನೀವು ಪಾವತಿ ವಿವರಗಳನ್ನು ನಮೂದಿಸಬೇಕಾದ ಹೊಸ ಪರದೆಯು ತೆರೆಯುತ್ತದೆ. ಇಲ್ಲಿ, ವಿರುದ್ಧಸಂಪೂರ್ಣ ಬಿಲ್ ಮೊತ್ತವನ್ನು ಪಾವತಿಸಿ ಆಯ್ಕೆಯನ್ನು, ನೀವು ಆಯ್ಕೆ ಮಾಡಬೇಕಾಗುತ್ತದೆಹೌದು ಆಯ್ಕೆಯನ್ನು. ನಂತರ ನೀವು ಪಾವತಿ ಮೋಡ್ ಅನ್ನು ನೆಟ್ ಬ್ಯಾಂಕಿಂಗ್ ಎಂದು ಆಯ್ಕೆ ಮಾಡಬೇಕಾಗುತ್ತದೆ. ಇದಲ್ಲದೆ, ನೀವು ಪಾವತಿಗಳನ್ನು ಮಾಡಲು ಬಯಸುವ ಬ್ಯಾಂಕ್ ಖಾತೆ ಸಂಖ್ಯೆಯನ್ನು ನೀವು ಆಯ್ಕೆ ಮಾಡಬೇಕಾಗುತ್ತದೆ. ಎಲ್ಲಾ ವಿವರಗಳನ್ನು ನಮೂದಿಸಿದ ನಂತರ, ನೀವು ಕ್ಲಿಕ್ ಮಾಡಬೇಕಾಗುತ್ತದೆಹೋಗು ಪರದೆಯ ಕೆಳಭಾಗದಲ್ಲಿರುವ ಬಟನ್. ಈ ಹಂತದ ಚಿತ್ರವನ್ನು ಕೆಳಗೆ ನೀಡಲಾಗಿದೆ, ಅಲ್ಲಿ ಸಂಪೂರ್ಣ ಬಿಲ್ ಮೊತ್ತವನ್ನು ಪಾವತಿಸಿ ಆಯ್ಕೆ, ಬ್ಯಾಂಕ್ ಖಾತೆ ಟ್ಯಾಬ್ ಮತ್ತು ಗೋ ಬಟನ್ ಅನ್ನು ಹಸಿರು ಬಣ್ಣದಲ್ಲಿ ಹೈಲೈಟ್ ಮಾಡಲಾಗಿದೆ.
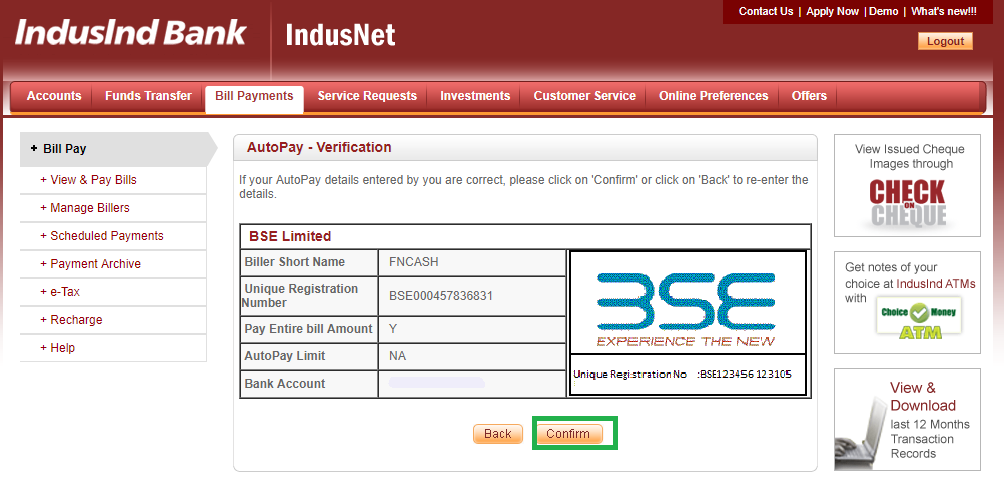
ಪಾವತಿ ವಿವರಗಳ ಪರಿಶೀಲನೆ
ಒಮ್ಮೆ ನೀವು ಪಾವತಿ ವಿವರಗಳನ್ನು ನಮೂದಿಸಿ ಮತ್ತು ಕ್ಲಿಕ್ ಮಾಡಿಹೋಗು, ನಿಮ್ಮನ್ನು ಹೊಸ ಪರದೆಗೆ ಮರುನಿರ್ದೇಶಿಸಲಾಗುತ್ತದೆ, ಇದರಲ್ಲಿ ನೀವು ನಮೂದಿಸಿದ ಎಲ್ಲಾ ವಿವರಗಳನ್ನು ನೀವು ಪರಿಶೀಲಿಸಬಹುದು. ಎಲ್ಲಾ ವಿವರಗಳನ್ನು ಸರಿಯಾಗಿ ನಮೂದಿಸಿರುವುದನ್ನು ನೀವು ಕಂಡುಕೊಂಡರೆ, ನೀವು ಕ್ಲಿಕ್ ಮಾಡಬಹುದುದೃಢೀಕರಿಸಿ. ಇಲ್ಲದಿದ್ದರೆ, ಹಿಂದೆ ಕ್ಲಿಕ್ ಮಾಡಿ ಇದರಿಂದ ನೀವು ಸಂಬಂಧಿತ ವಿವರಗಳನ್ನು ಸಂಪಾದಿಸಬಹುದು. ಈ ಹಂತದ ಚಿತ್ರವನ್ನು ಕೆಳಗೆ ನೀಡಲಾಗಿದೆ ಅಲ್ಲಿ ದೃಢೀಕರಿಸು ಬಟನ್ ಅನ್ನು ಹಸಿರು ಬಣ್ಣದಲ್ಲಿ ಹೈಲೈಟ್ ಮಾಡಲಾಗಿದೆ.
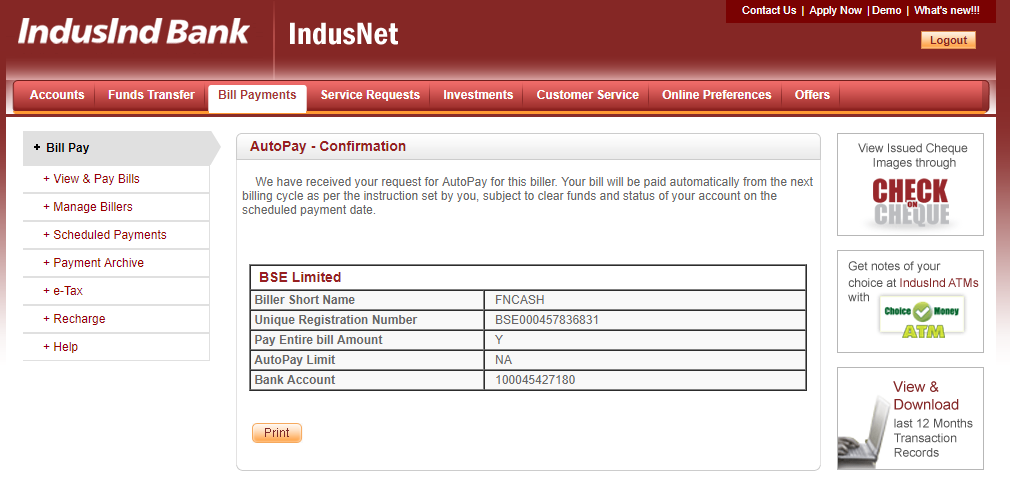
ಸ್ವಯಂ ಪಾವತಿ ವಿವರಗಳ ದೃಢೀಕರಣ
ಈ ಹಂತದಲ್ಲಿ, ನೀವು ಸ್ವಯಂ ಪಾವತಿ ಸ್ಥಿತಿಯ ಬಗ್ಗೆ ದೃಢೀಕರಣವನ್ನು ಪಡೆಯುತ್ತೀರಿ. ಈ ಹಂತದ ಚಿತ್ರವನ್ನು ಕೆಳಗೆ ನೀಡಲಾಗಿದೆ.
ಹೀಗಾಗಿ, ಮೇಲಿನ ಹಂತಗಳಿಂದ, IndusInd ಬ್ಯಾಂಕ್ನಲ್ಲಿ SIP ವಹಿವಾಟುಗಳಿಗೆ ಬಿಲ್ಲರ್ ಅನ್ನು ಸೇರಿಸುವ ಪ್ರಕ್ರಿಯೆಯು ಕಷ್ಟಕರವಲ್ಲ ಎಂದು ಹೇಳಬಹುದು. ಇದನ್ನು ಸೇರಿಸುವ ಮೂಲಕ, ವ್ಯಕ್ತಿಗಳು ತಮ್ಮ SIP ಕಡಿತಗಳು ಸಕಾಲಿಕವಾಗಿ ನಡೆಯುತ್ತವೆ ಎಂದು ಖಚಿತಪಡಿಸಿಕೊಳ್ಳಬಹುದು. ಅವರು ತಮ್ಮ ಬ್ಯಾಂಕ್ ಖಾತೆಯಲ್ಲಿ ಸಾಕಷ್ಟು ಬ್ಯಾಲೆನ್ಸ್ ಹೊಂದಿದ್ದಾರೆ ಎಂದು ಖಚಿತಪಡಿಸಿಕೊಳ್ಳಬೇಕು.
ಉತ್ತಮ ಆದಾಯವನ್ನು ಗಳಿಸಲು ಹೂಡಿಕೆ ಮಾಡಲು ಉತ್ತಮ SIP ಗಳು
ಅದರಂತೆ ಕೆಲವು ಶಿಫಾರಸು SIP ಗಳು ಇಲ್ಲಿವೆ5 ವರ್ಷ ಆದಾಯ ಮತ್ತು AUM ಗಿಂತ ಹೆಚ್ಚುINR 500 ಕೋಟಿ
Fund NAV Net Assets (Cr) Min SIP Investment 3 MO (%) 6 MO (%) 1 YR (%) 3 YR (%) 5 YR (%) 2025 (%) ICICI Prudential Infrastructure Fund Growth ₹202.51
↑ 0.83 ₹8,550 100 1.1 5.4 4.6 18.4 23 6.7 SBI PSU Fund Growth ₹34.3228
↑ 0.27 ₹6,684 500 -4.4 -1.7 9.6 22.4 22.9 11.3 SBI Gold Fund Growth ₹41.2688
↓ -0.10 ₹15,294 500 -5.3 -11.5 42.4 32 22.6 71.5 Axis Gold Fund Growth ₹40.9229
↓ -0.11 ₹2,828 1,000 -5.5 -9.5 41.8 31.6 22.5 69.8 Aditya Birla Sun Life Gold Fund Growth ₹40.9668
↓ -0.05 ₹1,648 100 -5 -13.8 42.1 31.8 22.5 72 Note: Returns up to 1 year are on absolute basis & more than 1 year are on CAGR basis. as on 31 Jul 26 Research Highlights & Commentary of 5 Funds showcased
Commentary ICICI Prudential Infrastructure Fund SBI PSU Fund SBI Gold Fund Axis Gold Fund Aditya Birla Sun Life Gold Fund Point 1 Upper mid AUM (₹8,550 Cr). Lower mid AUM (₹6,684 Cr). Highest AUM (₹15,294 Cr). Bottom quartile AUM (₹2,828 Cr). Bottom quartile AUM (₹1,648 Cr). Point 2 Oldest track record among peers (20 yrs). Established history (16+ yrs). Established history (14+ yrs). Established history (14+ yrs). Established history (14+ yrs). Point 3 Top rated. Rating: 2★ (lower mid). Rating: 2★ (bottom quartile). Rating: 1★ (bottom quartile). Rating: 3★ (upper mid). Point 4 Risk profile: High. Risk profile: High. Risk profile: Moderately High. Risk profile: Moderately High. Risk profile: Moderately High. Point 5 5Y return: 22.96% (top quartile). 5Y return: 22.88% (upper mid). 5Y return: 22.65% (lower mid). 5Y return: 22.48% (bottom quartile). 5Y return: 22.48% (bottom quartile). Point 6 3Y return: 18.40% (bottom quartile). 3Y return: 22.37% (bottom quartile). 3Y return: 32.03% (top quartile). 3Y return: 31.56% (lower mid). 3Y return: 31.78% (upper mid). Point 7 1Y return: 4.59% (bottom quartile). 1Y return: 9.60% (bottom quartile). 1Y return: 42.41% (top quartile). 1Y return: 41.84% (lower mid). 1Y return: 42.10% (upper mid). Point 8 Alpha: 0.00 (top quartile). Alpha: -0.30 (bottom quartile). 1M return: 1.02% (top quartile). 1M return: 0.97% (lower mid). 1M return: 0.98% (upper mid). Point 9 Sharpe: -0.07 (bottom quartile). Sharpe: 0.12 (bottom quartile). Alpha: 0.00 (upper mid). Alpha: 0.00 (lower mid). Alpha: 0.00 (bottom quartile). Point 10 Information ratio: 0.00 (top quartile). Information ratio: -0.11 (bottom quartile). Sharpe: 1.29 (upper mid). Sharpe: 1.35 (top quartile). Sharpe: 1.20 (lower mid). ICICI Prudential Infrastructure Fund
SBI PSU Fund
SBI Gold Fund
Axis Gold Fund
Aditya Birla Sun Life Gold Fund
To generate capital appreciation and income distribution to unit holders by investing predominantly in equity/equity related securities of the companies belonging to the infrastructure development and balance in debt securities and money market instruments. Below is the key information for ICICI Prudential Infrastructure Fund Returns up to 1 year are on The objective of the scheme would be to provide investors with opportunities for long-term growth in capital along with the liquidity of an open-ended scheme through an active management of investments in a diversified basket of equity stocks of domestic Public Sector Undertakings and in debt and money market instruments issued by PSUs AND others. Research Highlights for SBI PSU Fund Below is the key information for SBI PSU Fund Returns up to 1 year are on The scheme seeks to provide returns that closely correspond to returns provided by SBI - ETF Gold (Previously known as SBI GETS). Research Highlights for SBI Gold Fund Below is the key information for SBI Gold Fund Returns up to 1 year are on To generate returns that closely correspond to returns generated by Axis Gold ETF. Research Highlights for Axis Gold Fund Below is the key information for Axis Gold Fund Returns up to 1 year are on An Open ended Fund of Funds Scheme with the investment objective to provide returns that tracks returns provided by Birla Sun Life Gold ETF (BSL Gold ETF). Research Highlights for Aditya Birla Sun Life Gold Fund Below is the key information for Aditya Birla Sun Life Gold Fund Returns up to 1 year are on 1. ICICI Prudential Infrastructure Fund
ICICI Prudential Infrastructure Fund
Growth Launch Date 31 Aug 05 NAV (31 Jul 26) ₹202.51 ↑ 0.83 (0.41 %) Net Assets (Cr) ₹8,550 on 30 Jun 26 Category Equity - Sectoral AMC ICICI Prudential Asset Management Company Limited Rating ☆☆☆ Risk High Expense Ratio 1.89 Sharpe Ratio -0.07 Information Ratio 0 Alpha Ratio 0 Min Investment 5,000 Min SIP Investment 100 Exit Load 0-1 Years (1%),1 Years and above(NIL) Growth of 10,000 investment over the years.
Date Value 31 Jul 21 ₹10,000 31 Jul 22 ₹11,961 31 Jul 23 ₹16,935 31 Jul 24 ₹27,533 31 Jul 25 ₹26,878 31 Jul 26 ₹28,111 Returns for ICICI Prudential Infrastructure Fund
absolute basis & more than 1 year are on CAGR (Compound Annual Growth Rate) basis. as on 31 Jul 26 Duration Returns 1 Month -0.8% 3 Month 1.1% 6 Month 5.4% 1 Year 4.6% 3 Year 18.4% 5 Year 23% 10 Year 15 Year Since launch 15.5% Historical performance (Yearly) on absolute basis
Year Returns 2025 6.7% 2024 27.4% 2023 44.6% 2022 28.8% 2021 50.1% 2020 3.6% 2019 2.6% 2018 -14% 2017 40.8% 2016 2% Fund Manager information for ICICI Prudential Infrastructure Fund
Name Since Tenure Ihab Dalwai 3 Jun 17 9.08 Yr. Sharmila D’mello 30 Jun 22 4.01 Yr. Data below for ICICI Prudential Infrastructure Fund as on 30 Jun 26
Equity Sector Allocation
Sector Value Industrials 47.57% Financial Services 10.57% Utility 10.32% Basic Materials 9.74% Real Estate 8.09% Energy 5.04% Consumer Cyclical 1.98% Communication Services 0.09% Asset Allocation
Asset Class Value Cash 5.83% Equity 94.17% Top Securities Holdings / Portfolio
Name Holding Value Quantity InterGlobe Aviation Ltd (Industrials)
Equity, Since 28 Feb 23 | INDIGO9% ₹745 Cr 1,691,985
↑ 50,000 Larsen & Toubro Ltd (Industrials)
Equity, Since 30 Nov 09 | LT7% ₹614 Cr 1,505,704 Oberoi Realty Ltd (Real Estate)
Equity, Since 31 May 23 | OBEROIRLTY4% ₹365 Cr 2,139,426 Gujarat Energy Ltd (Utilities)
Equity, Since 31 Jan 23 | GUJGASLTD4% ₹340 Cr 8,482,024
↑ 156,557 NTPC Ltd (Utilities)
Equity, Since 29 Feb 16 | NTPC4% ₹334 Cr 8,626,448 Shree Cement Ltd (Basic Materials)
Equity, Since 30 Apr 24 | SHREECEM3% ₹270 Cr 106,892
↑ 3,387 Kalpataru Projects International Ltd (Industrials)
Equity, Since 30 Sep 06 | KPIL3% ₹262 Cr 2,005,608 AIA Engineering Ltd (Industrials)
Equity, Since 28 Feb 21 | AIAENG3% ₹258 Cr 572,697 HDFC Bank Ltd (Financial Services)
Equity, Since 31 Jan 22 | HDFCBANK3% ₹250 Cr 3,357,506
↑ 1,057,506 Container Corporation of India Ltd (Industrials)
Equity, Since 31 Jan 16 | CONCOR3% ₹227 Cr 4,885,153 2. SBI PSU Fund
SBI PSU Fund
Growth Launch Date 7 Jul 10 NAV (31 Jul 26) ₹34.3228 ↑ 0.27 (0.79 %) Net Assets (Cr) ₹6,684 on 30 Jun 26 Category Equity - Sectoral AMC SBI Funds Management Private Limited Rating ☆☆ Risk High Expense Ratio 1.89 Sharpe Ratio 0.12 Information Ratio -0.11 Alpha Ratio -0.3 Min Investment 5,000 Min SIP Investment 500 Exit Load 0-1 Years (1%),1 Years and above(NIL) Growth of 10,000 investment over the years.
Date Value 31 Jul 21 ₹10,000 31 Jul 22 ₹10,878 31 Jul 23 ₹15,287 31 Jul 24 ₹28,684 31 Jul 25 ₹25,557 31 Jul 26 ₹28,011 Returns for SBI PSU Fund
absolute basis & more than 1 year are on CAGR (Compound Annual Growth Rate) basis. as on 31 Jul 26 Duration Returns 1 Month -0.8% 3 Month -4.4% 6 Month -1.7% 1 Year 9.6% 3 Year 22.4% 5 Year 22.9% 10 Year 15 Year Since launch 8% Historical performance (Yearly) on absolute basis
Year Returns 2025 11.3% 2024 23.5% 2023 54% 2022 29% 2021 32.4% 2020 -10% 2019 6% 2018 -23.8% 2017 21.9% 2016 16.2% Fund Manager information for SBI PSU Fund
Name Since Tenure Rohit Shimpi 1 Jun 24 2.08 Yr. Data below for SBI PSU Fund as on 30 Jun 26
Equity Sector Allocation
Sector Value Financial Services 32.54% Utility 31.22% Industrials 14.07% Energy 11.97% Basic Materials 6.94% Asset Allocation
Asset Class Value Cash 3.18% Equity 96.74% Debt 0.07% Top Securities Holdings / Portfolio
Name Holding Value Quantity State Bank of India (Financial Services)
Equity, Since 31 Jul 10 | SBIN17% ₹1,112 Cr 11,527,500
↑ 1,000,000 GAIL (India) Ltd (Utilities)
Equity, Since 31 May 24 | GAIL10% ₹628 Cr 38,150,000 NTPC Ltd (Utilities)
Equity, Since 31 Jul 10 | NTPC9% ₹597 Cr 15,443,244 Bharat Electronics Ltd (Industrials)
Equity, Since 30 Jun 24 | BEL9% ₹583 Cr 14,185,000
↑ 800,000 Power Grid Corp Of India Ltd (Utilities)
Equity, Since 31 Jul 10 | POWERGRID9% ₹579 Cr 19,935,554 Oil & Natural Gas Corp Ltd (Energy)
Equity, Since 31 May 20 | ONGC6% ₹389 Cr 14,655,000 Bank of Baroda (Financial Services)
Equity, Since 31 Aug 24 | BANKBARODA5% ₹352 Cr 13,100,000 Bharat Petroleum Corp Ltd (Energy)
Equity, Since 31 Aug 24 | BPCL4% ₹289 Cr 9,700,000 Bharat Heavy Electricals Ltd (Industrials)
Equity, Since 30 Jun 25 | BHEL4% ₹271 Cr 6,500,000 NMDC Ltd (Basic Materials)
Equity, Since 31 Oct 23 | NMDC4% ₹245 Cr 27,900,000 3. SBI Gold Fund
SBI Gold Fund
Growth Launch Date 12 Sep 11 NAV (31 Jul 26) ₹41.2688 ↓ -0.10 (-0.24 %) Net Assets (Cr) ₹15,294 on 30 Jun 26 Category Gold - Gold AMC SBI Funds Management Private Limited Rating ☆☆ Risk Moderately High Expense Ratio 0.3 Sharpe Ratio 1.29 Information Ratio 0 Alpha Ratio 0 Min Investment 5,000 Min SIP Investment 500 Exit Load 0-1 Years (1%),1 Years and above(NIL) Growth of 10,000 investment over the years.
Date Value 31 Jul 21 ₹10,000 31 Jul 22 ₹10,500 31 Jul 23 ₹12,058 31 Jul 24 ₹13,968 31 Jul 25 ₹19,487 31 Jul 26 ₹27,752 Returns for SBI Gold Fund
absolute basis & more than 1 year are on CAGR (Compound Annual Growth Rate) basis. as on 31 Jul 26 Duration Returns 1 Month 1% 3 Month -5.3% 6 Month -11.5% 1 Year 42.4% 3 Year 32% 5 Year 22.6% 10 Year 15 Year Since launch 10% Historical performance (Yearly) on absolute basis
Year Returns 2025 71.5% 2024 19.6% 2023 14.1% 2022 12.6% 2021 -5.7% 2020 27.4% 2019 22.8% 2018 6.4% 2017 3.5% 2016 10% Fund Manager information for SBI Gold Fund
Name Since Tenure Viral Chhadva 1 Mar 26 0.33 Yr. Data below for SBI Gold Fund as on 30 Jun 26
Asset Allocation
Asset Class Value Cash 1.64% Other 98.36% Top Securities Holdings / Portfolio
Name Holding Value Quantity SBI Gold ETF
- | -100% ₹16,542 Cr 1,246,686,194
↑ 13,950,000 Net Receivable / Payable
CBLO | -0% -₹55 Cr Treps
CBLO/Reverse Repo | -0% ₹45 Cr 4. Axis Gold Fund
Axis Gold Fund
Growth Launch Date 20 Oct 11 NAV (31 Jul 26) ₹40.9229 ↓ -0.11 (-0.27 %) Net Assets (Cr) ₹2,828 on 30 Jun 26 Category Gold - Gold AMC Axis Asset Management Company Limited Rating ☆ Risk Moderately High Expense Ratio 0.5 Sharpe Ratio 1.35 Information Ratio 0 Alpha Ratio 0 Min Investment 5,000 Min SIP Investment 1,000 Exit Load 0-1 Years (1%),1 Years and above(NIL) Growth of 10,000 investment over the years.
Date Value 31 Jul 21 ₹10,000 31 Jul 22 ₹10,512 31 Jul 23 ₹12,108 31 Jul 24 ₹14,013 31 Jul 25 ₹19,436 31 Jul 26 ₹27,568 Returns for Axis Gold Fund
absolute basis & more than 1 year are on CAGR (Compound Annual Growth Rate) basis. as on 31 Jul 26 Duration Returns 1 Month 1% 3 Month -5.5% 6 Month -9.5% 1 Year 41.8% 3 Year 31.6% 5 Year 22.5% 10 Year 15 Year Since launch 10% Historical performance (Yearly) on absolute basis
Year Returns 2025 69.8% 2024 19.2% 2023 14.7% 2022 12.5% 2021 -4.7% 2020 26.9% 2019 23.1% 2018 8.3% 2017 0.7% 2016 10.7% Fund Manager information for Axis Gold Fund
Name Since Tenure Aditya Pagaria 9 Nov 21 4.64 Yr. Pratik Tibrewal 1 Feb 25 1.41 Yr. Data below for Axis Gold Fund as on 30 Jun 26
Asset Allocation
Asset Class Value Cash 1.81% Other 98.19% Top Securities Holdings / Portfolio
Name Holding Value Quantity Axis Gold ETF
- | -100% ₹3,091 Cr 238,687,058
↑ 2,659,572 Clearing Corporation Of India Ltd
CBLO | -0% ₹6 Cr Net Receivables / (Payables)
CBLO | -0% -₹5 Cr 5. Aditya Birla Sun Life Gold Fund
Aditya Birla Sun Life Gold Fund
Growth Launch Date 20 Mar 12 NAV (31 Jul 26) ₹40.9668 ↓ -0.05 (-0.13 %) Net Assets (Cr) ₹1,648 on 30 Jun 26 Category Gold - Gold AMC Birla Sun Life Asset Management Co Ltd Rating ☆☆☆ Risk Moderately High Expense Ratio 0.51 Sharpe Ratio 1.2 Information Ratio 0 Alpha Ratio 0 Min Investment 100 Min SIP Investment 100 Exit Load 0-365 Days (1%),365 Days and above(NIL) Growth of 10,000 investment over the years.
Date Value 31 Jul 21 ₹10,000 31 Jul 22 ₹10,548 31 Jul 23 ₹12,046 31 Jul 24 ₹13,896 31 Jul 25 ₹19,398 31 Jul 26 ₹27,564 Returns for Aditya Birla Sun Life Gold Fund
absolute basis & more than 1 year are on CAGR (Compound Annual Growth Rate) basis. as on 31 Jul 26 Duration Returns 1 Month 1% 3 Month -5% 6 Month -13.8% 1 Year 42.1% 3 Year 31.8% 5 Year 22.5% 10 Year 15 Year Since launch 10.3% Historical performance (Yearly) on absolute basis
Year Returns 2025 72% 2024 18.7% 2023 14.5% 2022 12.3% 2021 -5% 2020 26% 2019 21.3% 2018 6.8% 2017 1.6% 2016 11.5% Fund Manager information for Aditya Birla Sun Life Gold Fund
Name Since Tenure Priya Sridhar 31 Dec 24 1.5 Yr. Data below for Aditya Birla Sun Life Gold Fund as on 30 Jun 26
Asset Allocation
Asset Class Value Cash 1.57% Other 98.43% Top Securities Holdings / Portfolio
Name Holding Value Quantity Aditya BSL Gold ETF
- | -100% ₹1,821 Cr 133,076,381
↑ 939,171 Clearing Corporation Of India Limited
CBLO/Reverse Repo | -0% ₹5 Cr Net Receivables / (Payables)
Net Current Assets | -0% -₹4 Cr
ಯಾವುದೇ ಹೆಚ್ಚಿನ ಪ್ರಶ್ನೆಗಳಿದ್ದಲ್ಲಿ, ನೀವು ಯಾವುದೇ ಕೆಲಸದ ದಿನದಂದು ಬೆಳಿಗ್ಗೆ 9.30 ರಿಂದ ಸಂಜೆ 6.30 ರವರೆಗೆ 8451864111 ನಲ್ಲಿ ನಮ್ಮನ್ನು ಸಂಪರ್ಕಿಸಬಹುದು ಅಥವಾ ಯಾವುದೇ ಸಮಯದಲ್ಲಿ ನಮಗೆ ಮೇಲ್ ಬರೆಯಬಹುದುsupport@fincash.com ಅಥವಾ ನಮ್ಮ ವೆಬ್ಸೈಟ್ಗೆ ಲಾಗ್ ಇನ್ ಮಾಡುವ ಮೂಲಕ ನಮ್ಮೊಂದಿಗೆ ಚಾಟ್ ಮಾಡಿwww.fincash.com.
ಇಲ್ಲಿ ಒದಗಿಸಲಾದ ಮಾಹಿತಿಯು ನಿಖರವಾಗಿದೆ ಎಂದು ಖಚಿತಪಡಿಸಿಕೊಳ್ಳಲು ಎಲ್ಲಾ ಪ್ರಯತ್ನಗಳನ್ನು ಮಾಡಲಾಗಿದೆ. ಆದಾಗ್ಯೂ, ಡೇಟಾದ ನಿಖರತೆಯ ಬಗ್ಗೆ ಯಾವುದೇ ಖಾತರಿಗಳನ್ನು ನೀಡಲಾಗುವುದಿಲ್ಲ. ಯಾವುದೇ ಹೂಡಿಕೆ ಮಾಡುವ ಮೊದಲು ದಯವಿಟ್ಟು ಸ್ಕೀಮ್ ಮಾಹಿತಿ ದಾಖಲೆಯೊಂದಿಗೆ ಪರಿಶೀಲಿಸಿ.
")


AMFI Registration No. 112358 | CIN: U74999MH2016PTC282153
Shepard Technologies Pvt. Ltd. (with ARN code 112358) makes no warranties or representations, express or implied, on products offered through the platform. It accepts no liability for any damages or losses, however caused, in connection with the use of, or on the reliance of its product or related services. Terms and conditions of the website are applicable.
©2026 Shepard Technologies Private Limited. All Rights Reserved
Research Highlights for ICICI Prudential Infrastructure Fund