Neckline
What is Neckline?
In the financial context, the Neckline meaning is defined as the line between your head and shoulder that is used to find profitable investment opportunities. Basically, the concept is used in the Technical Analysis for traders. In other words, the neckline makes it easier for the investor to find strategic buying opportunities.
Since the neckline supports your head and the shoulder, it is used to represent the support or resistance levels for investors. Know that the neckline is rarely straight or horizontal. Mostly, it represents an upward or downward trend. In technical analysis, the neckline is drawn in the head and shoulder pattern. Keep reading to learn more about the use of the neckline to identify the support and resistance levels in the stock market.
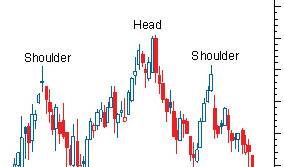
Break Down of the Head and Shoulder Pattern in Stock Market
As mentioned above, the neckline is used to connect the shoulders and head, i.e. the top and bottom pattern in the technical analysis chart. This pattern is designed to represent the support or resistance levels. One of the main reasons why this neckline pattern is considered an ideal way to figure out the support areas is that it enables the investor to get a clear picture of the bullish and bearish reversals.
When the price of the stocks falls below the neckline, then it is a sign the downtrend is likely to happen soon. It also indicates that the uptrend in the stock movement is over. On the other hand, if the stock price goes above the neckline, then it is a sign the uptrend will occur soon.
Talk to our investment specialist
How to use Neckline Chart for Predicting the Bullish & Bearish Trends?
It is important to note that this head and shoulder pattern must be drawn at a specific angle. It cannot be a straight or horizontal line. The reason is the movement in the prices or lows and highs in the share market is never the same. That’s the reason why a line has to be drawn at different angles to connect these slopes. The trend line doesn’t have to be sloped extremely lower or higher. If that happens, then this head and shoulder pattern is not reliable for further analysis. Note that the neckline or trend line is a straight pattern that is used to join the lows and highs of the stock market.
The head and shoulder pattern is considered complete as soon as the third peak is formed and the stock prices break below this line. Most experts and financial analysts recommend this head and shoulder pattern with other technical analysis charts for accurate predictions. There are many technical indicators you can pair with this neckline chart to get a better understanding of the bullish and bearish reversals. For example, you can use the head and shoulder pattern in conjunction with the Relative Strength Index and MACD (Moving Average Convergence Divergence). The more technical tools you use, the higher the chances your stock market movement predictions will turn out accurate.
All efforts have been made to ensure the information provided here is accurate. However, no guarantees are made regarding correctness of data. Please verify with scheme information document before making any investment.
AMFI Registration No. 112358 | CIN: U74999MH2016PTC282153
Shepard Technologies Pvt. Ltd. (with ARN code 112358) makes no warranties or representations, express or implied, on products offered through the platform. It accepts no liability for any damages or losses, however caused, in connection with the use of, or on the reliance of its product or related services. Terms and conditions of the website are applicable.
©2026 Shepard Technologies Private Limited. All Rights Reserved