 +91-22-48913909
Table of Contents
11 Best Large Cap Mutual Funds 2025
Ideally, when someone thinks of Investing, the first thought that comes to one's mind will mostly be equity. When you further explore Equity Funds, you will large-cap funds.
Large cap Mutual Funds are considered to be one of the safest investments in equities as they have good returns and are less volatile to Market fluctuations compared to other equity funds i.e., mid & Small cap funds. These funds invest in the stock of big companies. Investors are keen to invest their monies in large-caps even though the share price of blue-chip companies is high.
Choosing the best large cap mutual fund is an important task that needs to be given due importance. Let's see below the benefits of investing in large cap mutual funds, how to select the best Large cap funds and finally, a list of the top 10 best large cap funds to invest in 2025.
What are Large Cap Funds?
Large cap are mutual funds that primarily invest in the stocks of large-cap companies, which are companies with a market capitalization typically over Rs. 20,000 crore. These funds aim to provide investors with exposure to the largest and most established companies in the stock market. The stocks held in large cap funds are often known as "blue-chip" stocks, which are well-established companies with a long history of stable Earnings and a strong financial position. These stocks are typically less volatile than stocks of smaller companies, making large cap mutual funds a popular choice for investors seeking a relatively stable and low-risk investment option. Large cap mutual funds may also offer the potential for long-term growth, as the companies they invest in are typically leaders in their industries and have the potential for continued expansion and success.
How to Select Large Cap Funds?
Choosing the right large-cap mutual fund is never easy. Some funds tend to perform well, while other funds tend to languish. But, there are a few parameters that investors have to look at while choosing the right fund. One needs to look at a number of quantitative as well as qualitative factors before deciding upon a fund.
Quantitative Factors
The mutual fund rating could be a good starting point. This needs to be supplemented with other data such as fund age, assets under management (AUM), past returns, expense ratio, etc. Furthermore, investors are advised to check last three years performance of a fund. A fund should have net assets of over INR 1000 crore and also must have a minimum average allocation of 65 percent to large cap stocks over the past one year.
Talk to our investment specialist
Qualitative Factors
This further needs to be filtered with qualitative factors such as fund house reputation, the fund manager track record and the investment process. One must select the fund house on which you have faith to invest your money. Identifying fund houses that have a strong presence in the market and provide a variety of funds that have a long and consistent track record. One should also see how many of the funds are top performers. A fund manager with a good track record is a must. An Asset Management Company with a set institutionalised investment process is also important since this ensures that it's a process that gets you to make money rather than just a fund manager (person - and hence keyman risk). By doing the above, one can try and select the best large cap fund or even make a list of the top 10 best large cap funds to choose from.
Top 11 Best Performing Large Cap Mutual Funds FY 25 - 26
Fund NAV Net Assets (Cr) 3 MO (%) 6 MO (%) 1 YR (%) 3 YR (%) 5 YR (%) 2024 (%) Nippon India Large Cap Fund Growth ₹91.7174
↓ -0.07 ₹41,750 11.3 6 5.9 25 26.6 18.2 DSP BlackRock TOP 100 Equity Growth ₹479.071
↓ -0.96 ₹6,036 8.1 6.1 9.2 22.9 20.9 20.5 ICICI Prudential Bluechip Fund Growth ₹111.66
↑ 0.03 ₹69,763 9.9 7 7.3 22.8 23.8 16.9 Invesco India Largecap Fund Growth ₹70.8
↓ -0.07 ₹1,488 14 4.9 6.4 22 21.6 20 IDBI India Top 100 Equity Fund Growth ₹44.16
↑ 0.05 ₹655 9.2 12.5 15.4 21.9 12.6 HDFC Top 100 Fund Growth ₹1,152.86
↓ -1.29 ₹37,716 8.6 5 3.8 21.1 23 11.6 BNP Paribas Large Cap Fund Growth ₹224.065
↓ -0.31 ₹2,614 9.7 2.8 2.1 20.8 20.6 20.1 IDFC Large Cap Fund Growth ₹77.558
↓ -0.01 ₹1,862 10.8 4.1 5.1 20.7 20.7 18.7 JM Large Cap Fund Growth ₹155.954
↓ -0.13 ₹526 10.3 1.6 -3 20.7 18.7 15.1 Edelweiss Large Cap Fund Growth ₹85.58
↑ 0.01 ₹1,271 10 4.9 4.1 20.6 20.9 14.6 Aditya Birla Sun Life Frontline Equity Fund Growth ₹536.27
↓ -0.47 ₹29,859 11.3 6.7 6.6 20.4 21.9 15.6 Note: Returns up to 1 year are on absolute basis & more than 1 year are on CAGR basis. as on 1 Jul 25
*List of 11 Best Large cap mutual funds with AUM/Net Assets > 500 Crore. Having fund age >=3 Sorted on 3 Year CAGR Returns.
(Erstwhile Reliance Top 200 Fund) The primary investment objective of the scheme is to seek to generate long term capital appreciation by investing in equity and equity related instruments of companies whose market capitalization is within the range of highest & lowest market capitalization of S&P BSE 200 Index. The secondary objective is to generate consistent returns by investing in debt and money market securities. Nippon India Large Cap Fund is a Equity - Large Cap fund was launched on 8 Aug 07. It is a fund with Moderately High risk and has given a Below is the key information for Nippon India Large Cap Fund Returns up to 1 year are on The Fund is seeking to generate capital appreciation, from a portfolio that is substantially constituted of equity and equity related securities of the 100 largest corporates, by market capitalisation, listed in India. DSP BlackRock TOP 100 Equity is a Equity - Large Cap fund was launched on 10 Mar 03. It is a fund with Moderately High risk and has given a Below is the key information for DSP BlackRock TOP 100 Equity Returns up to 1 year are on (Erstwhile ICICI Prudential Focused Bluechip Equity Fund) To generate long-term capital appreciation and income distribution to unit holders from a portfolio that is invested in equity and equity related securities of about 20 companies belonging to the large cap domain and the balance in debt securities and money market instruments. The Fund Manager will always select stocks for investment from among Top 200 stocks in terms of market capitalization on the National Stock Exchange of India Ltd. If the total assets under management under this scheme goes above Rs. 1,000 crores the Fund
Manager reserves the right to increase the number of companies to more than 20. ICICI Prudential Bluechip Fund is a Equity - Large Cap fund was launched on 23 May 08. It is a fund with Moderately High risk and has given a Below is the key information for ICICI Prudential Bluechip Fund Returns up to 1 year are on (Erstwhile Invesco India Business Leaders Fund) To generate long term capital appreciation by investing in equity and equity related instruments including equity derivatives of companies which in our opinion are leaders in their respective industry or industry segment. However, there is no assurance or guarantee that the investment objective of the Scheme will be achieved. The Scheme does not assure or guarantee any returns. Invesco India Largecap Fund is a Equity - Large Cap fund was launched on 21 Aug 09. It is a fund with Moderately High risk and has given a Below is the key information for Invesco India Largecap Fund Returns up to 1 year are on The Investment objective of the Scheme is to provide investors with the opportunities for long-term capital appreciation by investing predominantly in Equity and Equity related Instruments of Large Cap companies. However
there can be no assurance that the investment objective under the Scheme will be realized. IDBI India Top 100 Equity Fund is a Equity - Large Cap fund was launched on 15 May 12. It is a fund with Moderately High risk and has given a Below is the key information for IDBI India Top 100 Equity Fund Returns up to 1 year are on (Erstwhile HDFC Top 200) To generate long term capital appreciation from a portfolio of equity and equity linked instruments. The investment portfolio for equity and equity linked instruments will be primarily drawn from the companies in the BSE 200 Index.
Further, the Scheme may also invest in listed companies that would qualify to be in the top 200 by market capitalisation on the BSE even though they may not be listed on the BSE. This includes participation in large Ipos where in the market
capitalisation of the company based on issue price would make the company a part of the top 200 companies listed on the BSE based on market capitalisation. HDFC Top 100 Fund is a Equity - Large Cap fund was launched on 11 Oct 96. It is a fund with Moderately High risk and has given a Below is the key information for HDFC Top 100 Fund Returns up to 1 year are on (Erstwhile BNP Paribas Equity Fund) The investment objective of the Scheme is to generate long-term capital growth from a diversifi ed and actively managed portfolio of equity and equity related securities. The Scheme will invest in a range of companies, with a bias towards large & medium market capitalisation companies. However, there can be no
assurance that the investment objective of the Scheme will be achieved. The Scheme does not guarantee / indicate any returns. BNP Paribas Large Cap Fund is a Equity - Large Cap fund was launched on 23 Sep 04. It is a fund with Moderately High risk and has given a Below is the key information for BNP Paribas Large Cap Fund Returns up to 1 year are on (Erstwhile IDFC Equity Fund) The investment objective of the scheme is to seek to generate
capital growth from a portfolio of predominantly equity and equity
related instruments (including Equity Derivatives). The scheme
may also invest in debt & money market instruments to generate
reasonable income. However there is no assurance or guarantee that the objectives of the scheme will be realized. IDFC Large Cap Fund is a Equity - Large Cap fund was launched on 9 Jun 06. It is a fund with Moderately High risk and has given a Below is the key information for IDFC Large Cap Fund Returns up to 1 year are on (Erstwhile JM Equity Fund) The scheme seeks to provide optimum capital growth and appreciation. JM Large Cap Fund is a Equity - Large Cap fund was launched on 1 Apr 95. It is a fund with Moderately High risk and has given a Below is the key information for JM Large Cap Fund Returns up to 1 year are on (Erstwhile Edelweiss Large Cap Advantage Fund) The investment objective is to seek to generate long-term capital appreciation from a portfolio predominantly consisting equity and equity-related securities of the 100 largest corporate by market capitalisation listed in India.
However, there is no assurance that the investment objective of the Scheme will be realized and the Scheme does not assure or guarantee any returns. Edelweiss Large Cap Fund is a Equity - Large Cap fund was launched on 20 May 09. It is a fund with Moderately High risk and has given a Below is the key information for Edelweiss Large Cap Fund Returns up to 1 year are on An Open-ended growth scheme with the objective of long term growth of capital, through a portfolio with a target allocation of 100% equity by aiming at being as diversified across various industries and or sectors as its chosen benchmark index, S&P BSE 200. Aditya Birla Sun Life Frontline Equity Fund is a Equity - Large Cap fund was launched on 30 Aug 02. It is a fund with Moderately High risk and has given a Below is the key information for Aditya Birla Sun Life Frontline Equity Fund Returns up to 1 year are on 1. Nippon India Large Cap Fund
CAGR/Annualized return of 13.2% since its launch. Ranked 20 in Large Cap category. Return for 2024 was 18.2% , 2023 was 32.1% and 2022 was 11.3% . Nippon India Large Cap Fund
Growth Launch Date 8 Aug 07 NAV (01 Jul 25) ₹91.7174 ↓ -0.07 (-0.08 %) Net Assets (Cr) ₹41,750 on 31 May 25 Category Equity - Large Cap AMC Nippon Life Asset Management Ltd. Rating ☆☆☆☆ Risk Moderately High Expense Ratio 1.7 Sharpe Ratio 0.26 Information Ratio 2.01 Alpha Ratio -0.23 Min Investment 5,000 Min SIP Investment 100 Exit Load 0-1 Years (1%),1 Years and above(NIL) Growth of 10,000 investment over the years.
Date Value 30 Jun 20 ₹10,000 30 Jun 21 ₹15,877 30 Jun 22 ₹16,794 30 Jun 23 ₹22,142 30 Jun 24 ₹30,855 30 Jun 25 ₹32,970 Returns for Nippon India Large Cap Fund
absolute basis & more than 1 year are on CAGR (Compound Annual Growth Rate) basis. as on 1 Jul 25 Duration Returns 1 Month 3.1% 3 Month 11.3% 6 Month 6% 1 Year 5.9% 3 Year 25% 5 Year 26.6% 10 Year 15 Year Since launch 13.2% Historical performance (Yearly) on absolute basis
Year Returns 2024 18.2% 2023 32.1% 2022 11.3% 2021 32.4% 2020 4.9% 2019 7.3% 2018 -0.2% 2017 38.4% 2016 2.2% 2015 1.1% Fund Manager information for Nippon India Large Cap Fund
Name Since Tenure Sailesh Raj Bhan 8 Aug 07 17.83 Yr. Kinjal Desai 25 May 18 7.02 Yr. Bhavik Dave 19 Aug 24 0.78 Yr. Data below for Nippon India Large Cap Fund as on 31 May 25
Equity Sector Allocation
Sector Value Financial Services 34.51% Consumer Cyclical 14.03% Industrials 10.26% Consumer Defensive 8.54% Energy 7.83% Technology 7.14% Basic Materials 6.26% Utility 5.17% Health Care 3.41% Communication Services 0.23% Asset Allocation
Asset Class Value Cash 2% Equity 98% Top Securities Holdings / Portfolio
Name Holding Value Quantity HDFC Bank Ltd (Financial Services)
Equity, Since 31 Dec 08 | HDFCBANK9% ₹3,606 Cr 18,540,367 Reliance Industries Ltd (Energy)
Equity, Since 31 Aug 19 | RELIANCE7% ₹2,989 Cr 21,036,077 ICICI Bank Ltd (Financial Services)
Equity, Since 31 Oct 09 | ICICIBANK6% ₹2,458 Cr 17,000,000 Axis Bank Ltd (Financial Services)
Equity, Since 31 Mar 15 | AXISBANK5% ₹1,966 Cr 16,489,098 Larsen & Toubro Ltd (Industrials)
Equity, Since 30 Sep 07 | LT4% ₹1,617 Cr 4,400,529 State Bank of India (Financial Services)
Equity, Since 31 Oct 10 | SBIN3% ₹1,438 Cr 17,700,644 Bajaj Finance Ltd (Financial Services)
Equity, Since 31 Dec 21 | BAJFINANCE3% ₹1,428 Cr 1,555,711 ITC Ltd (Consumer Defensive)
Equity, Since 31 Jan 16 | ITC3% ₹1,287 Cr 30,791,313
↑ 16,721,265 GE Vernova T&D India Ltd (Industrials)
Equity, Since 30 Jun 12 | 5222753% ₹1,172 Cr 5,229,540 Infosys Ltd (Technology)
Equity, Since 30 Sep 07 | INFY3% ₹1,063 Cr 6,800,494 2. DSP BlackRock TOP 100 Equity
CAGR/Annualized return of 18.9% since its launch. Ranked 60 in Large Cap category. Return for 2024 was 20.5% , 2023 was 26.6% and 2022 was 1.4% . DSP BlackRock TOP 100 Equity
Growth Launch Date 10 Mar 03 NAV (01 Jul 25) ₹479.071 ↓ -0.96 (-0.20 %) Net Assets (Cr) ₹6,036 on 31 May 25 Category Equity - Large Cap AMC DSP BlackRock Invmt Managers Pvt. Ltd. Rating ☆☆ Risk Moderately High Expense Ratio 2.08 Sharpe Ratio 0.66 Information Ratio 1 Alpha Ratio 5.37 Min Investment 1,000 Min SIP Investment 500 Exit Load 0-12 Months (1%),12 Months and above(NIL) Growth of 10,000 investment over the years.
Date Value 30 Jun 20 ₹10,000 30 Jun 21 ₹14,836 30 Jun 22 ₹13,812 30 Jun 23 ₹17,330 30 Jun 24 ₹23,514 30 Jun 25 ₹25,946 Returns for DSP BlackRock TOP 100 Equity
absolute basis & more than 1 year are on CAGR (Compound Annual Growth Rate) basis. as on 1 Jul 25 Duration Returns 1 Month 1.6% 3 Month 8.1% 6 Month 6.1% 1 Year 9.2% 3 Year 22.9% 5 Year 20.9% 10 Year 15 Year Since launch 18.9% Historical performance (Yearly) on absolute basis
Year Returns 2024 20.5% 2023 26.6% 2022 1.4% 2021 19.5% 2020 7.5% 2019 14.8% 2018 -2.7% 2017 26.5% 2016 4.9% 2015 -2.3% Fund Manager information for DSP BlackRock TOP 100 Equity
Name Since Tenure Abhishek Singh 1 Jun 22 3 Yr. Data below for DSP BlackRock TOP 100 Equity as on 31 May 25
Equity Sector Allocation
Sector Value Financial Services 43.95% Consumer Cyclical 13.14% Health Care 6.64% Technology 5.77% Utility 5.53% Consumer Defensive 4.87% Energy 3.84% Communication Services 1.4% Basic Materials 1.26% Industrials 1.05% Asset Allocation
Asset Class Value Cash 12.54% Equity 87.46% Top Securities Holdings / Portfolio
Name Holding Value Quantity HDFC Bank Ltd (Financial Services)
Equity, Since 30 Sep 14 | HDFCBANK9% ₹555 Cr 2,855,081
↑ 156,348 ICICI Bank Ltd (Financial Services)
Equity, Since 31 Jul 16 | ICICIBANK8% ₹495 Cr 3,420,782 Mahindra & Mahindra Ltd (Consumer Cyclical)
Equity, Since 28 Feb 22 | M&M5% ₹298 Cr 1,002,342 ITC Ltd (Consumer Defensive)
Equity, Since 31 Mar 21 | ITC5% ₹294 Cr 7,025,441
↑ 200,359 Axis Bank Ltd (Financial Services)
Equity, Since 31 Oct 21 | AXISBANK5% ₹283 Cr 2,375,515 SBI Life Insurance Co Ltd (Financial Services)
Equity, Since 30 Sep 17 | SBILIFE5% ₹275 Cr 1,520,172
↑ 48,619 Kotak Mahindra Bank Ltd (Financial Services)
Equity, Since 31 May 24 | KOTAKBANK4% ₹271 Cr 1,306,305
↑ 290,358 Bajaj Finance Ltd (Financial Services)
Equity, Since 30 Jun 22 | BAJFINANCE4% ₹252 Cr 274,515 Cipla Ltd (Healthcare)
Equity, Since 30 Jun 20 | CIPLA4% ₹234 Cr 1,594,830
↑ 139,826 NTPC Ltd (Utilities)
Equity, Since 30 Nov 23 | NTPC4% ₹213 Cr 6,390,400
↑ 852,920 3. ICICI Prudential Bluechip Fund
CAGR/Annualized return of 15.1% since its launch. Ranked 21 in Large Cap category. Return for 2024 was 16.9% , 2023 was 27.4% and 2022 was 6.9% . ICICI Prudential Bluechip Fund
Growth Launch Date 23 May 08 NAV (01 Jul 25) ₹111.66 ↑ 0.03 (0.03 %) Net Assets (Cr) ₹69,763 on 31 May 25 Category Equity - Large Cap AMC ICICI Prudential Asset Management Company Limited Rating ☆☆☆☆ Risk Moderately High Expense Ratio 1.69 Sharpe Ratio 0.34 Information Ratio 1.25 Alpha Ratio 2.02 Min Investment 5,000 Min SIP Investment 100 Exit Load 0-1 Years (1%),1 Years and above(NIL) Growth of 10,000 investment over the years.
Date Value 30 Jun 20 ₹10,000 30 Jun 21 ₹15,204 30 Jun 22 ₹15,881 30 Jun 23 ₹19,643 30 Jun 24 ₹27,184 30 Jun 25 ₹29,322 Returns for ICICI Prudential Bluechip Fund
absolute basis & more than 1 year are on CAGR (Compound Annual Growth Rate) basis. as on 1 Jul 25 Duration Returns 1 Month 2.9% 3 Month 9.9% 6 Month 7% 1 Year 7.3% 3 Year 22.8% 5 Year 23.8% 10 Year 15 Year Since launch 15.1% Historical performance (Yearly) on absolute basis
Year Returns 2024 16.9% 2023 27.4% 2022 6.9% 2021 29.2% 2020 13.5% 2019 9.8% 2018 -0.8% 2017 32.7% 2016 7.7% 2015 -0.2% Fund Manager information for ICICI Prudential Bluechip Fund
Name Since Tenure Anish Tawakley 5 Sep 18 6.74 Yr. Vaibhav Dusad 18 Jan 21 4.37 Yr. Sharmila D’mello 31 Jul 22 2.84 Yr. Data below for ICICI Prudential Bluechip Fund as on 31 May 25
Equity Sector Allocation
Sector Value Financial Services 29.61% Industrials 10.6% Consumer Cyclical 9.75% Energy 9.58% Basic Materials 6.77% Technology 5.91% Health Care 5.25% Communication Services 4.54% Consumer Defensive 4.3% Utility 3.4% Real Estate 1.24% Asset Allocation
Asset Class Value Cash 8.63% Equity 91.27% Other 0.1% Top Securities Holdings / Portfolio
Name Holding Value Quantity HDFC Bank Ltd (Financial Services)
Equity, Since 31 Dec 10 | HDFCBANK10% ₹6,742 Cr 34,665,562 ICICI Bank Ltd (Financial Services)
Equity, Since 30 Jun 08 | ICICIBANK9% ₹6,270 Cr 43,364,687
↑ 600,000 Reliance Industries Ltd (Energy)
Equity, Since 30 Jun 08 | RELIANCE6% ₹4,462 Cr 31,400,781 Larsen & Toubro Ltd (Industrials)
Equity, Since 31 Jan 12 | LT6% ₹4,365 Cr 11,876,248
↑ 650 Bharti Airtel Ltd (Communication Services)
Equity, Since 31 Aug 09 | BHARTIARTL4% ₹3,101 Cr 16,706,913
↑ 380,718 Axis Bank Ltd (Financial Services)
Equity, Since 31 Mar 14 | AXISBANK4% ₹3,004 Cr 25,197,029
↑ 892,821 Maruti Suzuki India Ltd (Consumer Cyclical)
Equity, Since 30 Apr 16 | MARUTI4% ₹2,905 Cr 2,358,549 UltraTech Cement Ltd (Basic Materials)
Equity, Since 30 Sep 17 | ULTRACEMCO4% ₹2,657 Cr 2,370,478
↓ -26,405 Infosys Ltd (Technology)
Equity, Since 30 Nov 10 | INFY3% ₹2,411 Cr 15,429,639
↑ 300,000 Sun Pharmaceuticals Industries Ltd (Healthcare)
Equity, Since 31 Jul 15 | SUNPHARMA3% ₹1,895 Cr 11,295,632
↑ 477,472 4. Invesco India Largecap Fund
CAGR/Annualized return of 13.1% since its launch. Ranked 39 in Large Cap category. Return for 2024 was 20% , 2023 was 27.8% and 2022 was -3% . Invesco India Largecap Fund
Growth Launch Date 21 Aug 09 NAV (01 Jul 25) ₹70.8 ↓ -0.07 (-0.10 %) Net Assets (Cr) ₹1,488 on 31 May 25 Category Equity - Large Cap AMC Invesco Asset Management (India) Private Ltd Rating ☆☆☆ Risk Moderately High Expense Ratio 2.21 Sharpe Ratio 0.3 Information Ratio 0.62 Alpha Ratio 2.05 Min Investment 5,000 Min SIP Investment 100 Exit Load 0-1 Years (1%),1 Years and above(NIL) Growth of 10,000 investment over the years.
Date Value 30 Jun 20 ₹10,000 30 Jun 21 ₹14,726 30 Jun 22 ₹14,734 30 Jun 23 ₹18,221 30 Jun 24 ₹24,923 30 Jun 25 ₹26,774 Returns for Invesco India Largecap Fund
absolute basis & more than 1 year are on CAGR (Compound Annual Growth Rate) basis. as on 1 Jul 25 Duration Returns 1 Month 3.9% 3 Month 14% 6 Month 4.9% 1 Year 6.4% 3 Year 22% 5 Year 21.6% 10 Year 15 Year Since launch 13.1% Historical performance (Yearly) on absolute basis
Year Returns 2024 20% 2023 27.8% 2022 -3% 2021 32.5% 2020 14.1% 2019 10.5% 2018 -0.4% 2017 28.3% 2016 2.8% 2015 4.6% Fund Manager information for Invesco India Largecap Fund
Name Since Tenure Amit Nigam 3 Sep 20 4.75 Yr. Hiten Jain 1 Dec 23 1.5 Yr. Data below for Invesco India Largecap Fund as on 31 May 25
Equity Sector Allocation
Sector Value Financial Services 31.56% Consumer Cyclical 16.12% Industrials 10.82% Technology 10.19% Consumer Defensive 6.79% Health Care 6.73% Energy 6.42% Communication Services 4% Utility 2.34% Basic Materials 2.32% Real Estate 1.04% Asset Allocation
Asset Class Value Cash 1.68% Equity 98.32% Top Securities Holdings / Portfolio
Name Holding Value Quantity HDFC Bank Ltd (Financial Services)
Equity, Since 30 Sep 09 | HDFCBANK9% ₹129 Cr 661,467 ICICI Bank Ltd (Financial Services)
Equity, Since 30 Sep 19 | ICICIBANK7% ₹108 Cr 747,101 Infosys Ltd (Technology)
Equity, Since 30 Apr 18 | INFY5% ₹70 Cr 446,588 Reliance Industries Ltd (Energy)
Equity, Since 31 Mar 17 | RELIANCE4% ₹60 Cr 424,891 Bharti Airtel Ltd (Communication Services)
Equity, Since 31 Dec 19 | BHARTIARTL4% ₹59 Cr 320,404 Bajaj Finance Ltd (Financial Services)
Equity, Since 28 Feb 25 | BAJFINANCE4% ₹59 Cr 64,758
↑ 14,044 Kotak Mahindra Bank Ltd (Financial Services)
Equity, Since 28 Feb 25 | KOTAKBANK3% ₹45 Cr 219,008 Axis Bank Ltd (Financial Services)
Equity, Since 30 Nov 20 | AXISBANK3% ₹44 Cr 372,088
↓ -55,999 Titan Co Ltd (Consumer Cyclical)
Equity, Since 30 Apr 23 | TITAN3% ₹41 Cr 114,075 Eicher Motors Ltd (Consumer Cyclical)
Equity, Since 30 Nov 23 | EICHERMOT3% ₹40 Cr 74,457 5. IDBI India Top 100 Equity Fund
CAGR/Annualized return of 14.2% since its launch. Ranked 45 in Large Cap category. . IDBI India Top 100 Equity Fund
Growth Launch Date 15 May 12 NAV (28 Jul 23) ₹44.16 ↑ 0.05 (0.11 %) Net Assets (Cr) ₹655 on 30 Jun 23 Category Equity - Large Cap AMC IDBI Asset Management Limited Rating ☆☆☆ Risk Moderately High Expense Ratio 2.47 Sharpe Ratio 1.09 Information Ratio 0.14 Alpha Ratio 2.11 Min Investment 5,000 Min SIP Investment 500 Exit Load 0-1 Years (1%),1 Years and above(NIL) Growth of 10,000 investment over the years.
Date Value 30 Jun 20 ₹10,000 30 Jun 21 ₹15,400 30 Jun 22 ₹15,461 30 Jun 23 ₹19,038 Returns for IDBI India Top 100 Equity Fund
absolute basis & more than 1 year are on CAGR (Compound Annual Growth Rate) basis. as on 1 Jul 25 Duration Returns 1 Month 3% 3 Month 9.2% 6 Month 12.5% 1 Year 15.4% 3 Year 21.9% 5 Year 12.6% 10 Year 15 Year Since launch 14.2% Historical performance (Yearly) on absolute basis
Year Returns 2024 2023 2022 2021 2020 2019 2018 2017 2016 2015 Fund Manager information for IDBI India Top 100 Equity Fund
Name Since Tenure Data below for IDBI India Top 100 Equity Fund as on 30 Jun 23
Equity Sector Allocation
Sector Value Asset Allocation
Asset Class Value Top Securities Holdings / Portfolio
Name Holding Value Quantity 6. HDFC Top 100 Fund
CAGR/Annualized return of 18.8% since its launch. Ranked 43 in Large Cap category. Return for 2024 was 11.6% , 2023 was 30% and 2022 was 10.6% . HDFC Top 100 Fund
Growth Launch Date 11 Oct 96 NAV (01 Jul 25) ₹1,152.86 ↓ -1.29 (-0.11 %) Net Assets (Cr) ₹37,716 on 31 May 25 Category Equity - Large Cap AMC HDFC Asset Management Company Limited Rating ☆☆☆ Risk Moderately High Expense Ratio 1.67 Sharpe Ratio 0.05 Information Ratio 0.83 Alpha Ratio -2 Min Investment 5,000 Min SIP Investment 300 Exit Load 0-1 Years (1%),1 Years and above(NIL) Growth of 10,000 investment over the years.
Date Value 30 Jun 20 ₹10,000 30 Jun 21 ₹15,489 30 Jun 22 ₹16,108 30 Jun 23 ₹20,358 30 Jun 24 ₹27,431 30 Jun 25 ₹28,613 Returns for HDFC Top 100 Fund
absolute basis & more than 1 year are on CAGR (Compound Annual Growth Rate) basis. as on 1 Jul 25 Duration Returns 1 Month 2.9% 3 Month 8.6% 6 Month 5% 1 Year 3.8% 3 Year 21.1% 5 Year 23% 10 Year 15 Year Since launch 18.8% Historical performance (Yearly) on absolute basis
Year Returns 2024 11.6% 2023 30% 2022 10.6% 2021 28.5% 2020 5.9% 2019 7.7% 2018 0.1% 2017 32% 2016 8.5% 2015 -6.1% Fund Manager information for HDFC Top 100 Fund
Name Since Tenure Rahul Baijal 29 Jul 22 2.84 Yr. Dhruv Muchhal 22 Jun 23 1.95 Yr. Data below for HDFC Top 100 Fund as on 31 May 25
Equity Sector Allocation
Sector Value Financial Services 34.01% Consumer Cyclical 12.71% Industrials 8.17% Energy 7.49% Technology 7.29% Health Care 6.74% Communication Services 5.87% Consumer Defensive 5.85% Utility 4.34% Basic Materials 3.39% Real Estate 0.63% Asset Allocation
Asset Class Value Cash 3.25% Equity 96.75% Top Securities Holdings / Portfolio
Name Holding Value Quantity ICICI Bank Ltd (Financial Services)
Equity, Since 31 Dec 05 | ICICIBANK10% ₹3,761 Cr 26,015,474 HDFC Bank Ltd (Financial Services)
Equity, Since 31 Jan 10 | HDFCBANK10% ₹3,720 Cr 19,126,319
↓ -1,000,000 Bharti Airtel Ltd (Communication Services)
Equity, Since 30 Apr 20 | BHARTIARTL6% ₹2,213 Cr 11,921,785 Reliance Industries Ltd (Energy)
Equity, Since 31 Mar 06 | RELIANCE6% ₹2,110 Cr 14,850,234
↑ 1,300,000 Axis Bank Ltd (Financial Services)
Equity, Since 31 Jan 07 | AXISBANK5% ₹2,035 Cr 17,068,255 NTPC Ltd (Utilities)
Equity, Since 30 Jun 15 | NTPC4% ₹1,635 Cr 48,969,743
↓ -700,000 Kotak Mahindra Bank Ltd (Financial Services)
Equity, Since 31 Aug 23 | KOTAKBANK4% ₹1,523 Cr 7,341,626 Infosys Ltd (Technology)
Equity, Since 31 Aug 04 | INFY4% ₹1,346 Cr 8,613,818 Larsen & Toubro Ltd (Industrials)
Equity, Since 31 Aug 06 | LT3% ₹1,313 Cr 3,572,531
↓ -330,000 Tata Motors Ltd (Consumer Cyclical)
Equity, Since 31 Aug 20 | TATAMOTORS3% ₹1,234 Cr 17,156,512 7. BNP Paribas Large Cap Fund
CAGR/Annualized return of 16.1% since its launch. Ranked 38 in Large Cap category. Return for 2024 was 20.1% , 2023 was 24.8% and 2022 was 4.2% . BNP Paribas Large Cap Fund
Growth Launch Date 23 Sep 04 NAV (01 Jul 25) ₹224.065 ↓ -0.31 (-0.14 %) Net Assets (Cr) ₹2,614 on 31 May 25 Category Equity - Large Cap AMC BNP Paribas Asset Mgmt India Pvt. Ltd Rating ☆☆☆ Risk Moderately High Expense Ratio 2.11 Sharpe Ratio 0.06 Information Ratio 0.72 Alpha Ratio -2.15 Min Investment 5,000 Min SIP Investment 300 Exit Load 0-12 Months (1%),12 Months and above(NIL) Growth of 10,000 investment over the years.
Date Value 30 Jun 20 ₹10,000 30 Jun 21 ₹14,496 30 Jun 22 ₹14,596 30 Jun 23 ₹17,727 30 Jun 24 ₹25,062 30 Jun 25 ₹25,749 Returns for BNP Paribas Large Cap Fund
absolute basis & more than 1 year are on CAGR (Compound Annual Growth Rate) basis. as on 1 Jul 25 Duration Returns 1 Month 2.7% 3 Month 9.7% 6 Month 2.8% 1 Year 2.1% 3 Year 20.8% 5 Year 20.6% 10 Year 15 Year Since launch 16.1% Historical performance (Yearly) on absolute basis
Year Returns 2024 20.1% 2023 24.8% 2022 4.2% 2021 22.1% 2020 16.8% 2019 17.2% 2018 -4% 2017 37% 2016 -5.5% 2015 5.6% Fund Manager information for BNP Paribas Large Cap Fund
Name Since Tenure Jitendra Sriram 16 Jun 22 2.96 Yr. Kushant Arora 21 Oct 24 0.61 Yr. Data below for BNP Paribas Large Cap Fund as on 31 May 25
Equity Sector Allocation
Sector Value Financial Services 28.97% Industrials 11.52% Consumer Cyclical 9.8% Technology 9.01% Energy 8.61% Consumer Defensive 8.02% Health Care 5.43% Basic Materials 4.76% Utility 4.61% Communication Services 3.87% Asset Allocation
Asset Class Value Cash 4.88% Equity 94.14% Debt 0.98% Top Securities Holdings / Portfolio
Name Holding Value Quantity HDFC Bank Ltd (Financial Services)
Equity, Since 31 Jul 08 | HDFCBANK8% ₹215 Cr 1,107,000 ICICI Bank Ltd (Financial Services)
Equity, Since 30 Jun 12 | ICICIBANK7% ₹195 Cr 1,350,000 Reliance Industries Ltd (Energy)
Equity, Since 30 Sep 17 | RELIANCE6% ₹153 Cr 1,080,000 Kotak Mahindra Bank Ltd (Financial Services)
Equity, Since 28 Feb 15 | KOTAKBANK4% ₹103 Cr 495,000 Larsen & Toubro Ltd (Industrials)
Equity, Since 30 Apr 20 | LT4% ₹99 Cr 270,000 Hitachi Energy India Ltd Ordinary Shares (Industrials)
Equity, Since 31 Aug 23 | POWERINDIA4% ₹92 Cr 47,700
↓ -1,800 Tata Consultancy Services Ltd (Technology)
Equity, Since 30 Jun 18 | TCS3% ₹81 Cr 234,000 Infosys Ltd (Technology)
Equity, Since 31 Mar 09 | INFY3% ₹76 Cr 486,000 Bharti Airtel Ltd (Communication Services)
Equity, Since 29 Feb 08 | BHARTIARTL3% ₹75 Cr 405,000 ITC Ltd (Consumer Defensive)
Equity, Since 28 Feb 18 | ITC2% ₹60 Cr 1,440,000 8. IDFC Large Cap Fund
CAGR/Annualized return of 11.3% since its launch. Ranked 57 in Large Cap category. Return for 2024 was 18.7% , 2023 was 26.8% and 2022 was -2.3% . IDFC Large Cap Fund
Growth Launch Date 9 Jun 06 NAV (01 Jul 25) ₹77.558 ↓ -0.01 (-0.02 %) Net Assets (Cr) ₹1,862 on 31 May 25 Category Equity - Large Cap AMC IDFC Asset Management Company Limited Rating ☆☆ Risk Moderately High Expense Ratio 2.13 Sharpe Ratio 0.3 Information Ratio 0.32 Alpha Ratio 0.38 Min Investment 5,000 Min SIP Investment 100 Exit Load 0-365 Days (1%),365 Days and above(NIL) Growth of 10,000 investment over the years.
Date Value 30 Jun 20 ₹10,000 30 Jun 21 ₹14,698 30 Jun 22 ₹14,583 30 Jun 23 ₹17,910 30 Jun 24 ₹24,252 30 Jun 25 ₹25,702 Returns for IDFC Large Cap Fund
absolute basis & more than 1 year are on CAGR (Compound Annual Growth Rate) basis. as on 1 Jul 25 Duration Returns 1 Month 3.4% 3 Month 10.8% 6 Month 4.1% 1 Year 5.1% 3 Year 20.7% 5 Year 20.7% 10 Year 15 Year Since launch 11.3% Historical performance (Yearly) on absolute basis
Year Returns 2024 18.7% 2023 26.8% 2022 -2.3% 2021 26.8% 2020 17.4% 2019 10.6% 2018 -4.2% 2017 34.2% 2016 5.3% 2015 -5.7% Fund Manager information for IDFC Large Cap Fund
Name Since Tenure Manish Gunwani 2 Dec 24 0.5 Yr. Prateek Poddar 2 Dec 24 0.5 Yr. Ritika Behera 7 Oct 23 1.65 Yr. Gaurav Satra 7 Jun 24 0.98 Yr. Data below for IDFC Large Cap Fund as on 31 May 25
Equity Sector Allocation
Sector Value Financial Services 31.31% Technology 12.33% Consumer Cyclical 12.33% Energy 7.71% Industrials 6.93% Health Care 6.29% Consumer Defensive 6.02% Basic Materials 5.66% Utility 4.63% Real Estate 2.94% Communication Services 2.76% Asset Allocation
Asset Class Value Cash 1.08% Equity 98.92% Top Securities Holdings / Portfolio
Name Holding Value Quantity HDFC Bank Ltd (Financial Services)
Equity, Since 28 Feb 07 | HDFCBANK9% ₹174 Cr 894,287
↓ -13,680 ICICI Bank Ltd (Financial Services)
Equity, Since 31 Oct 18 | ICICIBANK8% ₹150 Cr 1,036,390
↓ -172,338 Reliance Industries Ltd (Energy)
Equity, Since 28 Feb 07 | RELIANCE8% ₹144 Cr 1,011,010
↓ -43,063 Axis Bank Ltd (Financial Services)
Equity, Since 30 Nov 22 | AXISBANK5% ₹85 Cr 714,765
↑ 176,795 Tata Consultancy Services Ltd (Technology)
Equity, Since 31 Mar 18 | TCS4% ₹73 Cr 209,743
↓ -21,331 NTPC Ltd (Utilities)
Equity, Since 31 Dec 24 | NTPC3% ₹60 Cr 1,793,002
↓ -27,429 Infosys Ltd (Technology)
Equity, Since 31 Aug 11 | INFY3% ₹57 Cr 362,874
↑ 35,305 Mahindra & Mahindra Ltd (Consumer Cyclical)
Equity, Since 30 Apr 24 | M&M3% ₹50 Cr 168,382
↓ -20,955 Varun Beverages Ltd (Consumer Defensive)
Equity, Since 31 Aug 23 | VBL3% ₹50 Cr 1,051,766
↓ -107,879 Sun Pharmaceuticals Industries Ltd (Healthcare)
Equity, Since 31 Aug 24 | SUNPHARMA3% ₹49 Cr 292,131
↑ 16,945 9. JM Large Cap Fund
CAGR/Annualized return of 9.5% since its launch. Ranked 73 in Large Cap category. Return for 2024 was 15.1% , 2023 was 29.6% and 2022 was 3.4% . JM Large Cap Fund
Growth Launch Date 1 Apr 95 NAV (01 Jul 25) ₹155.954 ↓ -0.13 (-0.08 %) Net Assets (Cr) ₹526 on 31 May 25 Category Equity - Large Cap AMC JM Financial Asset Management Limited Rating ☆☆ Risk Moderately High Expense Ratio 2.46 Sharpe Ratio -0.39 Information Ratio 0.11 Alpha Ratio -10.67 Min Investment 5,000 Min SIP Investment 500 Exit Load 0-60 Days (1%),60 Days and above(NIL) Growth of 10,000 investment over the years.
Date Value 30 Jun 20 ₹10,000 30 Jun 21 ₹13,426 30 Jun 22 ₹13,529 30 Jun 23 ₹16,719 30 Jun 24 ₹24,342 30 Jun 25 ₹23,802 Returns for JM Large Cap Fund
absolute basis & more than 1 year are on CAGR (Compound Annual Growth Rate) basis. as on 1 Jul 25 Duration Returns 1 Month 4.2% 3 Month 10.3% 6 Month 1.6% 1 Year -3% 3 Year 20.7% 5 Year 18.7% 10 Year 15 Year Since launch 9.5% Historical performance (Yearly) on absolute basis
Year Returns 2024 15.1% 2023 29.6% 2022 3.4% 2021 23.2% 2020 18.1% 2019 4.9% 2018 0.8% 2017 20.9% 2016 1.8% 2015 -1.3% Fund Manager information for JM Large Cap Fund
Name Since Tenure Satish Ramanathan 20 Aug 21 3.78 Yr. Asit Bhandarkar 5 Oct 17 7.66 Yr. Ruchi Fozdar 4 Oct 24 0.66 Yr. Deepak Gupta 27 Jan 25 0.34 Yr. Data below for JM Large Cap Fund as on 31 May 25
Equity Sector Allocation
Sector Value Financial Services 31.9% Industrials 13.85% Technology 10.81% Consumer Cyclical 10.73% Basic Materials 7.8% Communication Services 7.27% Utility 4.56% Health Care 3.97% Energy 3.65% Consumer Defensive 2.89% Real Estate 0.98% Asset Allocation
Asset Class Value Cash 1.59% Equity 98.41% Top Securities Holdings / Portfolio
Name Holding Value Quantity HDFC Bank Ltd (Financial Services)
Equity, Since 30 Sep 12 | HDFCBANK8% ₹40 Cr 207,472 ICICI Bank Ltd (Financial Services)
Equity, Since 31 Jan 11 | ICICIBANK5% ₹26 Cr 177,087 Bharti Airtel Ltd (Communication Services)
Equity, Since 31 Mar 24 | BHARTIARTL5% ₹25 Cr 133,000
↑ 43,000 Larsen & Toubro Ltd (Industrials)
Equity, Since 28 Feb 25 | LT4% ₹22 Cr 60,500 Infosys Ltd (Technology)
Equity, Since 30 Apr 15 | INFY4% ₹21 Cr 133,498
↓ -500 State Bank of India (Financial Services)
Equity, Since 31 Oct 11 | SBIN3% ₹18 Cr 223,397
↓ -70,000 Reliance Industries Ltd (Energy)
Equity, Since 31 Mar 25 | RELIANCE3% ₹14 Cr 100,000
↓ -40,000 Axis Bank Ltd (Financial Services)
Equity, Since 31 Mar 25 | AXISBANK2% ₹13 Cr 110,000 HDFC Life Insurance Co Ltd (Financial Services)
Equity, Since 31 Mar 25 | HDFCLIFE2% ₹13 Cr 162,400
↓ -33,250 Tech Mahindra Ltd (Technology)
Equity, Since 30 Apr 25 | TECHM2% ₹12 Cr 75,000 10. Edelweiss Large Cap Fund
CAGR/Annualized return of 14.3% since its launch. Ranked 66 in Large Cap category. Return for 2024 was 14.6% , 2023 was 25.7% and 2022 was 3.4% . Edelweiss Large Cap Fund
Growth Launch Date 20 May 09 NAV (01 Jul 25) ₹85.58 ↑ 0.01 (0.01 %) Net Assets (Cr) ₹1,271 on 31 May 25 Category Equity - Large Cap AMC Edelweiss Asset Management Limited Rating ☆☆ Risk Moderately High Expense Ratio 2.36 Sharpe Ratio 0.15 Information Ratio 0.66 Alpha Ratio -0.7 Min Investment 1,000 Min SIP Investment 100 Exit Load 0-365 Days (1%),365 Days and above(NIL) Growth of 10,000 investment over the years.
Date Value 30 Jun 20 ₹10,000 30 Jun 21 ₹15,114 30 Jun 22 ₹14,892 30 Jun 23 ₹18,805 30 Jun 24 ₹24,947 30 Jun 25 ₹26,096 Returns for Edelweiss Large Cap Fund
absolute basis & more than 1 year are on CAGR (Compound Annual Growth Rate) basis. as on 1 Jul 25 Duration Returns 1 Month 3.2% 3 Month 10% 6 Month 4.9% 1 Year 4.1% 3 Year 20.6% 5 Year 20.9% 10 Year 15 Year Since launch 14.3% Historical performance (Yearly) on absolute basis
Year Returns 2024 14.6% 2023 25.7% 2022 3.4% 2021 23.4% 2020 17.3% 2019 11.5% 2018 1.7% 2017 33.8% 2016 0.4% 2015 0.8% Fund Manager information for Edelweiss Large Cap Fund
Name Since Tenure Bhavesh Jain 2 May 17 8.17 Yr. Bharat Lahoti 1 Oct 21 3.75 Yr. Data below for Edelweiss Large Cap Fund as on 31 May 25
Equity Sector Allocation
Sector Value Financial Services 34.3% Health Care 10.27% Consumer Cyclical 8.68% Consumer Defensive 7.72% Industrials 7.42% Energy 7.18% Technology 6.88% Basic Materials 5.08% Communication Services 4.05% Utility 2.2% Asset Allocation
Asset Class Value Cash 1.37% Equity 98.63% Top Securities Holdings / Portfolio
Name Holding Value Quantity ICICI Bank Ltd (Financial Services)
Equity, Since 31 Jan 18 | ICICIBANK8% ₹100 Cr 689,514 HDFC Bank Ltd (Financial Services)
Equity, Since 30 Jun 20 | HDFCBANK7% ₹92 Cr 472,853
↑ 20,794 Reliance Industries Ltd (Energy)
Equity, Since 30 Apr 10 | RELIANCE6% ₹73 Cr 514,987
↑ 27,186 Larsen & Toubro Ltd (Industrials)
Equity, Since 31 Dec 10 | LT4% ₹46 Cr 126,444 Axis Bank Ltd (Financial Services)
Equity, Since 30 Sep 18 | AXISBANK3% ₹43 Cr 363,486
↑ 60,067 Bajaj Finance Ltd (Financial Services)
Equity, Since 31 Aug 21 | BAJFINANCE3% ₹37 Cr 40,121
↓ -10,308 Bharti Airtel Ltd (Communication Services)
Equity, Since 31 Mar 20 | BHARTIARTL3% ₹37 Cr 197,077
↑ 29,555 Nifty 26-Jun-2025
- | -3% ₹35 Cr 14,025
↑ 14,025 Kotak Mahindra Bank Ltd (Financial Services)
Equity, Since 31 Mar 21 | KOTAKBANK3% ₹35 Cr 166,584
↑ 8,625 ITC Ltd (Consumer Defensive)
Equity, Since 31 Dec 10 | ITC3% ₹33 Cr 798,525 11. Aditya Birla Sun Life Frontline Equity Fund
CAGR/Annualized return of 19% since its launch. Ranked 14 in Large Cap category. Return for 2024 was 15.6% , 2023 was 23.1% and 2022 was 3.5% . Aditya Birla Sun Life Frontline Equity Fund
Growth Launch Date 30 Aug 02 NAV (01 Jul 25) ₹536.27 ↓ -0.47 (-0.09 %) Net Assets (Cr) ₹29,859 on 31 May 25 Category Equity - Large Cap AMC Birla Sun Life Asset Management Co Ltd Rating ☆☆☆☆ Risk Moderately High Expense Ratio 1.67 Sharpe Ratio 0.34 Information Ratio 0.64 Alpha Ratio 2.25 Min Investment 1,000 Min SIP Investment 100 Exit Load 0-365 Days (1%),365 Days and above(NIL) Growth of 10,000 investment over the years.
Date Value 30 Jun 20 ₹10,000 30 Jun 21 ₹15,456 30 Jun 22 ₹15,553 30 Jun 23 ₹19,193 30 Jun 24 ₹25,376 30 Jun 25 ₹27,229 Returns for Aditya Birla Sun Life Frontline Equity Fund
absolute basis & more than 1 year are on CAGR (Compound Annual Growth Rate) basis. as on 1 Jul 25 Duration Returns 1 Month 3.4% 3 Month 11.3% 6 Month 6.7% 1 Year 6.6% 3 Year 20.4% 5 Year 21.9% 10 Year 15 Year Since launch 19% Historical performance (Yearly) on absolute basis
Year Returns 2024 15.6% 2023 23.1% 2022 3.5% 2021 27.9% 2020 14.2% 2019 7.6% 2018 -2.9% 2017 30.6% 2016 7.4% 2015 1.1% Fund Manager information for Aditya Birla Sun Life Frontline Equity Fund
Name Since Tenure Mahesh Patil 17 Nov 05 19.55 Yr. Dhaval Joshi 21 Nov 22 2.53 Yr. Data below for Aditya Birla Sun Life Frontline Equity Fund as on 31 May 25
Equity Sector Allocation
Sector Value Financial Services 34.21% Consumer Cyclical 11.78% Industrials 8.85% Technology 8.69% Consumer Defensive 7.07% Energy 6.38% Health Care 5.86% Basic Materials 4.71% Communication Services 4.44% Utility 2.29% Real Estate 1.35% Asset Allocation
Asset Class Value Cash 2.58% Equity 97.21% Debt 0.21% Top Securities Holdings / Portfolio
Name Holding Value Quantity HDFC Bank Ltd (Financial Services)
Equity, Since 30 Apr 07 | HDFCBANK8% ₹2,468 Cr 12,689,852 ICICI Bank Ltd (Financial Services)
Equity, Since 31 Oct 09 | ICICIBANK8% ₹2,390 Cr 16,528,292 Infosys Ltd (Technology)
Equity, Since 30 Apr 05 | INFY5% ₹1,568 Cr 10,033,663 Reliance Industries Ltd (Energy)
Equity, Since 30 Apr 05 | RELIANCE5% ₹1,533 Cr 10,787,510 Larsen & Toubro Ltd (Industrials)
Equity, Since 30 Apr 08 | LT5% ₹1,352 Cr 3,678,215 Bharti Airtel Ltd (Communication Services)
Equity, Since 31 Oct 17 | BHARTIARTL4% ₹1,102 Cr 5,937,535 Axis Bank Ltd (Financial Services)
Equity, Since 31 Aug 13 | AXISBANK4% ₹1,088 Cr 9,126,955 Kotak Mahindra Bank Ltd (Financial Services)
Equity, Since 30 Apr 15 | KOTAKBANK3% ₹949 Cr 4,574,639 Mahindra & Mahindra Ltd (Consumer Cyclical)
Equity, Since 28 Feb 15 | M&M3% ₹804 Cr 2,700,646 ITC Ltd (Consumer Defensive)
Equity, Since 31 Jan 08 | ITC2% ₹727 Cr 17,383,392
↑ 912,248
Why to Invest in Best Large Cap Mutual Funds
1. Stable Investment
Large companies are well-established which means that they have more consistent Income. The large cap fund invests in companies that are large, have been around for many years, have a stable workforce and an establish product/service that generates revenue. That is why one of the greatest benefits of large cap stocks is the stability they provide.This reflects in the Portfolio of the large cap mutual fund and in its NAV too.
2. Steady Returns
In long-term, though large-cap funds have lower returns than mid- and small-cap funds, the returns in large cap are more steady. The Volatility in mid-caps is much higher and one sees more periods of losses in mid caps than large caps. As an investor if one wants to invest in equities, then investing in large cap mutual funds could be a starting point.
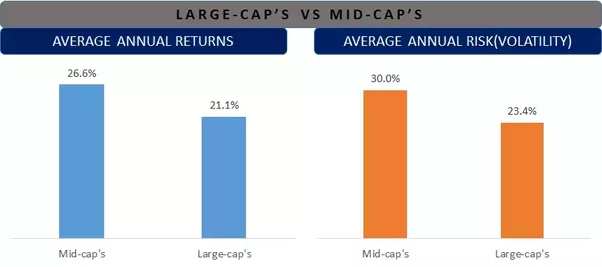
3. Less Volatile
Large cap funds are less volatile than mid- and small-cap funds. This has also been proven with historical data too. The image below has an analysis of Large Cap's average annual returns of last 15 years. This is done by using BSE Sensex as a proxy for large-cap and BSE mid-cap for mid-caps.
4. Moderately High-Risk
As the investments are made in large companies, these funds tend to have low-risk compared to mid- and small-cap funds. But, equities can lead to losses in the short run. Therefore, one should be prepared to see losses and not lose sleep over the same. If one does have a long holding period (at least more than 5 years) and follows certain basics of investing, then one can make good amount of profits.
How to Invest in Best Large Cap Funds Online?
Open Free Investment Account for Lifetime at Fincash.com
Complete your Registration and KYC Process
Upload Documents (PAN, Aadhaar, etc.). And, You are Ready to Invest!
Conclusion
Since large cap funds invest in companies with big market capitalization, these firms have the size and scale to survive the bad markets and economic cycles. Therefore, investment in large caps is considered to be the safest of all equity mutual fund categories. However, one should always remember that the Underlying investment is equity and there are risks to it. While risks of large caps are relatively lower, the returns would also be steady and not exceptional returns during bull market phases. Investors who prefer moderate yet sustained returns with a certain degree of risk; can invest in the best large cap funds!
All efforts have been made to ensure the information provided here is accurate. However, no guarantees are made regarding correctness of data. Please verify with scheme information document before making any investment.


AMFI Registration No. 112358 | CIN: U74999MH2016PTC282153
Shepard Technologies Pvt. Ltd. (with ARN code 112358) makes no warranties or representations, express or implied, on products offered through the platform. It accepts no liability for any damages or losses, however caused, in connection with the use of, or on the reliance of its product or related services. Terms and conditions of the website are applicable.
©2025 Shepard Technologies Private Limited. All Rights Reserved
Superb. Gave very depth information.
Very good and give us about best largecap fund somtimes