Best Mid Cap Mutual Funds 2026
Mid-caps have become one of the most preferred investment categories for Indian investors who want higher growth than large-caps but lower Volatility than small-cap.

Many mid-cap companies today were once tiny challengers — and a few years down the line, they often become India’s next large-cap or even giant-cap players. That’s exactly why mid cap funds attract investors with a long-term mindset.
Mid-caps = companies with strong fundamentals + high growth potential + ability to scale fast. When these firms are led by capable management and agile strategies, they often turn into tomorrow’s market leaders.
Institutional investors like Mutual Funds, pension funds, and FIIs actively chase mid-caps because this segment offers the perfect blend of growth + innovation + long-term wealth creation.
Why Should you Invest in Mid Cap Funds
Here’s why mid-cap funds deserve a spot in your long-term Portfolio -
1. Higher Wealth-Creation Potential
Historically, mid-cap funds have outperformed large-caps over long-term horizons (7–10 years+). Their ability to scale from mid-sized to large-sized companies is a powerful growth trigger.
2. Strike the Balance Between Stability & Growth
Mid-caps offer more stability than small-caps yet significantly better growth potential than large-caps.
3. Faster Response to Market & Innovation Cycles
Because mid-cap companies are more focused and nimble, they adapt quickly to:
- ✔ new business trends
- ✔ technology shifts
- ✔ customer behaviour changes
4. Better Performance in Bull Markets
When markets rally for long, mid-caps often lead the show — making them a strong cyclical bet.
5. Attractive Option for Long-Term Investors
Given enough time (5–7+ years), mid-caps have historically rewarded disciplined SIP investors with exceptional returns.
Talk to our investment specialist
Advantages of Midcap funds
Mid-cap funds continue to perform well because:
- They remain under-researched compared to large-caps, creating pricing inefficiencies.
- Skilled fund managers can unlock hidden value by identifying strong businesses early.
- India’s economic cycle and digital growth create opportunities for mid-sized companies to scale dramatically.
- Many of India’s fastest-growing sectors — manufacturing, EVs, digital services, specialty chemicals, consumer brands — are dominated by mid-caps.
This makes mid-cap funds a strong long-term investment category.
Fund Selection Methodology used to find 11 funds
Top 11 Best Mid Cap Mutual Funds to Invest in FY 26 - 27
Fund NAV Net Assets (Cr) 3 MO (%) 6 MO (%) 1 YR (%) 3 YR (%) 5 YR (%) 2024 (%) Motilal Oswal Midcap 30 Fund Growth ₹99.4368
↑ 0.90 ₹37,474 8.6 7.5 -1.6 19 22 -12.1 Invesco India Mid Cap Fund Growth ₹197.63
↓ -0.08 ₹13,767 9.5 14.7 10.3 24.4 19.6 6.3 Edelweiss Mid Cap Fund Growth ₹108.04
↑ 0.22 ₹17,748 4 6.3 8.9 21.7 18.2 3.8 Sundaram Mid Cap Fund Growth ₹1,495.67
↑ 3.40 ₹14,026 4.6 8.2 9.7 20.4 18 4.1 ICICI Prudential MidCap Fund Growth ₹333.24
↓ -2.02 ₹7,846 0.7 8.3 12.7 21.6 17.2 11.1 TATA Mid Cap Growth Fund Growth ₹460.582
↓ -1.29 ₹5,868 3.6 6 7.3 16.3 15.5 5.8 BNP Paribas Mid Cap Fund Growth ₹110.927
↓ -0.09 ₹2,513 3.2 8.2 11.5 17.8 14.9 2.5 Aditya Birla Sun Life Midcap Fund Growth ₹839.06
↑ 0.13 ₹6,624 5.1 8.5 7.2 16.6 14.8 4.4 Franklin India Prima Fund Growth ₹2,818.41
↑ 11.03 ₹12,490 5.1 5.5 2.9 17 14.7 1.6 SBI Magnum Mid Cap Fund Growth ₹242.623
↓ -0.75 ₹24,127 2.9 6.8 5.1 12.2 14.5 0.4 Axis Mid Cap Fund Growth ₹119.87
↓ -0.22 ₹33,803 3.9 9.3 7.2 16.6 13.8 1 Note: Returns up to 1 year are on absolute basis & more than 1 year are on CAGR basis. as on 28 Jul 26 Research Highlights & Commentary of 11 Funds showcased
Commentary Motilal Oswal Midcap 30 Fund Invesco India Mid Cap Fund Edelweiss Mid Cap Fund Sundaram Mid Cap Fund ICICI Prudential MidCap Fund TATA Mid Cap Growth Fund BNP Paribas Mid Cap Fund Aditya Birla Sun Life Midcap Fund Franklin India Prima Fund SBI Magnum Mid Cap Fund Axis Mid Cap Fund Point 1 Highest AUM (₹37,474 Cr). Lower mid AUM (₹13,767 Cr). Upper mid AUM (₹17,748 Cr). Upper mid AUM (₹14,026 Cr). Lower mid AUM (₹7,846 Cr). Bottom quartile AUM (₹5,868 Cr). Bottom quartile AUM (₹2,513 Cr). Bottom quartile AUM (₹6,624 Cr). Lower mid AUM (₹12,490 Cr). Upper mid AUM (₹24,127 Cr). Top quartile AUM (₹33,803 Cr). Point 2 Established history (12+ yrs). Established history (19+ yrs). Established history (18+ yrs). Established history (24+ yrs). Established history (21+ yrs). Oldest track record among peers (32 yrs). Established history (20+ yrs). Established history (23+ yrs). Established history (32+ yrs). Established history (21+ yrs). Established history (15+ yrs). Point 3 Rating: 3★ (top quartile). Rating: 2★ (bottom quartile). Rating: 3★ (upper mid). Top rated. Rating: 2★ (lower mid). Rating: 2★ (bottom quartile). Rating: 3★ (upper mid). Rating: 3★ (upper mid). Rating: 3★ (lower mid). Rating: 3★ (lower mid). Rating: 1★ (bottom quartile). Point 4 Risk profile: Moderately High. Risk profile: Moderately High. Risk profile: High. Risk profile: Moderately High. Risk profile: Moderately High. Risk profile: Moderately High. Risk profile: High. Risk profile: Moderately High. Risk profile: Moderately High. Risk profile: Moderately High. Risk profile: Moderately High. Point 5 5Y return: 21.96% (top quartile). 5Y return: 19.56% (top quartile). 5Y return: 18.23% (upper mid). 5Y return: 18.02% (upper mid). 5Y return: 17.19% (upper mid). 5Y return: 15.50% (lower mid). 5Y return: 14.90% (lower mid). 5Y return: 14.77% (lower mid). 5Y return: 14.73% (bottom quartile). 5Y return: 14.52% (bottom quartile). 5Y return: 13.82% (bottom quartile). Point 6 3Y return: 18.99% (upper mid). 3Y return: 24.43% (top quartile). 3Y return: 21.69% (top quartile). 3Y return: 20.43% (upper mid). 3Y return: 21.61% (upper mid). 3Y return: 16.28% (bottom quartile). 3Y return: 17.80% (lower mid). 3Y return: 16.56% (bottom quartile). 3Y return: 16.99% (lower mid). 3Y return: 12.20% (bottom quartile). 3Y return: 16.65% (lower mid). Point 7 1Y return: -1.58% (bottom quartile). 1Y return: 10.34% (upper mid). 1Y return: 8.91% (upper mid). 1Y return: 9.74% (upper mid). 1Y return: 12.71% (top quartile). 1Y return: 7.30% (lower mid). 1Y return: 11.50% (top quartile). 1Y return: 7.23% (lower mid). 1Y return: 2.93% (bottom quartile). 1Y return: 5.14% (bottom quartile). 1Y return: 7.15% (lower mid). Point 8 Alpha: -14.72 (bottom quartile). Alpha: 0.00 (upper mid). Alpha: -1.09 (lower mid). Alpha: 0.71 (upper mid). Alpha: 6.02 (top quartile). Alpha: -0.52 (lower mid). Alpha: 3.32 (top quartile). Alpha: -0.17 (lower mid). Alpha: -6.86 (bottom quartile). Alpha: -3.96 (bottom quartile). Alpha: 0.00 (upper mid). Point 9 Sharpe: -0.71 (bottom quartile). Sharpe: 0.19 (upper mid). Sharpe: -0.04 (lower mid). Sharpe: 0.06 (upper mid). Sharpe: 0.32 (top quartile). Sharpe: -0.01 (lower mid). Sharpe: 0.22 (top quartile). Sharpe: 0.01 (upper mid). Sharpe: -0.35 (bottom quartile). Sharpe: -0.18 (bottom quartile). Sharpe: -0.06 (lower mid). Point 10 Information ratio: -0.25 (lower mid). Information ratio: 0.00 (upper mid). Information ratio: 0.48 (top quartile). Information ratio: 0.32 (upper mid). Information ratio: 0.87 (top quartile). Information ratio: -0.66 (bottom quartile). Information ratio: -0.21 (lower mid). Information ratio: -0.44 (lower mid). Information ratio: -0.66 (bottom quartile). Information ratio: -1.40 (bottom quartile). Information ratio: 0.00 (upper mid). Motilal Oswal Midcap 30 Fund
Invesco India Mid Cap Fund
Edelweiss Mid Cap Fund
Sundaram Mid Cap Fund
ICICI Prudential MidCap Fund
TATA Mid Cap Growth Fund
BNP Paribas Mid Cap Fund
Aditya Birla Sun Life Midcap Fund
Franklin India Prima Fund
SBI Magnum Mid Cap Fund
Axis Mid Cap Fund
All the funds mentioned above are ideal, we are giving you detailed analysis of 5 funds.
(Erstwhile Motilal Oswal MOSt Focused Midcap 30 Fund) The investment objective of the Scheme is to achieve long term capital appreciation by investing in a maximum of 30 quality mid-cap companies having long-term competitive advantages and potential for growth. However, there can be no assurance or guarantee that the investment objective of the Scheme would be achieved. Below is the key information for Motilal Oswal Midcap 30 Fund Returns up to 1 year are on The Scheme seeks to provide long term capital appreciation by investing in a portfolio that is predominantly constituted of equity and equity related instruments of mid cap companies. However, there can be no assurance that the funds objectives will be achieved. Research Highlights for Invesco India Mid Cap Fund Below is the key information for Invesco India Mid Cap Fund Returns up to 1 year are on (Erstwhile Edelweiss Mid and Small Cap Fund ) The investment objective is to seek to generate long-term capital appreciation from a portfolio that predominantly invests in equity and equity-related securities of Mid Cap companies.
However, there can be no assurance that the investment objective of the Scheme will be realised. Research Highlights for Edelweiss Mid Cap Fund Below is the key information for Edelweiss Mid Cap Fund Returns up to 1 year are on (Erstwhile Sundaram Select Midcap Fund) To achieve capital appreciation by investing
in diversified stocks that are generally termed
as mid-caps. Research Highlights for Sundaram Mid Cap Fund Below is the key information for Sundaram Mid Cap Fund Returns up to 1 year are on To generate capital appreciation by actively investing in diversified mid cap stocks. Research Highlights for ICICI Prudential MidCap Fund Below is the key information for ICICI Prudential MidCap Fund Returns up to 1 year are on 1. Motilal Oswal Midcap 30 Fund
Motilal Oswal Midcap 30 Fund
Growth Launch Date 24 Feb 14 NAV (28 Jul 26) ₹99.4368 ↑ 0.90 (0.91 %) Net Assets (Cr) ₹37,474 on 30 Jun 26 Category Equity - Mid Cap AMC Motilal Oswal Asset Management Co. Ltd Rating ☆☆☆ Risk Moderately High Expense Ratio 1.56 Sharpe Ratio -0.71 Information Ratio -0.25 Alpha Ratio -14.72 Min Investment 5,000 Min SIP Investment 500 Exit Load 0-1 Years (1%),1 Years and above(NIL) Growth of 10,000 investment over the years.
Date Value 30 Jun 21 ₹10,000 30 Jun 22 ₹11,908 30 Jun 23 ₹16,418 30 Jun 24 ₹26,938 30 Jun 25 ₹29,503 30 Jun 26 ₹26,510 Returns for Motilal Oswal Midcap 30 Fund
absolute basis & more than 1 year are on CAGR (Compound Annual Growth Rate) basis. as on 28 Jul 26 Duration Returns 1 Month 5.9% 3 Month 8.6% 6 Month 7.5% 1 Year -1.6% 3 Year 19% 5 Year 22% 10 Year 15 Year Since launch 20.3% Historical performance (Yearly) on absolute basis
Year Returns 2024 -12.1% 2023 57.1% 2022 41.7% 2021 10.7% 2020 55.8% 2019 9.3% 2018 9.7% 2017 -12.7% 2016 30.8% 2015 5.2% Fund Manager information for Motilal Oswal Midcap 30 Fund
Name Since Tenure Varun Sharma 21 Jan 26 0.44 Yr. Swapnil Mayekar 18 Nov 25 0.62 Yr. Ajay Khandelwal 1 Oct 24 1.75 Yr. Ankit Agarwal 21 Jan 26 0.44 Yr. Rakesh Shetty 22 Nov 22 3.61 Yr. Data below for Motilal Oswal Midcap 30 Fund as on 30 Jun 26
Equity Sector Allocation
Sector Value Financial Services 31.02% Technology 26.84% Industrials 13.76% Consumer Cyclical 13.41% Communication Services 3.08% Real Estate 2.81% Health Care 2.46% Asset Allocation
Asset Class Value Cash 6.63% Equity 93.37% Top Securities Holdings / Portfolio
Name Holding Value Quantity One97 Communications Ltd (Technology)
Equity, Since 30 Sep 24 | PAYTM7% ₹2,659 Cr 23,765,865 Coforge Ltd (Technology)
Equity, Since 31 Mar 23 | COFORGE6% ₹2,233 Cr 15,703,312
↓ -979,603 Kalyan Jewellers India Ltd (Consumer Cyclical)
Equity, Since 29 Feb 24 | KALYANKJIL6% ₹2,180 Cr 61,413,395 KEI Industries Ltd (Industrials)
Equity, Since 30 Nov 24 | KEI6% ₹2,123 Cr 4,030,834 Eternal Ltd (Consumer Cyclical)
Equity, Since 31 Aug 25 | ETERNAL6% ₹2,115 Cr 84,386,866 Persistent Systems Ltd (Technology)
Equity, Since 31 Jan 23 | PERSISTENT6% ₹2,091 Cr 4,026,493 Aditya Birla Capital Ltd (Financial Services)
Equity, Since 30 Jun 25 | ABCAPITAL5% ₹1,906 Cr 52,459,381
↓ -1,000,000 Billionbrains Garage Ventures Ltd (Financial Services)
Equity, Since 31 Jan 26 | GROWW4% ₹1,564 Cr 84,616,660 Multi Commodity Exchange of India Ltd (Financial Services)
Equity, Since 31 Jan 26 | MCX4% ₹1,539 Cr 5,209,458 BSE Ltd (Financial Services)
Equity, Since 30 Nov 25 | BSE4% ₹1,451 Cr 3,500,830
↓ -256,232 2. Invesco India Mid Cap Fund
Invesco India Mid Cap Fund
Growth Launch Date 19 Apr 07 NAV (28 Jul 26) ₹197.63 ↓ -0.08 (-0.04 %) Net Assets (Cr) ₹13,767 on 30 Jun 26 Category Equity - Mid Cap AMC Invesco Asset Management (India) Private Ltd Rating ☆☆ Risk Moderately High Expense Ratio 1.82 Sharpe Ratio 0.19 Information Ratio 0 Alpha Ratio 0 Min Investment 5,000 Min SIP Investment 500 Exit Load 0-1 Years (1%),1 Years and above(NIL) Growth of 10,000 investment over the years.
Date Value 30 Jun 21 ₹10,000 30 Jun 22 ₹9,839 30 Jun 23 ₹12,879 30 Jun 24 ₹19,911 30 Jun 25 ₹23,355 30 Jun 26 ₹25,135 Returns for Invesco India Mid Cap Fund
absolute basis & more than 1 year are on CAGR (Compound Annual Growth Rate) basis. as on 28 Jul 26 Duration Returns 1 Month 2.1% 3 Month 9.5% 6 Month 14.7% 1 Year 10.3% 3 Year 24.4% 5 Year 19.6% 10 Year 15 Year Since launch 16.7% Historical performance (Yearly) on absolute basis
Year Returns 2024 6.3% 2023 43.1% 2022 34.1% 2021 0.5% 2020 43.1% 2019 24.4% 2018 3.8% 2017 -5.3% 2016 44.3% 2015 1.1% Fund Manager information for Invesco India Mid Cap Fund
Name Since Tenure Aditya Khemani 9 Nov 23 2.64 Yr. Data below for Invesco India Mid Cap Fund as on 30 Jun 26
Equity Sector Allocation
Sector Value Financial Services 30.63% Health Care 18.1% Consumer Cyclical 16.29% Industrials 15.05% Real Estate 8.55% Technology 4.13% Basic Materials 3.85% Utility 1.93% Asset Allocation
Asset Class Value Cash 1.46% Equity 98.54% Top Securities Holdings / Portfolio
Name Holding Value Quantity BSE Ltd (Financial Services)
Equity, Since 31 Dec 23 | BSE6% ₹750 Cr 1,809,521
↓ -89,716 Prestige Estates Projects Ltd (Real Estate)
Equity, Since 30 Nov 23 | PRESTIGE6% ₹725 Cr 5,296,606
↑ 150,291 The Federal Bank Ltd (Financial Services)
Equity, Since 31 Oct 22 | FEDERALBNK5% ₹644 Cr 22,304,132 AU Small Finance Bank Ltd (Financial Services)
Equity, Since 31 Jul 25 | AUBANK5% ₹585 Cr 5,936,790 Eternal Ltd (Consumer Cyclical)
Equity, Since 31 Aug 25 | ETERNAL4% ₹555 Cr 22,166,702
↑ 799,446 Global Health Ltd (Healthcare)
Equity, Since 30 Nov 23 | MEDANTA4% ₹544 Cr 4,577,395 InterGlobe Aviation Ltd (Industrials)
Equity, Since 30 Apr 24 | INDIGO4% ₹523 Cr 1,186,438
↑ 53,285 Max Healthcare Institute Ltd Ordinary Shares (Healthcare)
Equity, Since 31 Dec 22 | MAXHEALTH4% ₹506 Cr 5,241,044 L&T Finance Ltd (Financial Services)
Equity, Since 31 Dec 23 | LTF4% ₹483 Cr 16,854,973 IndusInd Bank Ltd (Financial Services)
Equity, Since 31 Jan 26 | INDUSINDBK4% ₹472 Cr 5,164,015 3. Edelweiss Mid Cap Fund
Edelweiss Mid Cap Fund
Growth Launch Date 26 Dec 07 NAV (28 Jul 26) ₹108.04 ↑ 0.22 (0.20 %) Net Assets (Cr) ₹17,748 on 30 Jun 26 Category Equity - Mid Cap AMC Edelweiss Asset Management Limited Rating ☆☆☆ Risk High Expense Ratio 1.75 Sharpe Ratio -0.04 Information Ratio 0.48 Alpha Ratio -1.09 Min Investment 5,000 Min SIP Investment 500 Exit Load 0-12 Months (1%),12 Months and above(NIL) Growth of 10,000 investment over the years.
Date Value 30 Jun 21 ₹10,000 30 Jun 22 ₹9,936 30 Jun 23 ₹12,970 30 Jun 24 ₹20,548 30 Jun 25 ₹22,969 30 Jun 26 ₹23,735 Returns for Edelweiss Mid Cap Fund
absolute basis & more than 1 year are on CAGR (Compound Annual Growth Rate) basis. as on 28 Jul 26 Duration Returns 1 Month 1.4% 3 Month 4% 6 Month 6.3% 1 Year 8.9% 3 Year 21.7% 5 Year 18.2% 10 Year 15 Year Since launch 13.7% Historical performance (Yearly) on absolute basis
Year Returns 2024 3.8% 2023 38.9% 2022 38.4% 2021 2.4% 2020 50.3% 2019 26.4% 2018 5.2% 2017 -15.7% 2016 52.3% 2015 2.5% Fund Manager information for Edelweiss Mid Cap Fund
Name Since Tenure Dhruv Bhatia 14 Oct 24 1.71 Yr. Trideep Bhattacharya 1 Oct 21 4.75 Yr. Raj Koradia 1 Aug 24 1.91 Yr. Data below for Edelweiss Mid Cap Fund as on 30 Jun 26
Equity Sector Allocation
Sector Value Financial Services 27.76% Industrials 16.13% Consumer Cyclical 11.71% Basic Materials 10.96% Health Care 8.98% Technology 5.53% Consumer Defensive 4.76% Utility 3.24% Communication Services 3.08% Real Estate 2.12% Energy 1.79% Asset Allocation
Asset Class Value Cash 3.94% Equity 96.06% Top Securities Holdings / Portfolio
Name Holding Value Quantity Multi Commodity Exchange of India Ltd (Financial Services)
Equity, Since 30 Apr 24 | MCX3% ₹511 Cr 1,730,477
↑ 43,058 BSE Ltd (Financial Services)
Equity, Since 31 Mar 24 | BSE3% ₹496 Cr 1,196,328
↑ 36,706 The Federal Bank Ltd (Financial Services)
Equity, Since 31 Dec 18 | FEDERALBNK3% ₹488 Cr 16,902,169
↑ 912,401 Fortis Healthcare Ltd (Healthcare)
Equity, Since 30 Sep 23 | FORTIS2% ₹376 Cr 4,052,573
↑ 470,404 Marico Ltd (Consumer Defensive)
Equity, Since 31 Oct 24 | MARICO2% ₹374 Cr 4,556,846
↑ 139,814 Solar Industries India Ltd (Basic Materials)
Equity, Since 30 Sep 12 | SOLARINDS2% ₹361 Cr 197,647
↑ 6,064 Bharat Heavy Electricals Ltd (Industrials)
Equity, Since 31 Mar 26 | BHEL2% ₹337 Cr 8,077,656
↑ 247,841 JSW Energy Ltd (Utilities)
Equity, Since 30 Apr 26 | JSWENERGY2% ₹321 Cr 5,395,645
↑ 2,490,497 Indian Bank (Financial Services)
Equity, Since 31 Jan 21 | INDIANB2% ₹278 Cr 3,338,157
↑ 102,422 Coforge Ltd (Technology)
Equity, Since 30 Jun 23 | COFORGE2% ₹275 Cr 1,937,427 4. Sundaram Mid Cap Fund
Sundaram Mid Cap Fund
Growth Launch Date 30 Jul 02 NAV (28 Jul 26) ₹1,495.67 ↑ 3.40 (0.23 %) Net Assets (Cr) ₹14,026 on 30 Jun 26 Category Equity - Mid Cap AMC Sundaram Asset Management Company Ltd Rating ☆☆☆☆ Risk Moderately High Expense Ratio 1.75 Sharpe Ratio 0.06 Information Ratio 0.32 Alpha Ratio 0.71 Min Investment 5,000 Min SIP Investment 100 Exit Load 0-12 Months (1%),12 Months and above(NIL) Growth of 10,000 investment over the years.
Date Value 30 Jun 21 ₹10,000 30 Jun 22 ₹9,952 30 Jun 23 ₹12,988 30 Jun 24 ₹20,155 30 Jun 25 ₹21,973 30 Jun 26 ₹23,117 Returns for Sundaram Mid Cap Fund
absolute basis & more than 1 year are on CAGR (Compound Annual Growth Rate) basis. as on 28 Jul 26 Duration Returns 1 Month 2% 3 Month 4.6% 6 Month 8.2% 1 Year 9.7% 3 Year 20.4% 5 Year 18% 10 Year 15 Year Since launch 23.2% Historical performance (Yearly) on absolute basis
Year Returns 2024 4.1% 2023 32% 2022 40.4% 2021 4.8% 2020 37.5% 2019 11.8% 2018 -0.3% 2017 -15.4% 2016 40.8% 2015 11.3% Fund Manager information for Sundaram Mid Cap Fund
Name Since Tenure S. Bharath 24 Feb 21 5.35 Yr. Shalav Saket 31 Dec 25 0.5 Yr. Data below for Sundaram Mid Cap Fund as on 30 Jun 26
Equity Sector Allocation
Sector Value Financial Services 21.92% Industrials 19.24% Consumer Cyclical 14.17% Health Care 9.9% Basic Materials 8.55% Technology 8.5% Consumer Defensive 5.02% Real Estate 3.11% Utility 3.02% Communication Services 1.96% Energy 1.38% Asset Allocation
Asset Class Value Cash 3.22% Equity 96.76% Other 0% Top Securities Holdings / Portfolio
Name Holding Value Quantity GE Vernova T&D India Ltd (Industrials)
Equity, Since 30 Sep 24 | GVT&D3% ₹463 Cr 900,000
↓ -100,000 Cummins India Ltd (Industrials)
Equity, Since 31 Dec 17 | CUMMINSIND3% ₹441 Cr 750,000
↓ -100,000 BSE Ltd (Financial Services)
Equity, Since 31 May 24 | BSE3% ₹392 Cr 945,165 Mahindra & Mahindra Financial Services Ltd (Financial Services)
Equity, Since 31 Jan 24 | M&MFIN3% ₹349 Cr 11,498,475 Max Financial Services Ltd (Financial Services)
Equity, Since 30 Jun 16 | MFSL2% ₹302 Cr 1,805,000
↑ 130,000 The Federal Bank Ltd (Financial Services)
Equity, Since 31 Dec 18 | FEDERALBNK2% ₹300 Cr 10,399,688 Coromandel International Ltd (Basic Materials)
Equity, Since 30 Nov 10 | COROMANDEL2% ₹288 Cr 1,642,029 Suzlon Energy Ltd (Industrials)
Equity, Since 31 Jul 24 | SUZLON2% ₹287 Cr 50,302,475
↑ 11,730,000 IDFC First Bank Ltd (Financial Services)
Equity, Since 30 Jun 25 | IDFCFIRSTB2% ₹273 Cr 38,278,844 Marico Ltd (Consumer Defensive)
Equity, Since 30 Jun 24 | MARICO2% ₹271 Cr 3,300,000
↓ -95,879 5. ICICI Prudential MidCap Fund
ICICI Prudential MidCap Fund
Growth Launch Date 28 Oct 04 NAV (28 Jul 26) ₹333.24 ↓ -2.02 (-0.60 %) Net Assets (Cr) ₹7,846 on 30 Jun 26 Category Equity - Mid Cap AMC ICICI Prudential Asset Management Company Limited Rating ☆☆ Risk Moderately High Expense Ratio 1.88 Sharpe Ratio 0.32 Information Ratio 0.87 Alpha Ratio 6.02 Min Investment 5,000 Min SIP Investment 100 Exit Load 0-1 Years (1%),1 Years and above(NIL) Growth of 10,000 investment over the years.
Date Value 30 Jun 21 ₹10,000 30 Jun 22 ₹9,945 30 Jun 23 ₹12,113 30 Jun 24 ₹19,582 30 Jun 25 ₹20,792 30 Jun 26 ₹22,997 Returns for ICICI Prudential MidCap Fund
absolute basis & more than 1 year are on CAGR (Compound Annual Growth Rate) basis. as on 28 Jul 26 Duration Returns 1 Month -1.6% 3 Month 0.7% 6 Month 8.3% 1 Year 12.7% 3 Year 21.6% 5 Year 17.2% 10 Year 15 Year Since launch 17.5% Historical performance (Yearly) on absolute basis
Year Returns 2024 11.1% 2023 27% 2022 32.8% 2021 3.1% 2020 44.8% 2019 19.1% 2018 -0.6% 2017 -10.8% 2016 42.9% 2015 4.8% Fund Manager information for ICICI Prudential MidCap Fund
Name Since Tenure Lalit Kumar 1 Jul 22 4 Yr. Sharmila D’mello 31 Jul 22 3.92 Yr. Data below for ICICI Prudential MidCap Fund as on 30 Jun 26
Equity Sector Allocation
Sector Value Industrials 24.42% Basic Materials 23.1% Financial Services 22.87% Consumer Cyclical 12.8% Real Estate 5.16% Energy 3.68% Health Care 1.75% Communication Services 1.44% Technology 1.09% Utility 0.02% Asset Allocation
Asset Class Value Cash 2.09% Equity 97.91% Top Securities Holdings / Portfolio
Name Holding Value Quantity BSE Ltd (Financial Services)
Equity, Since 30 Apr 24 | BSE5% ₹420 Cr 1,011,840 Multi Commodity Exchange of India Ltd (Financial Services)
Equity, Since 30 Apr 24 | MCX5% ₹366 Cr 1,239,860 Apar Industries Ltd (Industrials)
Equity, Since 31 Jan 25 | APARINDS5% ₹359 Cr 273,711
↑ 10,000 Jindal Steel Ltd (Basic Materials)
Equity, Since 31 Jan 22 | JINDALSTEL4% ₹336 Cr 2,786,470 Hindustan Petroleum Corp Ltd (Energy)
Equity, Since 31 Mar 26 | HINDPETRO4% ₹287 Cr 7,283,739
↑ 950,000 Muthoot Finance Ltd (Financial Services)
Equity, Since 30 Nov 23 | MUTHOOTFIN4% ₹276 Cr 824,501 APL Apollo Tubes Ltd (Basic Materials)
Equity, Since 30 Sep 22 | APLAPOLLO3% ₹263 Cr 1,437,425
↑ 12,229 PB Fintech Ltd (Financial Services)
Equity, Since 31 May 24 | 5433903% ₹240 Cr 1,408,585 KEI Industries Ltd (Industrials)
Equity, Since 30 Apr 24 | KEI3% ₹230 Cr 437,075
↑ 18,483 Bharat Forge Ltd (Consumer Cyclical)
Equity, Since 31 May 23 | BHARATFORG3% ₹230 Cr 1,174,895
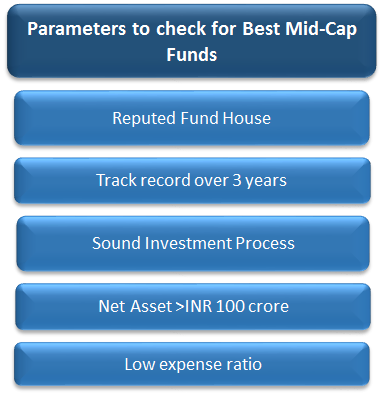
Parameters to Look at While Choosing Mid-Cap Funds
Choosing a mid-cap fund should involve both data-based analysis and qualitative assessment -
Quantitative Factors
Higher AUM
A healthy AUM indicates investor confidence and ensures the fund can manage buy/sell flows without impacting performance. Funds with very small AUM may face liquidity issues during volatile markets.
Minimum 5+ year track record
A fund with at least 5 years of history shows how it performed across different market cycles. This helps you judge whether the fund can deliver consistent returns, not just short-term spikes.
Consistent 3-year, 5-year, and 7-year performance
Look for funds that perform well across all periods, not just one good year. Steady returns over longer horizons indicate strong stock selection and a robust strategy.
Low-to-reasonable expense ratio
A lower expense ratio means more of your returns stay with you. However, don’t choose funds only on cost — a slightly higher fee is fine if the performance is stronger.
Portfolio allocation: 65–75% in mid-caps
A true mid-cap fund should hold the majority of its portfolio in mid-cap stocks. This ensures the fund aligns with the risk–reward profile you expect from this category.
Rolling returns & downside protection data
Rolling returns reveal how the fund performed at different entry points, giving a truer picture than point-to-point returns. Downside protection shows how well the fund manages losses during market corrections.
Volatility metrics: Standard deviation, Sharpe ratio
Lower standard deviation means smoother performance, while a higher Sharpe ratio means better risk-adjusted returns. Together, these metrics help you judge stability and efficiency.
Qualitative Factors
Strong fund manager reputation
The fund manager’s experience, track record, and decision-making style directly influence performance. A skilled manager can identify strong mid-cap opportunities early.
Stable and disciplined investment process
Funds with a clear, consistent process avoid emotional or trend-based Investing. A disciplined approach helps maintain long-term performance even during market noise.
Fund house’s track record in equity investing
Choose fund houses known for strong research teams and a history of delivering top-performing Equity Funds. A strong AMC usually follows better governance and risk management.
Consistency of performance across market cycles
The best funds don’t just shine in bull markets — they also protect capital during downturns. Look for schemes that perform steadily across rising, falling, and sideways markets.
Pro Tip - Always check rolling returns instead of point-to-point returns. Rolling returns show how a fund performed across different time frames and market cycles.
How Invest in Mid Cap Funds Online?
Open Free Investment Account for Lifetime at Fincash.com.
Complete your Registration and KYC Process
Upload Documents (PAN, Aadhaar, etc.). And, You are Ready to Invest!
Conclusion
Mid-cap mutual funds are a powerful wealth-creation tool for long-term investors. They offer faster growth potential than large-caps and more stability than small-caps — making them an ideal choice for investors who can stay invested for 5–7+ years.
While the rewards are high, mid-caps also come with volatility. So keep your allocation balanced, diversify across categories, and invest through SIPs to smooth out market fluctuations. In the long run, the right mid-cap fund can significantly accelerate your journey toward financial freedom.
FAQs
1. Are mid cap mutual funds good for long-term investment?
A: Yes. Mid-cap funds are ideal for long-term (5–7+ years) investors seeking higher growth than large-caps.
2. How risky are mid cap mutual funds?
A: They carry medium-to-high risk. Mid-caps are more volatile than large-caps but more stable than small-caps.
3. Can beginners invest in mid cap funds?
A: Beginners can invest through SIPs, which reduce volatility and average out market fluctuations.
4. Which is better: mid cap or small cap mutual funds?
A: Mid-caps offer a balance of risk + growth, while small-caps are higher risk but higher potential. Mid-caps suit more investors.
All efforts have been made to ensure the information provided here is accurate. However, no guarantees are made regarding correctness of data. Please verify with scheme information document before making any investment.
You Might Also Like


AMFI Registration No. 112358 | CIN: U74999MH2016PTC282153
Shepard Technologies Pvt. Ltd. (with ARN code 112358) makes no warranties or representations, express or implied, on products offered through the platform. It accepts no liability for any damages or losses, however caused, in connection with the use of, or on the reliance of its product or related services. Terms and conditions of the website are applicable.
©2026 Shepard Technologies Private Limited. All Rights Reserved
Research Highlights for Motilal Oswal Midcap 30 Fund