Large Cap Mutual Funds
Large cap Mutual Funds are a type of equity where funds are invested in a large portion with companies of large market capitalization. These are essentially large companies with large businesses and big teams. Large cap stocks are commonly referred as blue chip stocks. One essential fact about the large cap is that information regarding such big companies is easily available in publications (magazine/newspaper).
Large cap mutual funds invest in those firms that have more possibility of showing year on year steady growth and high profits, which in turns also offers stability over a time. These stocks give steady returns over a long period of time. These are shares of well-established companies that have a strong hold on the market and are usually considered as safe investments.
Large cap funds are considered to be safe, have good returns and are less volatile to the market fluctuations compared to other Equity Funds (mid and Small cap funds). Hence, investors are more keen to invest their funds in large-cap even though the share price of blue chip companies are high.
Why Invest in Large Cap Equity Funds?
- Large companies are well-established which means that they have more consistent income. That is why the greatest benefits that add up to large cap stocks is the stability they can provide.
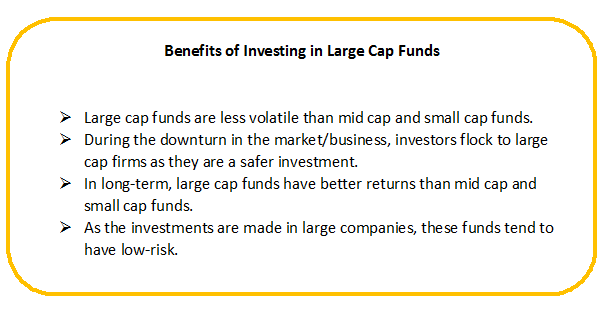
- Large cap mutual funds are less volatile than mid cap and small cap funds.
- As the investments are made in large companies, these funds tend to have low risks.
- In long-term, large cap funds have better returns than mid cap and small cap funds.
- During the downturn in the market/business, investors flock to large cap firms as they are a safer investment.
- Since large-cap companies have a long run business, data/details about such companies are readily available, which becomes easy to provide it to shareholders and investors. This also makes an easy way to determine whether a company is worth the investment.
Talk to our investment specialist
Large Cap Companies
Large cap funds are invested in companies that have a Market Capitalization (MC= no of shares issued by the company X market price per share) of more than INR 1000 Crore. These companies are well-established in the India market and are leading players in their respective industry sectors. Furthermore, they have a strong track record of paying dividends regularly. Most of the blue-chip companies are listed on the BSE (Bombay Stock Exchange) 100 index. Infosys, Wipro, Unilever, Reliance Industries, ITC, SBI, ICICI, L&T, Birla, etc., are some of the large cap companies in India.
Difference Between Large Cap Funds, Mid Cap Funds and Small Cap Funds
In order to make a better investment decision in equity funds, one should understand the fundamental differences between its types, i.e.- large-, mid-, and small-cap funds. Hence, discussed below-
Investments
Large cap invests in those companies that have the potential of showing year on year steady growth with high profits. mid cap funds invest in mid-sized companies. Investors who invest in mid-cap usually prefer those companies that are future’s runaway success. Whereas, small cap companies are generally younger companies or startups that have a lot of scopes to grow.
Market Capitalization
Large cap companies have a market capitalization of more than INR 1000 crore, while mid caps could be companies with a market cap of INR 500 Cr to INR 1000 Cr, and a market cap of the small cap could be less than INR 500 Cr.
Companies
Infosys, Unilever, Reliance Industries, Birla, etc., are a few well-known large cap companies in India. Some of the most emerging, i.e. mid-cap companies in India are Bata India Ltd, City Union Bank, PC Jeweller Ltd, etc. And some of the well-known small-cap companies in India are Indiabulls, Indian Overseas Bank, Just Dial, etc.
Risks
Mid cap and small cap funds are more volatile than large-cap funds. Large cap mutual funds tend to outperform both mid and small cap funds during the bull market.
Who Should Invest in Large Cap Mutual Funds?
Investors who are looking for a long-term capital appreciation can find large cap funds to be the ideal option for investment. Since blue chip companies are financially strong these funds tend to give stable returns over other equity funds. The return on large cap mutual funds may be moderately low, but they are more likely to be consistent in performance.
When an investor invests in these funds, the chances of their corpus to get eroded is very low compared to other equity mutual funds. Furthermore, large cap companies can withstand the economic crises and can recover faster. Thus, investors who are looking for an investment with moderate returns and low risks can consider large cap mutual funds as one of the best investment avenues.
Smart Tips to Invest in Large Cap Funds
It is always important to know about the fund that you are going to invest in. When investing in Mutual Funds, especially in risky funds like Large-cap funds, investors need to take into account some of the key parameters like-
1. Know the Fund Manager
The fund manager is responsible for all making investment decisions of the fund’s Portfolio. So it is important to review the performance of the fund manager over the years, especially in the tough market phase. A fund manager with the most consistent in his performance should be the preferred choice.
2. Know the Expense Ratio
The expense ratio is the chargers like management fees, operation chargers, etc., charged by the Fund Houses by the investors. Some fund houses may charge a higher fee, while some may low. However, the expense ratio is something that should not supersede other important factors such as fund performance etc.
3. Check the Past Performance
Before Investing, an investor needs to make a fair assessment of the funds' performances that they wish to invest in. A fund that consistently beats its benchmark for over 4-5 year is the one to go with.
4. Fund House Reputation
The quality and the reputation of the fund house matters a lot. Investors should check if the AMC has a long-standing record, large Assets Under Management (AUM), stared funds. A fund house should have a strong presence in the financial industry with a consistent track record.
Taxation of Large Cap Funds
The short-term and long-term Capital Gains offered by mutual funds are taxed at different rates.
| Fund Type | Short-Term Capital Gains | Long-Term Capital Gains |
|---|---|---|
| Equity funds | 15% + cess + surcharge | Up to Rs. 1 lakh a year is tax-exempt. Any gains above Rs. 1 lakh are taxed at 10% + cess + surcharge |
How to Invest in Large Cap Funds Online?
Open Free Investment Account for Lifetime at Fincash.com.
Complete your Registration and KYC Process
Upload Documents (PAN, Aadhaar, etc.). And, You are Ready to Invest!
Fund Selection Methodology used to find 10 funds
Best Large Cap Equity Funds 2026
Some of the Best Large Cap Funds to invest in India are as follows-
Fund NAV Net Assets (Cr) 3 MO (%) 6 MO (%) 1 YR (%) 3 YR (%) 5 YR (%) 2025 (%) IDBI India Top 100 Equity Fund Growth ₹44.16
↑ 0.05 ₹655 9.2 12.5 15.4 21.9 12.6 JM Core 11 Fund Growth ₹20.0693
↓ -0.05 ₹286 4.7 4 2.8 13.1 13.9 -1.9 Invesco India Largecap Fund Growth ₹71.75
↓ -0.04 ₹1,847 4.2 4.4 3.3 12.9 12.4 5.5 ICICI Prudential Bluechip Fund Growth ₹108.81
↓ -0.39 ₹79,421 -0.2 -2.4 -1 11.9 13.5 11.3 Nippon India Large Cap Fund Growth ₹90.0981
↓ -0.43 ₹53,227 0.2 -0.4 -0.4 11.9 15.4 9.2 Bandhan Large Cap Fund Growth ₹78.054
↓ -0.20 ₹2,061 1.8 0.6 1.6 11.7 12 8.2 DSP TOP 100 Equity Growth ₹459.134
↓ -2.26 ₹7,190 0.3 -3 -3.4 11.4 10.7 8.4 BNP Paribas Large Cap Fund Growth ₹219.926
↑ 0.38 ₹2,571 0.9 0.3 -0.5 11.2 11.7 4.4 TATA Large Cap Fund Growth ₹514.398
↓ -1.05 ₹2,721 2.5 1.2 2.7 10.6 11.4 9.2 JM Large Cap Fund Growth ₹152.773
↑ 0.02 ₹409 1.4 -0.2 0 10.4 11.5 3.8 Note: Returns up to 1 year are on absolute basis & more than 1 year are on CAGR basis. as on 28 Jul 23 Research Highlights & Commentary of 10 Funds showcased
Commentary IDBI India Top 100 Equity Fund JM Core 11 Fund Invesco India Largecap Fund ICICI Prudential Bluechip Fund Nippon India Large Cap Fund Bandhan Large Cap Fund DSP TOP 100 Equity BNP Paribas Large Cap Fund TATA Large Cap Fund JM Large Cap Fund Point 1 Bottom quartile AUM (₹655 Cr). Bottom quartile AUM (₹286 Cr). Lower mid AUM (₹1,847 Cr). Highest AUM (₹79,421 Cr). Top quartile AUM (₹53,227 Cr). Lower mid AUM (₹2,061 Cr). Upper mid AUM (₹7,190 Cr). Upper mid AUM (₹2,571 Cr). Upper mid AUM (₹2,721 Cr). Bottom quartile AUM (₹409 Cr). Point 2 Established history (14+ yrs). Established history (18+ yrs). Established history (16+ yrs). Established history (18+ yrs). Established history (18+ yrs). Established history (20+ yrs). Established history (23+ yrs). Established history (21+ yrs). Established history (28+ yrs). Oldest track record among peers (31 yrs). Point 3 Rating: 3★ (upper mid). Top rated. Rating: 3★ (upper mid). Rating: 4★ (top quartile). Rating: 4★ (upper mid). Rating: 2★ (bottom quartile). Rating: 2★ (bottom quartile). Rating: 3★ (lower mid). Rating: 3★ (lower mid). Rating: 2★ (bottom quartile). Point 4 Risk profile: Moderately High. Risk profile: High. Risk profile: Moderately High. Risk profile: Moderately High. Risk profile: Moderately High. Risk profile: Moderately High. Risk profile: Moderately High. Risk profile: Moderately High. Risk profile: Moderately High. Risk profile: Moderately High. Point 5 5Y return: 12.61% (upper mid). 5Y return: 13.90% (top quartile). 5Y return: 12.40% (upper mid). 5Y return: 13.51% (upper mid). 5Y return: 15.38% (top quartile). 5Y return: 11.97% (lower mid). 5Y return: 10.71% (bottom quartile). 5Y return: 11.73% (lower mid). 5Y return: 11.41% (bottom quartile). 5Y return: 11.49% (bottom quartile). Point 6 3Y return: 21.88% (top quartile). 3Y return: 13.11% (top quartile). 3Y return: 12.87% (upper mid). 3Y return: 11.94% (upper mid). 3Y return: 11.88% (upper mid). 3Y return: 11.67% (lower mid). 3Y return: 11.45% (lower mid). 3Y return: 11.17% (bottom quartile). 3Y return: 10.63% (bottom quartile). 3Y return: 10.36% (bottom quartile). Point 7 1Y return: 15.39% (top quartile). 1Y return: 2.84% (upper mid). 1Y return: 3.34% (top quartile). 1Y return: -0.97% (bottom quartile). 1Y return: -0.42% (lower mid). 1Y return: 1.64% (upper mid). 1Y return: -3.40% (bottom quartile). 1Y return: -0.46% (bottom quartile). 1Y return: 2.67% (upper mid). 1Y return: -0.05% (lower mid). Point 8 Alpha: 2.11 (upper mid). Alpha: 2.17 (upper mid). Alpha: 3.75 (top quartile). Alpha: -1.21 (bottom quartile). Alpha: 1.07 (lower mid). Alpha: 2.34 (upper mid). Alpha: -2.70 (bottom quartile). Alpha: -0.07 (bottom quartile). Alpha: 3.00 (top quartile). Alpha: 0.20 (lower mid). Point 9 Sharpe: 1.09 (top quartile). Sharpe: -0.23 (top quartile). Sharpe: -0.25 (upper mid). Sharpe: -0.55 (bottom quartile). Sharpe: -0.43 (lower mid). Sharpe: -0.35 (upper mid). Sharpe: -0.68 (bottom quartile). Sharpe: -0.47 (lower mid). Sharpe: -0.30 (upper mid). Sharpe: -0.48 (bottom quartile). Point 10 Information ratio: 0.14 (bottom quartile). Information ratio: 0.15 (bottom quartile). Information ratio: 0.82 (upper mid). Information ratio: 0.85 (top quartile). Information ratio: 0.98 (top quartile). Information ratio: 0.63 (upper mid). Information ratio: 0.53 (upper mid). Information ratio: 0.51 (lower mid). Information ratio: 0.27 (lower mid). Information ratio: 0.15 (bottom quartile). IDBI India Top 100 Equity Fund
JM Core 11 Fund
Invesco India Largecap Fund
ICICI Prudential Bluechip Fund
Nippon India Large Cap Fund
Bandhan Large Cap Fund
DSP TOP 100 Equity
BNP Paribas Large Cap Fund
TATA Large Cap Fund
JM Large Cap Fund
*Above is list of best Large Cap funds having AUM/Net Assets above 100 Crore. Sorted on Last 3 Year Return.
The Investment objective of the Scheme is to provide investors with the opportunities for long-term capital appreciation by investing predominantly in Equity and Equity related Instruments of Large Cap companies. However
there can be no assurance that the investment objective under the Scheme will be realized. Below is the key information for IDBI India Top 100 Equity Fund Returns up to 1 year are on The investment objective of the Scheme is to provide long-term growth by investing predominantly in a concentrated portfolio of equity / equity related instruments of companies. Research Highlights for JM Core 11 Fund Below is the key information for JM Core 11 Fund Returns up to 1 year are on (Erstwhile Invesco India Business Leaders Fund) To generate long term capital appreciation by investing in equity and equity related instruments including equity derivatives of companies which in our opinion are leaders in their respective industry or industry segment. However, there is no assurance or guarantee that the investment objective of the Scheme will be achieved. The Scheme does not assure or guarantee any returns. Research Highlights for Invesco India Largecap Fund Below is the key information for Invesco India Largecap Fund Returns up to 1 year are on (Erstwhile ICICI Prudential Focused Bluechip Equity Fund) To generate long-term capital appreciation and income distribution to unit holders from a portfolio that is invested in equity and equity related securities of about 20 companies belonging to the large cap domain and the balance in debt securities and money market instruments. The Fund Manager will always select stocks for investment from among Top 200 stocks in terms of market capitalization on the National Stock Exchange of India Ltd. If the total assets under management under this scheme goes above Rs. 1,000 crores the Fund
Manager reserves the right to increase the number of companies to more than 20. Research Highlights for ICICI Prudential Bluechip Fund Below is the key information for ICICI Prudential Bluechip Fund Returns up to 1 year are on (Erstwhile Reliance Top 200 Fund) The primary investment objective of the scheme is to seek to generate long term capital appreciation by investing in equity and equity related instruments of companies whose market capitalization is within the range of highest & lowest market capitalization of S&P BSE 200 Index. The secondary objective is to generate consistent returns by investing in debt and money market securities. Research Highlights for Nippon India Large Cap Fund Below is the key information for Nippon India Large Cap Fund Returns up to 1 year are on (Erstwhile IDFC Equity Fund) The investment objective of the scheme is to seek to generate
capital growth from a portfolio of predominantly equity and equity
related instruments (including Equity Derivatives). The scheme
may also invest in debt & money market instruments to generate
reasonable income. However there is no assurance or guarantee that the objectives of the scheme will be realized. Research Highlights for Bandhan Large Cap Fund Below is the key information for Bandhan Large Cap Fund Returns up to 1 year are on The Fund is seeking to generate capital appreciation, from a portfolio that is substantially constituted of equity and equity related securities of the 100 largest corporates, by market capitalisation, listed in India. Research Highlights for DSP TOP 100 Equity Below is the key information for DSP TOP 100 Equity Returns up to 1 year are on (Erstwhile BNP Paribas Equity Fund) The investment objective of the Scheme is to generate long-term capital growth from a diversifi ed and actively managed portfolio of equity and equity related securities. The Scheme will invest in a range of companies, with a bias towards large & medium market capitalisation companies. However, there can be no
assurance that the investment objective of the Scheme will be achieved. The Scheme does not guarantee / indicate any returns. Research Highlights for BNP Paribas Large Cap Fund Below is the key information for BNP Paribas Large Cap Fund Returns up to 1 year are on To provide income distribution and / or medium to long term capital gains while at all times emphasising the importance of capital appreciation. Research Highlights for TATA Large Cap Fund Below is the key information for TATA Large Cap Fund Returns up to 1 year are on (Erstwhile JM Equity Fund) The scheme seeks to provide optimum capital growth and appreciation. Research Highlights for JM Large Cap Fund Below is the key information for JM Large Cap Fund Returns up to 1 year are on 1. IDBI India Top 100 Equity Fund
IDBI India Top 100 Equity Fund
Growth Launch Date 15 May 12 NAV (28 Jul 23) ₹44.16 ↑ 0.05 (0.11 %) Net Assets (Cr) ₹655 on 30 Jun 23 Category Equity - Large Cap AMC IDBI Asset Management Limited Rating ☆☆☆ Risk Moderately High Expense Ratio 2.47 Sharpe Ratio 1.09 Information Ratio 0.14 Alpha Ratio 2.11 Min Investment 5,000 Min SIP Investment 500 Exit Load 0-1 Years (1%),1 Years and above(NIL) Growth of 10,000 investment over the years.
Date Value 30 Jun 21 ₹10,000 30 Jun 22 ₹10,040 30 Jun 23 ₹12,362 Returns for IDBI India Top 100 Equity Fund
absolute basis & more than 1 year are on CAGR (Compound Annual Growth Rate) basis. as on 28 Jul 23 Duration Returns 1 Month 3% 3 Month 9.2% 6 Month 12.5% 1 Year 15.4% 3 Year 21.9% 5 Year 12.6% 10 Year 15 Year Since launch 14.2% Historical performance (Yearly) on absolute basis
Year Returns 2025 2024 2023 2022 2021 2020 2019 2018 2017 2016 Fund Manager information for IDBI India Top 100 Equity Fund
Name Since Tenure Data below for IDBI India Top 100 Equity Fund as on 30 Jun 23
Equity Sector Allocation
Sector Value Asset Allocation
Asset Class Value Top Securities Holdings / Portfolio
Name Holding Value Quantity 2. JM Core 11 Fund
JM Core 11 Fund
Growth Launch Date 5 Mar 08 NAV (20 Jul 26) ₹20.0693 ↓ -0.05 (-0.26 %) Net Assets (Cr) ₹286 on 30 Jun 26 Category Equity - Large Cap AMC JM Financial Asset Management Limited Rating ☆☆☆☆ Risk High Expense Ratio 2.38 Sharpe Ratio -0.23 Information Ratio 0.15 Alpha Ratio 2.17 Min Investment 5,000 Min SIP Investment 500 Exit Load 0-60 Days (1%),60 Days and above(NIL) Growth of 10,000 investment over the years.
Date Value 30 Jun 21 ₹10,000 30 Jun 22 ₹9,962 30 Jun 23 ₹12,943 30 Jun 24 ₹19,005 30 Jun 25 ₹19,091 30 Jun 26 ₹18,895 Returns for JM Core 11 Fund
absolute basis & more than 1 year are on CAGR (Compound Annual Growth Rate) basis. as on 28 Jul 23 Duration Returns 1 Month 1.7% 3 Month 4.7% 6 Month 4% 1 Year 2.8% 3 Year 13.1% 5 Year 13.9% 10 Year 15 Year Since launch 3.9% Historical performance (Yearly) on absolute basis
Year Returns 2025 -1.9% 2024 24.3% 2023 32.9% 2022 7.1% 2021 16.3% 2020 6.3% 2019 10.6% 2018 -5% 2017 43.1% 2016 11.1% Fund Manager information for JM Core 11 Fund
Name Since Tenure Satish Ramanathan 1 Oct 24 1.75 Yr. Asit Bhandarkar 25 Feb 09 17.36 Yr. Ruchi Fozdar 4 Oct 24 1.74 Yr. Deepak Gupta 11 Apr 25 1.22 Yr. Data below for JM Core 11 Fund as on 30 Jun 26
Equity Sector Allocation
Sector Value Financial Services 23.84% Consumer Cyclical 23.45% Industrials 17.21% Technology 14.07% Health Care 7.8% Basic Materials 6.35% Utility 3.2% Communication Services 2.95% Asset Allocation
Asset Class Value Cash 1.13% Equity 98.87% Top Securities Holdings / Portfolio
Name Holding Value Quantity Ujjivan Small Finance Bank Ltd Ordinary Shares (Financial Services)
Equity, Since 31 May 25 | 5429045% ₹15 Cr 2,671,722
↓ -130,000 Larsen & Toubro Ltd (Industrials)
Equity, Since 31 Oct 11 | LT5% ₹14 Cr 34,507
↓ -2,000 Amber Enterprises India Ltd Ordinary Shares (Consumer Cyclical)
Equity, Since 31 Mar 23 | AMBER5% ₹14 Cr 18,050 OneSource Specialty Pharma Ltd (Healthcare)
Equity, Since 31 Jan 25 | ONESOURCE4% ₹12 Cr 65,637 Bajaj Finance Ltd (Financial Services)
Equity, Since 31 Jan 25 | BAJFINANCE4% ₹12 Cr 131,500
↓ -8,000 One97 Communications Ltd (Technology)
Equity, Since 31 May 25 | PAYTM4% ₹12 Cr 105,000 Premier Energies Ltd (Technology)
Equity, Since 31 Mar 26 | PREMIERENE4% ₹12 Cr 110,000
↑ 10,000 Adani Ports & Special Economic Zone Ltd (Industrials)
Equity, Since 31 May 25 | ADANIPORTS4% ₹12 Cr 64,000 Eternal Ltd (Consumer Cyclical)
Equity, Since 30 Nov 23 | ETERNAL4% ₹12 Cr 460,000 IDFC First Bank Ltd (Financial Services)
Equity, Since 30 Apr 25 | IDFCFIRSTB4% ₹11 Cr 1,600,000 3. Invesco India Largecap Fund
Invesco India Largecap Fund
Growth Launch Date 21 Aug 09 NAV (20 Jul 26) ₹71.75 ↓ -0.04 (-0.06 %) Net Assets (Cr) ₹1,847 on 30 Jun 26 Category Equity - Large Cap AMC Invesco Asset Management (India) Private Ltd Rating ☆☆☆ Risk Moderately High Expense Ratio 2.1 Sharpe Ratio -0.25 Information Ratio 0.82 Alpha Ratio 3.75 Min Investment 5,000 Min SIP Investment 100 Exit Load 0-1 Years (1%),1 Years and above(NIL) Growth of 10,000 investment over the years.
Date Value 30 Jun 21 ₹10,000 30 Jun 22 ₹10,005 30 Jun 23 ₹12,373 30 Jun 24 ₹16,924 30 Jun 25 ₹18,181 30 Jun 26 ₹18,122 Returns for Invesco India Largecap Fund
absolute basis & more than 1 year are on CAGR (Compound Annual Growth Rate) basis. as on 28 Jul 23 Duration Returns 1 Month 1.8% 3 Month 4.2% 6 Month 4.4% 1 Year 3.3% 3 Year 12.9% 5 Year 12.4% 10 Year 15 Year Since launch 12.4% Historical performance (Yearly) on absolute basis
Year Returns 2025 5.5% 2024 20% 2023 27.8% 2022 -3% 2021 32.5% 2020 14.1% 2019 10.5% 2018 -0.4% 2017 28.3% 2016 2.8% Fund Manager information for Invesco India Largecap Fund
Name Since Tenure Hiten Jain 1 Dec 23 2.58 Yr. Data below for Invesco India Largecap Fund as on 30 Jun 26
Equity Sector Allocation
Sector Value Financial Services 32.99% Industrials 20.35% Consumer Cyclical 14.78% Technology 10.22% Health Care 8.14% Basic Materials 6.02% Communication Services 3.35% Real Estate 2.12% Consumer Defensive 1.19% Utility 0.59% Asset Allocation
Asset Class Value Cash 0.25% Equity 99.75% Top Securities Holdings / Portfolio
Name Holding Value Quantity ICICI Bank Ltd (Financial Services)
Equity, Since 30 Sep 19 | ICICIBANK7% ₹122 Cr 969,443 ICICI Prudential Asset Management Co Ltd (Financial Services)
Equity, Since 31 Dec 25 | ICICIAMC6% ₹105 Cr 296,370 HDFC Bank Ltd (Financial Services)
Equity, Since 30 Sep 09 | HDFCBANK6% ₹103 Cr 1,384,844 Infosys Ltd (Technology)
Equity, Since 30 Apr 18 | INFY4% ₹75 Cr 646,679 Larsen & Toubro Ltd (Industrials)
Equity, Since 31 Oct 25 | LT4% ₹71 Cr 173,437 Bajaj Finance Ltd (Financial Services)
Equity, Since 28 Feb 25 | BAJFINANCE3% ₹61 Cr 671,135 Bharti Airtel Ltd (Communication Services)
Equity, Since 31 Dec 19 | BHARTIARTL3% ₹59 Cr 320,404 Eternal Ltd (Consumer Cyclical)
Equity, Since 31 Aug 23 | ETERNAL3% ₹58 Cr 2,302,684 Tech Mahindra Ltd (Technology)
Equity, Since 31 May 23 | TECHM3% ₹55 Cr 370,579 Axis Bank Ltd (Financial Services)
Equity, Since 31 Jan 26 | AXISBANK3% ₹52 Cr 406,975 4. ICICI Prudential Bluechip Fund
ICICI Prudential Bluechip Fund
Growth Launch Date 23 May 08 NAV (20 Jul 26) ₹108.81 ↓ -0.39 (-0.36 %) Net Assets (Cr) ₹79,421 on 30 Jun 26 Category Equity - Large Cap AMC ICICI Prudential Asset Management Company Limited Rating ☆☆☆☆ Risk Moderately High Expense Ratio 1.46 Sharpe Ratio -0.55 Information Ratio 0.85 Alpha Ratio -1.21 Min Investment 5,000 Min SIP Investment 100 Exit Load 0-1 Years (1%),1 Years and above(NIL) Growth of 10,000 investment over the years.
Date Value 30 Jun 21 ₹10,000 30 Jun 22 ₹10,446 30 Jun 23 ₹12,920 30 Jun 24 ₹17,880 30 Jun 25 ₹19,286 30 Jun 26 ₹18,583 Returns for ICICI Prudential Bluechip Fund
absolute basis & more than 1 year are on CAGR (Compound Annual Growth Rate) basis. as on 28 Jul 23 Duration Returns 1 Month 0.8% 3 Month -0.2% 6 Month -2.4% 1 Year -1% 3 Year 11.9% 5 Year 13.5% 10 Year 15 Year Since launch 14% Historical performance (Yearly) on absolute basis
Year Returns 2025 11.3% 2024 16.9% 2023 27.4% 2022 6.9% 2021 29.2% 2020 13.5% 2019 9.8% 2018 -0.8% 2017 32.7% 2016 7.7% Fund Manager information for ICICI Prudential Bluechip Fund
Name Since Tenure Sankaran Naren 5 Feb 26 0.4 Yr. Vaibhav Dusad 18 Jan 21 5.45 Yr. Sharmila D'Silva 31 Jul 22 3.92 Yr. Data below for ICICI Prudential Bluechip Fund as on 30 Jun 26
Equity Sector Allocation
Sector Value Financial Services 28.98% Consumer Cyclical 13.83% Industrials 11.11% Energy 7.43% Basic Materials 6.68% Consumer Defensive 5.84% Health Care 5.11% Communication Services 4.85% Technology 4.81% Utility 4.4% Real Estate 1.32% Asset Allocation
Asset Class Value Cash 5.23% Equity 94.77% Top Securities Holdings / Portfolio
Name Holding Value Quantity ICICI Bank Ltd (Financial Services)
Equity, Since 30 Jun 08 | ICICIBANK9% ₹6,650 Cr 52,926,976 HDFC Bank Ltd (Financial Services)
Equity, Since 31 Dec 10 | HDFCBANK8% ₹6,458 Cr 86,741,473 Reliance Industries Ltd (Energy)
Equity, Since 30 Jun 08 | RELIANCE5% ₹4,125 Cr 31,220,500
↑ 1,500,000 Larsen & Toubro Ltd (Industrials)
Equity, Since 31 Jan 12 | LT5% ₹4,107 Cr 10,075,656
↓ -594,718 Axis Bank Ltd (Financial Services)
Equity, Since 31 Mar 14 | AXISBANK5% ₹3,562 Cr 27,689,059
↑ 100,000 Bharti Airtel Ltd (Communication Services)
Equity, Since 31 Aug 09 | BHARTIARTL4% ₹3,311 Cr 18,104,129
↑ 337,869 Infosys Ltd (Technology)
Equity, Since 30 Nov 10 | INFY4% ₹2,747 Cr 23,662,450
↓ -1,575,000 Maruti Suzuki India Ltd (Consumer Cyclical)
Equity, Since 30 Apr 16 | MARUTI4% ₹2,712 Cr 2,065,675
↓ -79,950 UltraTech Cement Ltd (Basic Materials)
Equity, Since 30 Sep 17 | ULTRACEMCO3% ₹2,050 Cr 1,785,267
↓ -50,000 Sun Pharmaceuticals Industries Ltd (Healthcare)
Equity, Since 31 Jul 15 | SUNPHARMA3% ₹2,024 Cr 11,249,940 5. Nippon India Large Cap Fund
Nippon India Large Cap Fund
Growth Launch Date 8 Aug 07 NAV (20 Jul 26) ₹90.0981 ↓ -0.43 (-0.48 %) Net Assets (Cr) ₹53,227 on 30 Jun 26 Category Equity - Large Cap AMC Nippon Life Asset Management Ltd. Rating ☆☆☆☆ Risk Moderately High Expense Ratio 1.58 Sharpe Ratio -0.43 Information Ratio 0.98 Alpha Ratio 1.07 Min Investment 5,000 Min SIP Investment 100 Exit Load 0-1 Years (1%),1 Years and above(NIL) Growth of 10,000 investment over the years.
Date Value 30 Jun 21 ₹10,000 30 Jun 22 ₹10,578 30 Jun 23 ₹13,946 30 Jun 24 ₹19,434 30 Jun 25 ₹20,766 30 Jun 26 ₹20,223 Returns for Nippon India Large Cap Fund
absolute basis & more than 1 year are on CAGR (Compound Annual Growth Rate) basis. as on 28 Jul 23 Duration Returns 1 Month 0.5% 3 Month 0.2% 6 Month -0.4% 1 Year -0.4% 3 Year 11.9% 5 Year 15.4% 10 Year 15 Year Since launch 12.3% Historical performance (Yearly) on absolute basis
Year Returns 2025 9.2% 2024 18.2% 2023 32.1% 2022 11.3% 2021 32.4% 2020 4.9% 2019 7.3% 2018 -0.2% 2017 38.4% 2016 2.2% Fund Manager information for Nippon India Large Cap Fund
Name Since Tenure Sailesh Raj Bhan 8 Aug 07 18.91 Yr. Kinjal Desai 25 May 18 8.11 Yr. Bhavik Dave 19 Aug 24 1.87 Yr. Amber Singhania 11 Mar 26 0.31 Yr. Data below for Nippon India Large Cap Fund as on 30 Jun 26
Equity Sector Allocation
Sector Value Financial Services 34.93% Consumer Cyclical 15.3% Consumer Defensive 11.37% Industrials 8.63% Health Care 8.21% Technology 7.23% Utility 5.65% Energy 4.2% Basic Materials 2.34% Communication Services 0.69% Real Estate 0.68% Asset Allocation
Asset Class Value Cash 0.25% Equity 99.75% Top Securities Holdings / Portfolio
Name Holding Value Quantity HDFC Bank Ltd (Financial Services)
Equity, Since 31 Dec 08 | HDFCBANK9% ₹4,808 Cr 64,580,734
↑ 2,700,000 ICICI Bank Ltd (Financial Services)
Equity, Since 31 Oct 09 | ICICIBANK8% ₹4,231 Cr 33,677,945
↑ 1,000,000 Reliance Industries Ltd (Energy)
Equity, Since 31 Aug 19 | RELIANCE4% ₹2,172 Cr 16,441,139
↑ 903,600 Axis Bank Ltd (Financial Services)
Equity, Since 31 Mar 15 | AXISBANK4% ₹2,099 Cr 16,315,542
↑ 700,000 Bajaj Finance Ltd (Financial Services)
Equity, Since 31 Dec 21 | BAJFINANCE4% ₹1,820 Cr 20,034,184 Larsen & Toubro Ltd (Industrials)
Equity, Since 30 Sep 07 | LT3% ₹1,793 Cr 4,397,774 GE Vernova T&D India Ltd (Industrials)
Equity, Since 30 Jun 12 | GVT&D3% ₹1,452 Cr 2,819,557
↓ -533,863 Sun Pharmaceuticals Industries Ltd (Healthcare)
Equity, Since 30 Sep 25 | SUNPHARMA3% ₹1,447 Cr 8,040,635
↑ 1,955,755 Infosys Ltd (Technology)
Equity, Since 30 Sep 07 | INFY3% ₹1,408 Cr 12,126,097 Hindustan Unilever Ltd (Consumer Defensive)
Equity, Since 30 Sep 20 | HINDUNILVR3% ₹1,400 Cr 6,498,878
↑ 500,000 6. Bandhan Large Cap Fund
Bandhan Large Cap Fund
Growth Launch Date 9 Jun 06 NAV (20 Jul 26) ₹78.054 ↓ -0.20 (-0.25 %) Net Assets (Cr) ₹2,061 on 30 Jun 26 Category Equity - Large Cap AMC IDFC Asset Management Company Limited Rating ☆☆ Risk Moderately High Expense Ratio 2.07 Sharpe Ratio -0.35 Information Ratio 0.63 Alpha Ratio 2.34 Min Investment 5,000 Min SIP Investment 100 Exit Load 0-365 Days (1%),365 Days and above(NIL) Growth of 10,000 investment over the years.
Date Value 30 Jun 21 ₹10,000 30 Jun 22 ₹9,921 30 Jun 23 ₹12,185 30 Jun 24 ₹16,500 30 Jun 25 ₹17,486 30 Jun 26 ₹17,236 Returns for Bandhan Large Cap Fund
absolute basis & more than 1 year are on CAGR (Compound Annual Growth Rate) basis. as on 28 Jul 23 Duration Returns 1 Month 1.5% 3 Month 1.8% 6 Month 0.6% 1 Year 1.6% 3 Year 11.7% 5 Year 12% 10 Year 15 Year Since launch 10.8% Historical performance (Yearly) on absolute basis
Year Returns 2025 8.2% 2024 18.7% 2023 26.8% 2022 -2.3% 2021 26.8% 2020 17.4% 2019 10.6% 2018 -4.2% 2017 34.2% 2016 5.3% Fund Manager information for Bandhan Large Cap Fund
Name Since Tenure Manish Gunwani 2 Dec 24 1.58 Yr. Prateek Poddar 2 Dec 24 1.58 Yr. Ritika Behera 7 Oct 23 2.73 Yr. Gaurav Satra 7 Jun 24 2.07 Yr. Data below for Bandhan Large Cap Fund as on 30 Jun 26
Equity Sector Allocation
Sector Value Financial Services 31.37% Consumer Cyclical 14.89% Technology 8.69% Basic Materials 7.9% Industrials 7.81% Health Care 7.05% Energy 6.25% Consumer Defensive 5.02% Utility 4.61% Communication Services 3.01% Real Estate 1.8% Asset Allocation
Asset Class Value Cash 0.43% Equity 99.57% Top Securities Holdings / Portfolio
Name Holding Value Quantity ICICI Bank Ltd (Financial Services)
Equity, Since 31 Oct 18 | ICICIBANK8% ₹168 Cr 1,338,506
↑ 83,326 HDFC Bank Ltd (Financial Services)
Equity, Since 28 Feb 07 | HDFCBANK7% ₹147 Cr 1,978,408
↑ 6,494 Reliance Industries Ltd (Energy)
Equity, Since 28 Feb 07 | RELIANCE6% ₹118 Cr 890,095
↓ -8,990 Infosys Ltd (Technology)
Equity, Since 31 Aug 11 | INFY4% ₹84 Cr 721,653
↓ -7,289 NTPC Ltd (Utilities)
Equity, Since 31 Dec 24 | NTPC4% ₹84 Cr 2,162,368
↑ 28,879 State Bank of India (Financial Services)
Equity, Since 31 Dec 24 | SBIN4% ₹74 Cr 768,824
↑ 29,946 Larsen & Toubro Ltd (Industrials)
Equity, Since 31 Jan 19 | LT3% ₹67 Cr 163,216
↓ -1,648 Bharti Airtel Ltd (Communication Services)
Equity, Since 30 Apr 24 | BHARTIARTL3% ₹60 Cr 329,763
↓ -3,330 Mahindra & Mahindra Ltd (Consumer Cyclical)
Equity, Since 30 Apr 24 | M&M3% ₹59 Cr 193,611
↑ 7,133 Sun Pharmaceuticals Industries Ltd (Healthcare)
Equity, Since 31 Aug 24 | SUNPHARMA3% ₹57 Cr 314,202
↓ -3,173 7. DSP TOP 100 Equity
DSP TOP 100 Equity
Growth Launch Date 10 Mar 03 NAV (20 Jul 26) ₹459.134 ↓ -2.26 (-0.49 %) Net Assets (Cr) ₹7,190 on 30 Jun 26 Category Equity - Large Cap AMC DSP BlackRock Invmt Managers Pvt. Ltd. Rating ☆☆ Risk Moderately High Expense Ratio 1.94 Sharpe Ratio -0.68 Information Ratio 0.53 Alpha Ratio -2.7 Min Investment 1,000 Min SIP Investment 500 Exit Load 0-12 Months (1%),12 Months and above(NIL) Growth of 10,000 investment over the years.
Date Value 30 Jun 21 ₹10,000 30 Jun 22 ₹9,310 30 Jun 23 ₹11,681 30 Jun 24 ₹15,849 30 Jun 25 ₹17,488 30 Jun 26 ₹16,563 Returns for DSP TOP 100 Equity
absolute basis & more than 1 year are on CAGR (Compound Annual Growth Rate) basis. as on 28 Jul 23 Duration Returns 1 Month 0.6% 3 Month 0.3% 6 Month -3% 1 Year -3.4% 3 Year 11.4% 5 Year 10.7% 10 Year 15 Year Since launch 17.8% Historical performance (Yearly) on absolute basis
Year Returns 2025 8.4% 2024 20.5% 2023 26.6% 2022 1.4% 2021 19.5% 2020 7.5% 2019 14.8% 2018 -2.7% 2017 26.5% 2016 4.9% Fund Manager information for DSP TOP 100 Equity
Name Since Tenure Anish Tawakley 16 May 26 0.13 Yr. Data below for DSP TOP 100 Equity as on 30 Jun 26
Equity Sector Allocation
Sector Value Financial Services 36.89% Consumer Cyclical 11.99% Communication Services 7.37% Energy 7.36% Consumer Defensive 6.64% Industrials 5.59% Technology 5% Utility 4.57% Health Care 4.43% Basic Materials 4.05% Real Estate 1.78% Asset Allocation
Asset Class Value Cash 3.91% Equity 96.09% Top Securities Holdings / Portfolio
Name Holding Value Quantity ICICI Bank Ltd (Financial Services)
Equity, Since 31 Jul 16 | ICICIBANK9% ₹679 Cr 5,402,080
↑ 718,418 HDFC Bank Ltd (Financial Services)
Equity, Since 30 Sep 14 | HDFCBANK9% ₹660 Cr 8,859,088
↑ 204,478 Axis Bank Ltd (Financial Services)
Equity, Since 31 Oct 21 | AXISBANK6% ₹412 Cr 3,199,327 ITC Ltd (Consumer Defensive)
Equity, Since 31 Mar 21 | ITC6% ₹404 Cr 14,073,512
↓ -2,324,803 Infosys Ltd (Technology)
Equity, Since 30 Sep 19 | INFY5% ₹359 Cr 3,089,541 Bharti Airtel Ltd (Communication Services)
Equity, Since 31 Mar 26 | BHARTIARTL5% ₹358 Cr 1,958,496
↑ 392,336 Mahindra & Mahindra Ltd (Consumer Cyclical)
Equity, Since 28 Feb 22 | M&M5% ₹357 Cr 1,172,124 Larsen & Toubro Ltd (Industrials)
Equity, Since 31 May 26 | LT4% ₹304 Cr 745,456
↑ 745,456 Reliance Industries Ltd (Energy)
Equity, Since 31 May 26 | RELIANCE4% ₹300 Cr 2,269,483
↑ 2,269,483 NTPC Ltd (Utilities)
Equity, Since 30 Nov 23 | NTPC3% ₹245 Cr 6,330,986
↓ -82,234 8. BNP Paribas Large Cap Fund
BNP Paribas Large Cap Fund
Growth Launch Date 23 Sep 04 NAV (20 Jul 26) ₹219.926 ↑ 0.38 (0.17 %) Net Assets (Cr) ₹2,571 on 30 Jun 26 Category Equity - Large Cap AMC BNP Paribas Asset Mgmt India Pvt. Ltd Rating ☆☆☆ Risk Moderately High Expense Ratio 2.02 Sharpe Ratio -0.47 Information Ratio 0.51 Alpha Ratio -0.07 Min Investment 5,000 Min SIP Investment 300 Exit Load 0-12 Months (1%),12 Months and above(NIL) Growth of 10,000 investment over the years.
Date Value 30 Jun 21 ₹10,000 30 Jun 22 ₹10,069 30 Jun 23 ₹12,228 30 Jun 24 ₹17,289 30 Jun 25 ₹17,763 30 Jun 26 ₹17,138 Returns for BNP Paribas Large Cap Fund
absolute basis & more than 1 year are on CAGR (Compound Annual Growth Rate) basis. as on 28 Jul 23 Duration Returns 1 Month 0.4% 3 Month 0.9% 6 Month 0.3% 1 Year -0.5% 3 Year 11.2% 5 Year 11.7% 10 Year 15 Year Since launch 15.2% Historical performance (Yearly) on absolute basis
Year Returns 2025 4.4% 2024 20.1% 2023 24.8% 2022 4.2% 2021 22.1% 2020 16.8% 2019 17.2% 2018 -4% 2017 37% 2016 -5.5% Fund Manager information for BNP Paribas Large Cap Fund
Name Since Tenure Jitendra Sriram 16 Jun 22 4.04 Yr. Kushant Arora 21 Oct 24 1.69 Yr. Data below for BNP Paribas Large Cap Fund as on 30 Jun 26
Equity Sector Allocation
Sector Value Financial Services 26.39% Industrials 14.5% Consumer Cyclical 10.07% Technology 9.09% Energy 7.84% Consumer Defensive 6.98% Utility 5.97% Basic Materials 5.97% Health Care 5.24% Communication Services 3.94% Asset Allocation
Asset Class Value Cash 2.29% Equity 97.26% Debt 0.45% Top Securities Holdings / Portfolio
Name Holding Value Quantity Hitachi Energy India Ltd Ordinary Shares (Industrials)
Equity, Since 31 Aug 23 | POWERINDIA6% ₹154 Cr 40,050
↓ -1,710 Reliance Industries Ltd (Energy)
Equity, Since 30 Sep 17 | RELIANCE6% ₹149 Cr 1,125,000 HDFC Bank Ltd (Financial Services)
Equity, Since 31 Jul 08 | HDFCBANK6% ₹147 Cr 1,980,000 ICICI Bank Ltd (Financial Services)
Equity, Since 30 Jun 12 | ICICIBANK6% ₹144 Cr 1,143,000 Larsen & Toubro Ltd (Industrials)
Equity, Since 30 Apr 20 | LT4% ₹110 Cr 270,000 Bharti Airtel Ltd (Communication Services)
Equity, Since 29 Feb 08 | BHARTIARTL4% ₹100 Cr 549,000 State Bank of India (Financial Services)
Equity, Since 31 Jul 20 | SBIN3% ₹75 Cr 774,000 Kotak Mahindra Bank Ltd (Financial Services)
Equity, Since 28 Feb 15 | KOTAKBANK3% ₹69 Cr 1,800,000 Infosys Ltd (Technology)
Equity, Since 31 Mar 09 | INFY2% ₹63 Cr 540,000 Eternal Ltd (Consumer Cyclical)
Equity, Since 31 Aug 23 | ETERNAL2% ₹61 Cr 2,430,000 9. TATA Large Cap Fund
TATA Large Cap Fund
Growth Launch Date 7 May 98 NAV (20 Jul 26) ₹514.398 ↓ -1.05 (-0.20 %) Net Assets (Cr) ₹2,721 on 30 Jun 26 Category Equity - Large Cap AMC Tata Asset Management Limited Rating ☆☆☆ Risk Moderately High Expense Ratio 2.05 Sharpe Ratio -0.3 Information Ratio 0.27 Alpha Ratio 3 Min Investment 5,000 Min SIP Investment 150 Exit Load 0-365 Days (1%),365 Days and above(NIL) Growth of 10,000 investment over the years.
Date Value 30 Jun 21 ₹10,000 30 Jun 22 ₹9,948 30 Jun 23 ₹12,285 30 Jun 24 ₹16,504 30 Jun 25 ₹17,026 30 Jun 26 ₹16,814 Returns for TATA Large Cap Fund
absolute basis & more than 1 year are on CAGR (Compound Annual Growth Rate) basis. as on 28 Jul 23 Duration Returns 1 Month 2.2% 3 Month 2.5% 6 Month 1.2% 1 Year 2.7% 3 Year 10.6% 5 Year 11.4% 10 Year 15 Year Since launch 18.2% Historical performance (Yearly) on absolute basis
Year Returns 2025 9.2% 2024 12.9% 2023 24.5% 2022 3.3% 2021 32.7% 2020 8.3% 2019 12.1% 2018 -3.6% 2017 29.5% 2016 2.9% Fund Manager information for TATA Large Cap Fund
Name Since Tenure Abhinav Sharma 5 Apr 23 3.24 Yr. Hasmukh Vishariya 1 Mar 25 1.33 Yr. Data below for TATA Large Cap Fund as on 30 Jun 26
Equity Sector Allocation
Sector Value Financial Services 32.19% Industrials 11.35% Consumer Cyclical 9.47% Technology 7.93% Basic Materials 7.36% Communication Services 7.25% Utility 6.31% Energy 6.28% Health Care 4.82% Consumer Defensive 4.66% Asset Allocation
Asset Class Value Cash 2.38% Equity 97.62% Top Securities Holdings / Portfolio
Name Holding Value Quantity ICICI Bank Ltd (Financial Services)
Equity, Since 31 Mar 11 | ICICIBANK8% ₹221 Cr 1,760,300
↓ -80,000 HDFC Bank Ltd (Financial Services)
Equity, Since 30 Apr 07 | HDFCBANK6% ₹162 Cr 2,171,900 Bharti Airtel Ltd (Communication Services)
Equity, Since 31 Jan 25 | BHARTIARTL6% ₹155 Cr 845,000 Reliance Industries Ltd (Energy)
Equity, Since 30 Apr 05 | RELIANCE5% ₹139 Cr 1,050,000 Kotak Mahindra Bank Ltd (Financial Services)
Equity, Since 31 Oct 16 | KOTAKBANK4% ₹96 Cr 2,495,000 Larsen & Toubro Ltd (Industrials)
Equity, Since 31 Dec 20 | LT4% ₹95 Cr 232,784 Infosys Ltd (Technology)
Equity, Since 31 Jan 09 | INFY3% ₹88 Cr 758,248 Adani Energy Solutions Ltd (Utilities)
Equity, Since 31 May 24 | ADANIENSOL3% ₹80 Cr 528,193
↑ 70,000 Axis Bank Ltd (Financial Services)
Equity, Since 31 Aug 18 | AXISBANK3% ₹80 Cr 620,000
↓ -200,000 State Bank of India (Financial Services)
Equity, Since 30 Apr 14 | SBIN3% ₹79 Cr 821,000 10. JM Large Cap Fund
JM Large Cap Fund
Growth Launch Date 1 Apr 95 NAV (20 Jul 26) ₹152.773 ↑ 0.02 (0.01 %) Net Assets (Cr) ₹409 on 30 Jun 26 Category Equity - Large Cap AMC JM Financial Asset Management Limited Rating ☆☆ Risk Moderately High Expense Ratio 2.36 Sharpe Ratio -0.48 Information Ratio 0.15 Alpha Ratio 0.2 Min Investment 5,000 Min SIP Investment 500 Exit Load 0-60 Days (1%),60 Days and above(NIL) Growth of 10,000 investment over the years.
Date Value 30 Jun 21 ₹10,000 30 Jun 22 ₹10,077 30 Jun 23 ₹12,453 30 Jun 24 ₹18,131 30 Jun 25 ₹17,729 30 Jun 26 ₹17,076 Returns for JM Large Cap Fund
absolute basis & more than 1 year are on CAGR (Compound Annual Growth Rate) basis. as on 28 Jul 23 Duration Returns 1 Month 1.5% 3 Month 1.4% 6 Month -0.2% 1 Year 0% 3 Year 10.4% 5 Year 11.5% 10 Year 15 Year Since launch 9.1% Historical performance (Yearly) on absolute basis
Year Returns 2025 3.8% 2024 15.1% 2023 29.6% 2022 3.4% 2021 23.2% 2020 18.1% 2019 4.9% 2018 0.8% 2017 20.9% 2016 1.8% Fund Manager information for JM Large Cap Fund
Name Since Tenure Satish Ramanathan 20 Aug 21 4.86 Yr. Asit Bhandarkar 5 Oct 17 8.74 Yr. Ruchi Fozdar 4 Oct 24 1.74 Yr. Deepak Gupta 27 Jan 25 1.42 Yr. Data below for JM Large Cap Fund as on 30 Jun 26
Equity Sector Allocation
Sector Value Financial Services 29% Industrials 13.88% Consumer Cyclical 12.93% Technology 8.17% Health Care 7.67% Basic Materials 6.44% Energy 5.74% Consumer Defensive 5.57% Communication Services 3.91% Utility 3.61% Real Estate 1.27% Asset Allocation
Asset Class Value Cash 1.8% Equity 98.2% Top Securities Holdings / Portfolio
Name Holding Value Quantity HDFC Bank Ltd (Financial Services)
Equity, Since 30 Sep 12 | HDFCBANK6% ₹26 Cr 353,694 Reliance Industries Ltd (Energy)
Equity, Since 31 Mar 25 | RELIANCE6% ₹24 Cr 180,700 ICICI Bank Ltd (Financial Services)
Equity, Since 31 Jan 11 | ICICIBANK4% ₹18 Cr 145,387
↑ 15,600 State Bank of India (Financial Services)
Equity, Since 31 Oct 11 | SBIN4% ₹16 Cr 169,097 Bharti Airtel Ltd (Communication Services)
Equity, Since 31 Mar 24 | BHARTIARTL4% ₹16 Cr 88,950 Larsen & Toubro Ltd (Industrials)
Equity, Since 28 Feb 25 | LT3% ₹13 Cr 32,300
↓ -2,500 Shriram Finance Ltd (Financial Services)
Equity, Since 30 Apr 25 | SHRIRAMFIN3% ₹11 Cr 119,500 Adani Ports & Special Economic Zone Ltd (Industrials)
Equity, Since 31 May 25 | ADANIPORTS3% ₹11 Cr 61,750 Axis Bank Ltd (Financial Services)
Equity, Since 31 Mar 25 | AXISBANK3% ₹11 Cr 83,723 Apollo Hospitals Enterprise Ltd (Healthcare)
Equity, Since 28 Feb 25 | APOLLOHOSP3% ₹11 Cr 12,875
↓ -1,154
Conclusion
The performance of blue chip companies generally represents the economic scenario. Such companies have a potential to forecast the economy. Furthermore, large cap companies are rarely affected by the market Volatility, hence, are considered to be a risk-free investment. Even though the price of large cap stocks is higher, they are valuable in the rising economy for a long term investment. Thus, investors looking for a long-term Investment plan can consider large cap mutual funds as an ideal avenue to invest!
All efforts have been made to ensure the information provided here is accurate. However, no guarantees are made regarding correctness of data. Please verify with scheme information document before making any investment.


AMFI Registration No. 112358 | CIN: U74999MH2016PTC282153
Shepard Technologies Pvt. Ltd. (with ARN code 112358) makes no warranties or representations, express or implied, on products offered through the platform. It accepts no liability for any damages or losses, however caused, in connection with the use of, or on the reliance of its product or related services. Terms and conditions of the website are applicable.
©2026 Shepard Technologies Private Limited. All Rights Reserved
Research Highlights for IDBI India Top 100 Equity Fund