What is NAV in Mutual Funds? Formula, Calculation & Types Explained
Most new investors believe that a mutual fund with a lower NAV is “cheaper” and therefore better. That’s one of the biggest myths. Net Asset Value (NAV) is simply the per-unit price of a mutual fund, not an indicator of performance.

Understanding it is essential because it directly affects how your investments are valued, tracked, and redeemed.
What is NAV? (Meaning & Definition)
Net Asset Value is the per-unit market value of a mutual fund scheme. It represents the total value of a fund’s assets minus liabilities, divided by the total number of outstanding units.
In simple terms:
- NAV is like the “price tag” of one unit of a mutual fund.
- It tells you how much one unit of your investment is worth today.
Example:
If a fund has ₹100 crore worth of assets and 10 crore units, then NAV = ₹100 crore ÷ 10 crore = ₹10 per unit.
How is NAV Calculated? (Formula + Example)
Formula for NAV:
NAV = Total Assets – Total Liabilities / Total Outstanding Units
Where:
- Total Assets = Value of stocks, Bonds, cash, and Accrued Income.
- Total Liabilities = Expenses, management fees, outstanding payments.
- Outstanding Units = Number of mutual fund units issued.
Practical Example (Equity Fund)
Suppose at the close of trading yesterday, a mutual fund had:
- ₹1,00,00,000 worth of securities
- ₹50,00,000 in cash
- ₹10,00,000 of liabilities
- 10,00,000 units outstanding
Applying the formula:
NAV = (₹1,00,00,000 + ₹50,00,000 – ₹10,00,000) / 10,00,000
NAV = ₹1,40,00,000 / 10,00,000 = ₹140
So, the NAV of this mutual fund is ₹140 per unit.
This means that if you invest, each unit is currently worth ₹140. The NAV will change daily as the fund’s securities, liabilities, and cash fluctuate.
The Same for Open-Ended vs Closed-Ended Funds NAV:
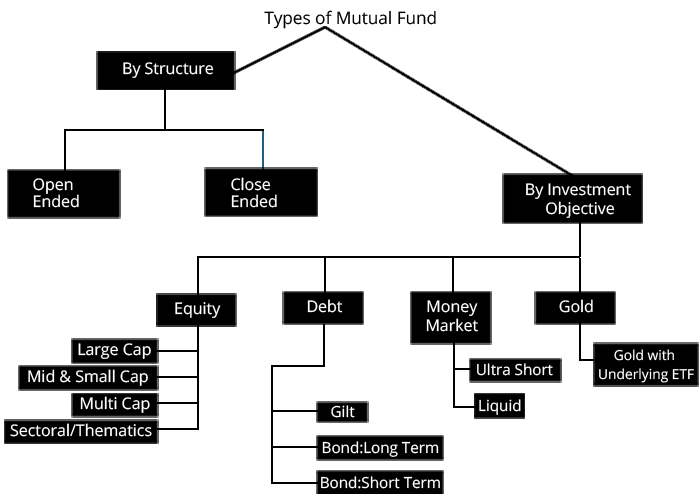
Open-Ended Funds: Investors can buy/sell units at the day’s NAV. In the example above, you’d buy or redeem units at ₹140.
Closed-Ended Funds: Units trade on the stock exchange, so their market price may differ from the NAV. Even if NAV is ₹140, units might trade at ₹135 (discount) or ₹145 (premium) depending on demand and supply.
How Often is NAV Updated?
- In India, NAV is updated at the end of every trading day (post-market close).
- SEBI mandates AMCs to declare NAV daily on their websites.
- For international markets (e.g., US Mutual Funds), NAV is also calculated once a day.
Common Misconceptions About NAV
Myth 1: Low NAV means cheaper fund Truth: NAV does not determine performance. A fund with NAV ₹10 can perform better than a fund with NAV ₹200 if it has strong returns.
Myth 2: Higher NAV = More Expensive Truth: NAV is just like a stock split. Whether you hold 100 units of ₹10 NAV or 10 units of ₹100 NAV, your investment value is the same (₹1,000).
Myth 3: NAV is like Stock Price Truth: NAV is not affected by demand-supply like stocks. It is purely based on the underlying asset value.
NAV in Different Types of Mutual Funds
Equity Funds → NAV fluctuates daily based on stock market prices.
Debt Funds → NAV changes as bond yields and interest rates move.
Hybrid Fund → NAV depends on both equity + debt performance.
ELSS Funds → NAV determines lock-in value but tax benefits remain the same.
NAV & Returns: How They Are Connected
Mutual fund returns are measured by NAV growth over time.
Example:
- Initial NAV = ₹10
- After 2 years NAV = ₹15
Return = 15 − 10 / 10 × 100 = 50%
So, NAV is not a performance predictor, but it is the basis for calculating returns.
Real-Life Examples of NAV (2025 Update)
Here are a few latest NAVs (as of Jan 2025) from popular Indian mutual funds:
Notice how NAVs differ widely, but that doesn’t mean one fund is better than the other. What matters is returns, consistency, and risk profile.
1. Dividend (IDCW) Impact on NAV
When a fund declares a ₹5 per unit dividend and the cum-dividend NAV is ₹100, it falls to ₹95 on the ex-dividend date, even though you receive the ₹5 × units payout.
2. Direct vs Regular Plans (Expense Effect)
Direct plans avoid distributor commissions (usually 1–1.5%), leading to slightly higher NAVs over time. But the value of your investment remains unchanged when switching—only future growth differs.
3. Open-Ended vs Closed-Ended Funds
Consider the SBI Long Term Advantage Fund – Series I (closed-ended). Issued at ₹10 per unit in its NFO, its NAV rose to ₹44.40 by December 2024. Though the official NAV anchors the valuation, investors could sell on exchanges at prices above or below NAV—depending on market sentiment.
Closed-ended funds offer strategic benefits, such as Investing in illiquid assets and fund manager discipline, but NAV isn’t always the real transaction price.
Factors That Affect NAV (Enhanced)
Market Fluctuations: NAV rises or falls daily in sync with the value of the fund’s underlying assets (equity, debt, cash).
idcw/Dividend Distributions: NAV decreases by the exact dividend amount on the payout date, as you're being paid from the fund’s capital, not earnings alone.
For example, HDFC Flexi Cap Fund – IDCW Plan declared a dividend of ₹7 per unit on March 13, 2025, and its NAV that day was ₹76.37. On the ex-dividend day, the NAV fell by ₹7 to reflect the payout commitment.
To add to this, SEBI guidelines state: “On payment of IDCW, the NAV will stand reduced by the amount of IDCW and statutory levy (if applicable).” hdfc mf Files Bucket
Liabilities & Expenses: Routine costs—like management fees, fund operating charges, and statutory expenses—reduce the total asset base used in the NAV calculation.
Fund Structure:
Open-Ended Funds → NAV reflects true per-unit value, and transactions happen at NAV.
Closed-Ended Funds → Units trade on exchanges, often at a premium or discount to NAV due to supply-demand forces.
NAV vs Market Price of ETFs
Mutual Funds → Always bought/sold at NAV.
ETFs → Traded on exchanges like stocks, so price may differ slightly from NAV (premium or discount).
How Investors Should Use NAV in Decision-Making
✅ Use NAV to:
- Track your fund’s growth over time.
- Understand entry/exit price of your investment.
❌ Do NOT use NAV to:
- Compare two different mutual funds.
- Judge which fund is better.
Instead, compare past returns, risk-adjusted returns (Alpha, Beta, Sharpe ratio), fund manager expertise, and expense ratio.
11. Key Takeaways
- NAV is just the per-unit value of a mutual fund.
- Low or high NAV does not matter — performance matters.
- NAV is calculated daily using (Assets – Liabilities) ÷ Units.
- Use NAV only to track investments, not to choose funds.
12. FAQs on NAV in Mutual Funds
Q1. Is a mutual fund with lower NAV better?
A: No. Returns depend on fund performance, not NAV.
Q2. Can NAV be negative?
A: No. NAV represents per-unit value and cannot fall below zero.
Q3. How is NAV different from stock price?
A: Stock price depends on demand & supply, NAV depends on asset value.
Q4. Where can I check daily NAV?
A: On AMFI India’s website, fund house websites, and apps like Fincash.
All efforts have been made to ensure the information provided here is accurate. However, no guarantees are made regarding correctness of data. Please verify with scheme information document before making any investment.


