IndusInd ബാങ്കിലെ SIP ഇടപാടുകൾക്കായി ബില്ലർ എങ്ങനെ ചേർക്കാം?
എസ്.ഐ.പി അല്ലെങ്കിൽ വ്യവസ്ഥാപിതംനിക്ഷേപ പദ്ധതി ഒരു നിക്ഷേപ രീതിയാണ്മ്യൂച്വൽ ഫണ്ട് അതിലൂടെ വ്യക്തികൾ കൃത്യമായ ഇടവേളകളിൽ ചെറിയ തുകകൾ നിക്ഷേപിക്കുന്നു. വ്യക്തികൾ ഇവിടെ മനസ്സിലാക്കേണ്ട പ്രധാന കാര്യങ്ങളിലൊന്ന്, കൃത്യമായ ഇടവേളകളിൽ തുകകൾ കുറയ്ക്കുന്നു എന്നതാണ്. അനന്തരഫലമായി, മുഴുവൻ ഉറപ്പാക്കാൻSIP നിക്ഷേപം പ്രക്രിയ സുഗമമായി നടക്കുന്നു; വ്യക്തികൾക്ക് അവരുടെ ബില്ലർ ചേർക്കാൻ കഴിയുംബാങ്ക് അക്കൗണ്ടുകൾ. ബാങ്ക് അക്കൗണ്ടുകളിൽ ബില്ലർ ചേർക്കുന്നതിന്, വ്യക്തികൾക്ക് SIP-യുടെ അദ്വിതീയ രജിസ്ട്രേഷൻ നമ്പർ അല്ലെങ്കിൽ URN ആവശ്യമാണ്, അത് നെറ്റ് ബാങ്കിംഗ് അല്ലെങ്കിൽ മൊബൈൽ ബാങ്കിംഗ് പ്രക്രിയയിലൂടെ ബാങ്ക് അക്കൗണ്ടിലേക്ക് ചേർക്കേണ്ടതുണ്ട്. ഓരോ ബാങ്കിനും ബില്ലർ ചേർക്കുന്ന പ്രക്രിയ വ്യത്യസ്തമാണ്. അതിനാൽ, IndusInd ബാങ്കിലെ SIP ഇടപാടുകൾക്കായി ബില്ലർ ചേർക്കുന്ന പ്രക്രിയ നമുക്ക് പരിശോധിക്കാം.
നിങ്ങളുടെ IndusInd ബാങ്ക് അക്കൗണ്ടിലേക്ക് ലോഗിൻ ചെയ്ത് ബിൽ പേ ഓപ്ഷനിൽ ക്ലിക്ക് ചെയ്യുക
വ്യക്തികൾ അവരുടെ ബാങ്ക് അക്കൗണ്ടിലേക്ക് ലോഗിൻ ചെയ്യേണ്ട മിക്ക ബാങ്കുകളിലും ആദ്യ ഘട്ടം ഏതാണ്ട് സമാനമാണ്. ഈ സാഹചര്യത്തിൽ പോലും, ആദ്യം നിങ്ങളുടെ ലോഗിൻ ക്രെഡൻഷ്യലുകൾ ഉപയോഗിച്ച് നിങ്ങളുടെ അക്കൗണ്ടിലേക്ക് ലോഗിൻ ചെയ്യേണ്ടതുണ്ട്. ലോഗിൻ ചെയ്ത ശേഷം, നിങ്ങൾ ഹോം സ്ക്രീനിൽ എത്തിക്കഴിഞ്ഞാൽ, നിങ്ങൾ ക്ലിക്ക് ചെയ്യണംബിൽ പേയ്മെന്റുകൾ സ്ക്രീനിന്റെ മുകളിലുള്ള ടാബ്. ഈ ഘട്ടത്തിനായുള്ള ചിത്രം താഴെ കൊടുത്തിരിക്കുന്നുബിൽ പേയ്മെന്റുകൾ ടാബ് പച്ചയിൽ ഹൈലൈറ്റ് ചെയ്തിരിക്കുന്നു.

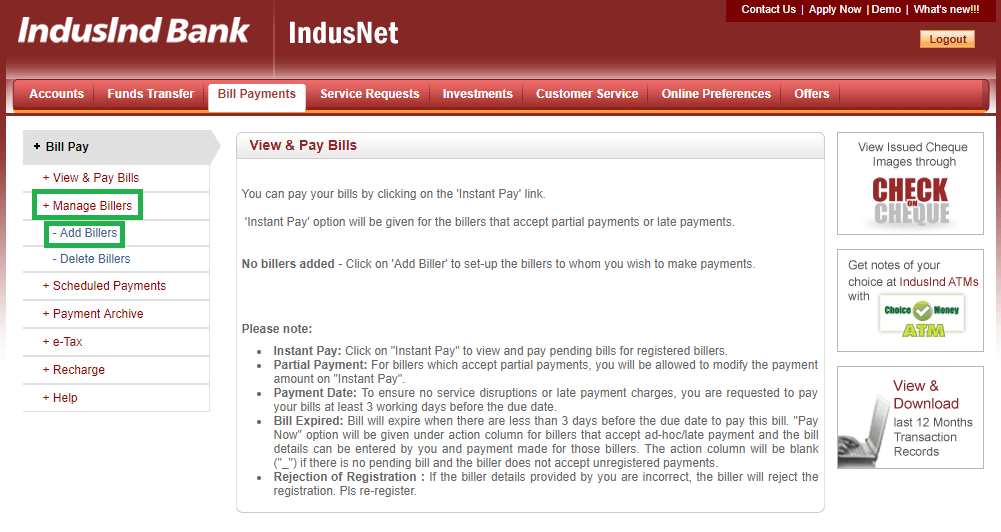
ബില്ലർ നിയന്ത്രിക്കുക ടാബിൽ ക്ലിക്ക് ചെയ്ത് ആഡ് ബില്ലർ ഓപ്ഷൻ തിരഞ്ഞെടുക്കുക
നിങ്ങൾ ബിൽ പേയ്മെന്റിൽ ക്ലിക്ക് ചെയ്തുകഴിഞ്ഞാൽ, ഒരു പുതിയ സ്ക്രീൻ തുറക്കുന്നു. ഈ സ്ക്രീനിൽ, നിങ്ങൾ ക്ലിക്ക് ചെയ്യണംബില്ലറുകൾ നിയന്ത്രിക്കുക സ്ക്രീനിന്റെ ഇടതുവശത്തുള്ള ടാബ്. ഒരിക്കൽ, നിങ്ങൾ ബില്ലർ നിയന്ത്രിക്കുക എന്ന ഓപ്ഷനിൽ ക്ലിക്ക് ചെയ്യുക, ടാബ് വികസിക്കുന്നു, ആ ടാബിൽ നിങ്ങൾ ക്ലിക്ക് ചെയ്യണംബില്ലറുകൾ ചേർക്കുക ഓപ്ഷൻ. ഈ ഘട്ടത്തിനായുള്ള ചിത്രം ചുവടെ നൽകിയിരിക്കുന്നു, അവിടെ ബില്ലറുകൾ നിയന്ത്രിക്കുക, ബില്ലറുകൾ ചേർക്കുക ഓപ്ഷൻ പച്ചയിൽ ഹൈലൈറ്റ് ചെയ്യുന്നു.
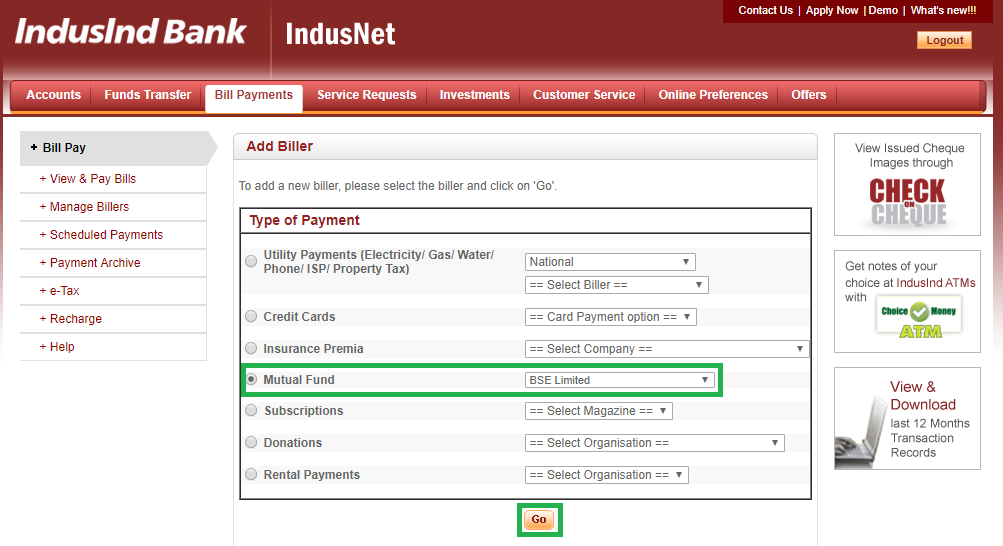
മ്യൂച്വൽ ഫണ്ട് ഓപ്ഷനിൽ ക്ലിക്ക് ചെയ്ത് ബിഎസ്ഇ ലിമിറ്റഡ് തിരഞ്ഞെടുക്കുക
ഒരിക്കൽ ക്ലിക്ക് ചെയ്യുകബില്ലർ ചേർക്കുക മുമ്പത്തെ ഘട്ടത്തിൽ, പേയ്മെന്റ് തരം കാണിക്കുന്ന ഒരു പുതിയ സ്ക്രീനിലേക്ക് നിങ്ങളെ റീഡയറക്ടുചെയ്യും. ഈ വിഭാഗത്തിൽ, യൂട്ടിലിറ്റി പേയ്മെന്റുകൾ പോലുള്ള വിവിധ ഓപ്ഷനുകൾ ഉണ്ട്,ക്രെഡിറ്റ് കാർഡുകൾ,ഇൻഷുറൻസ് പ്രീമിയവും അതിലേറെയും. ഈ വിഭാഗത്തിൽ, നിങ്ങൾ ക്ലിക്ക് ചെയ്യണംമ്യൂച്വൽ ഫണ്ട് ഓപ്ഷൻ തിരഞ്ഞെടുക്കുകബിഎസ്ഇ ലിമിറ്റഡ് അതിനടുത്തുള്ള ഡ്രോപ്പ് ഡൗണിൽ. തിരഞ്ഞെടുത്ത ശേഷംബിഎസ്ഇ ലിമിറ്റഡ് നിങ്ങൾ ക്ലിക്ക് ചെയ്യേണ്ട ഓപ്ഷൻപോകൂ ഓപ്ഷൻ. മ്യൂച്വൽ ഫണ്ട്, ബിഎസ്ഇ ലിമിറ്റഡ്, ഗോ ബട്ടൺ എന്നിവ പച്ചയിൽ ഹൈലൈറ്റ് ചെയ്തിരിക്കുന്ന ഈ ഘട്ടത്തിനായുള്ള ചിത്രം ചുവടെ നൽകിയിരിക്കുന്നു.
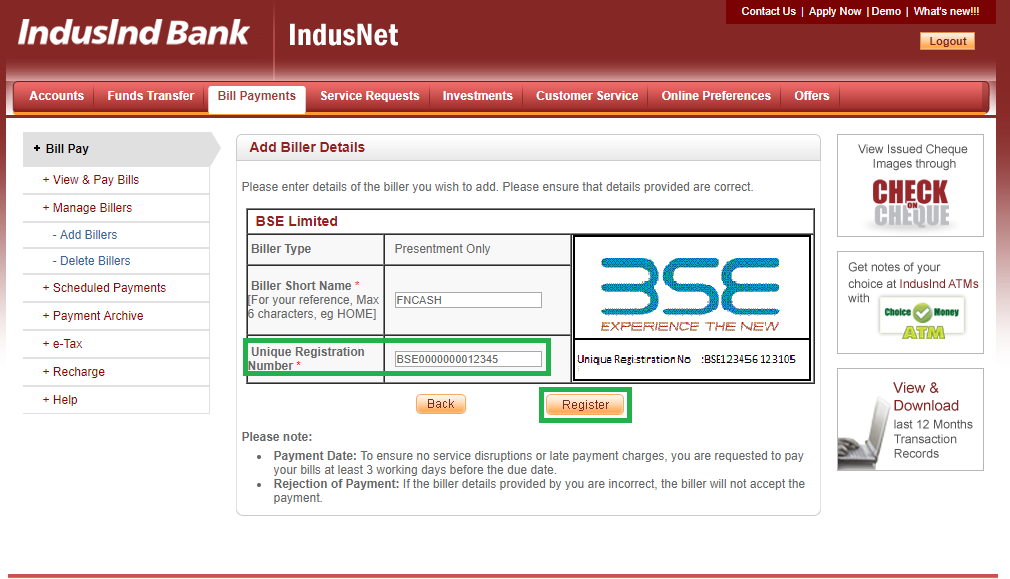
URN വിശദാംശങ്ങൾ നൽകുക
ആഡ് ബില്ലർ പ്രക്രിയയിലെ പ്രധാന ഘട്ടമാണിത്. നിങ്ങൾ Go-ൽ ക്ലിക്ക് ചെയ്തുകഴിഞ്ഞാൽ, ഈ ഘട്ടത്തിൽ, നിങ്ങളെ ഒരു പുതിയ സ്ക്രീനിലേക്ക് റീഡയറക്ടുചെയ്യും, അതിൽ നിങ്ങളുടെ URN ഉം മറ്റ് വിശദാംശങ്ങളും നൽകേണ്ടതുണ്ട്. നിങ്ങൾ പ്രാരംഭ പേയ്മെന്റ് നടത്തിക്കഴിഞ്ഞാൽ ഫിൻകാഷിൽ നിന്നുള്ള ഇമെയിൽ വഴി നിങ്ങളുടെ SIP-നായി ഈ URN നമ്പർ നിങ്ങൾക്ക് ലഭിക്കും. നിങ്ങൾക്ക് അത് ലഭിച്ചില്ലെങ്കിൽ, നിങ്ങൾക്ക് അത് കണ്ടെത്താനാകുംഎന്റെ SIP-കൾ section of your Fincash Account. URN ലഭിച്ച ശേഷം, നിങ്ങൾ അത് ഇവിടെ നൽകുകയും മറ്റ് വിശദാംശങ്ങൾ ചേർക്കുകയും വേണം. വിശദാംശങ്ങൾ നൽകിയ ശേഷം, നിങ്ങൾ ക്ലിക്ക് ചെയ്യണംരജിസ്റ്റർ ചെയ്യുക ഓപ്ഷൻ. URN വിശദാംശങ്ങളും രജിസ്റ്റർ ബട്ടണും പച്ചയിൽ ഹൈലൈറ്റ് ചെയ്തിരിക്കുന്ന ഈ ഘട്ടത്തിനായുള്ള ചിത്രം ചുവടെ നൽകിയിരിക്കുന്നു.
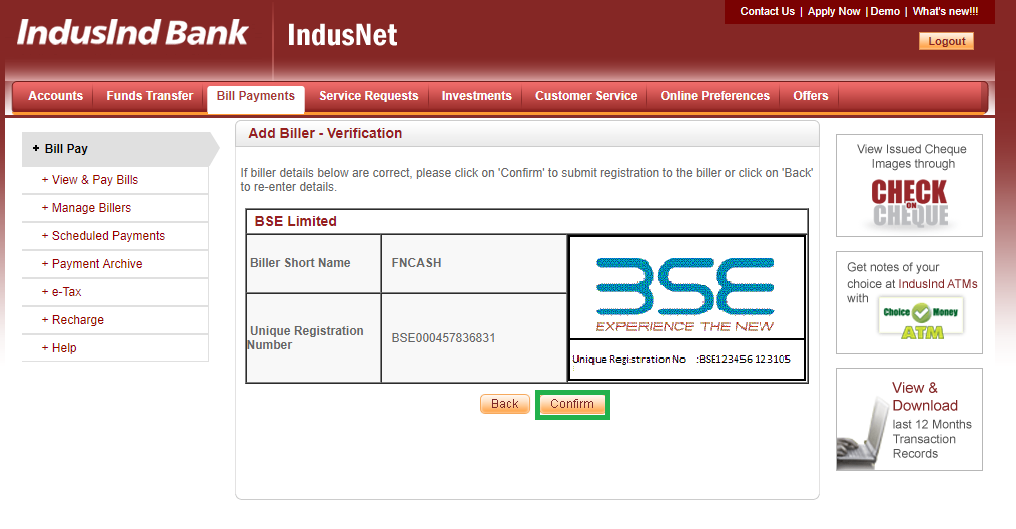
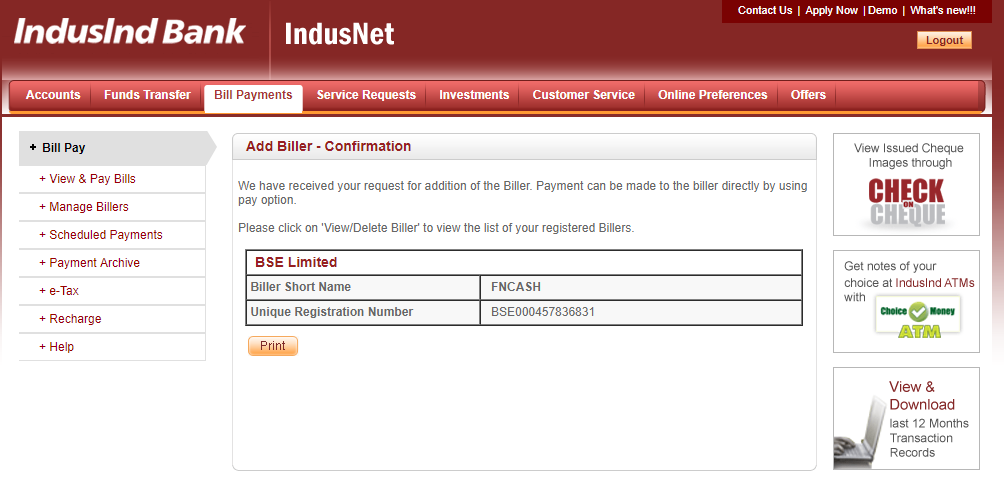
സംഗ്രഹ സ്ഥിരീകരണം
ഒരിക്കൽ ക്ലിക്ക് ചെയ്യുകരജിസ്റ്റർ ചെയ്യുക മുമ്പത്തെ ഘട്ടത്തിൽ, ഒരു പുതിയ സ്ക്രീൻ തുറക്കുന്നു, അതിൽ നൽകിയ വിശദാംശങ്ങളുടെ സംഗ്രഹം നിങ്ങൾക്ക് കാണാൻ കഴിയും. ഈ ഘട്ടത്തിൽ, നൽകിയ വിശദാംശങ്ങൾ ശരിയാണോ അല്ലയോ എന്ന് നിങ്ങൾ പരിശോധിക്കേണ്ടതുണ്ട്. വിശദാംശങ്ങൾ ഉപയോഗിച്ച് പരിശോധിച്ചുറപ്പിച്ചുകഴിഞ്ഞാൽ, നിങ്ങൾ ക്ലിക്ക് ചെയ്യേണ്ടതുണ്ട്സ്ഥിരീകരിക്കുക. ഈ ഘട്ടത്തിനായുള്ള ചിത്രം താഴെ നൽകിയിരിക്കുന്നുസ്ഥിരീകരിക്കുക ബട്ടൺ പച്ചയിൽ ഹൈലൈറ്റ് ചെയ്തിരിക്കുന്നു.
ബില്ലർ സ്ഥിരീകരണം
ഈ ഘട്ടത്തിൽ, നിങ്ങളുടെ ബില്ലർ വിജയകരമായി ചേർത്തതായി പ്രസ്താവിക്കുന്ന ബില്ലർ സ്ഥിരീകരണം നിങ്ങൾക്ക് ലഭിക്കും. ഈ ഘട്ടത്തിനായുള്ള ചിത്രം ചുവടെ നൽകിയിരിക്കുന്നു.
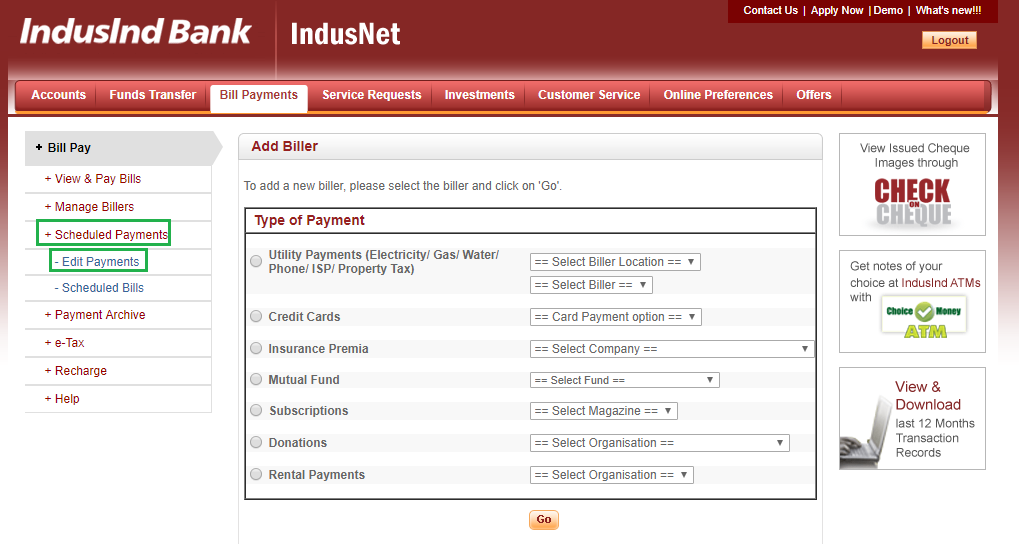
പേയ്മെന്റുകൾ ഷെഡ്യൂൾ ചെയ്യുക എന്നതിൽ ക്ലിക്ക് ചെയ്യുക & പേയ്മെന്റുകൾ എഡിറ്റ് ചെയ്യുക തിരഞ്ഞെടുക്കുക
ബില്ലർ ചേർക്കുന്നത് കൊണ്ട് നിങ്ങളുടെ ബില്ലർ ചേർക്കുന്ന പ്രക്രിയ അവസാനിക്കില്ല. നിങ്ങൾ ബില്ലർ വിജയകരമായി ചേർത്തുകഴിഞ്ഞാൽ, നിങ്ങൾ ക്ലിക്ക് ചെയ്യേണ്ടതുണ്ട്പേയ്മെന്റുകൾ ഷെഡ്യൂൾ ചെയ്യുക സ്ക്രീനിന്റെ ഇടതുവശത്തുള്ള ടാബ്. ഒരിക്കൽ നിങ്ങൾ ക്ലിക്ക് ചെയ്താൽ, അതിൽ ടാബ് വികസിക്കുകയും അതിനടിയിൽ ഒന്നിലധികം ഓപ്ഷനുകൾ കാണിക്കുകയും ചെയ്യുന്നു. ഇവിടെ, നിങ്ങൾ ക്ലിക്ക് ചെയ്യണംപേയ്മെന്റുകൾ എഡിറ്റ് ചെയ്യുക ഓപ്ഷൻ. ഈ ഘട്ടത്തിനായുള്ള ചിത്രം ചുവടെ നൽകിയിരിക്കുന്നു, അവിടെ ഷെഡ്യൂൾ പേയ്മെന്റ് ടാബും എഡിറ്റ് പേയ്മെന്റ് ഓപ്ഷനും പച്ചയിൽ ഹൈലൈറ്റ് ചെയ്തിരിക്കുന്നു.
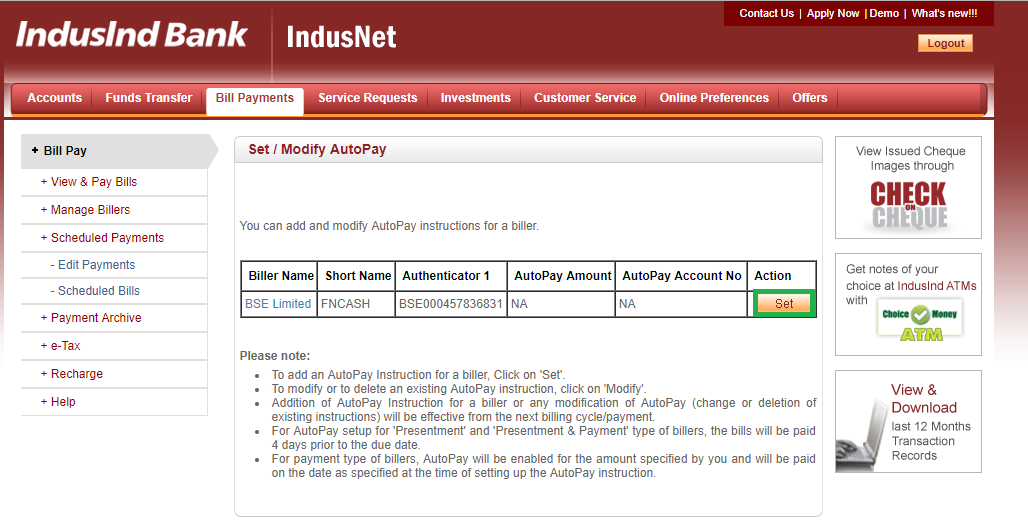
മോഡിഫൈ ഓട്ടോപേ സ്ക്രീനിൽ സെറ്റ് ഓപ്ഷൻ ക്ലിക്ക് ചെയ്യുക
ഒരിക്കൽ ക്ലിക്ക് ചെയ്യുകപേയ്മെന്റുകൾ എഡിറ്റ് ചെയ്യുക, ഒരു പുതിയ സ്ക്രീൻ തുറക്കുന്നു, അതിൽ നിങ്ങൾക്ക് മ്യൂച്വൽ ഫണ്ട് ബില്ലർ ചേർത്തിരിക്കുന്നത് കാണാം. ബില്ലറിന് എതിരെയുള്ള SIP-യുടെ URN നിങ്ങൾക്ക് കാണാം. ഇവിടെ, നിങ്ങൾ ക്ലിക്ക് ചെയ്യണംസജ്ജമാക്കുക മ്യൂച്വൽ ഫണ്ട് ബില്ലറിനെതിരായ ഓപ്ഷൻ. ഈ ഘട്ടത്തിനായുള്ള ചിത്രം ചുവടെ നൽകിയിരിക്കുന്നു, അവിടെ സെറ്റ് ഓപ്ഷൻ പച്ചയിൽ ഹൈലൈറ്റ് ചെയ്തിരിക്കുന്നു.
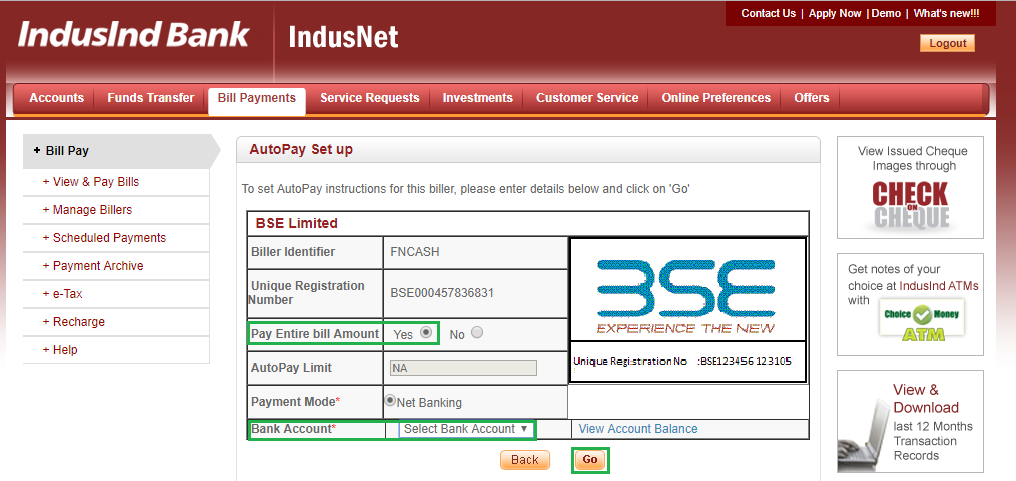
പേയ്മെന്റ് വിശദാംശങ്ങൾ നൽകി Go ക്ലിക്ക് ചെയ്യുക
ഈ ഘട്ടത്തിൽ, നിങ്ങൾ പേയ്മെന്റ് വിശദാംശങ്ങൾ നൽകേണ്ടതുണ്ട്. ഒരിക്കൽ ക്ലിക്ക് ചെയ്യുകസജ്ജമാക്കുക മുമ്പത്തെ ഘട്ടത്തിൽ, ഒരു പുതിയ സ്ക്രീൻ തുറക്കുന്നു, അതിൽ നിങ്ങൾ പേയ്മെന്റ് വിശദാംശങ്ങൾ നൽകേണ്ടതുണ്ട്. ഇവിടെ, എതിരായിമുഴുവൻ ബിൽ തുകയും അടയ്ക്കുക ഓപ്ഷൻ, നിങ്ങൾ തിരഞ്ഞെടുക്കേണ്ടതുണ്ട്അതെ ഓപ്ഷൻ. അതിനുശേഷം നിങ്ങൾ നെറ്റ് ബാങ്കിംഗ് ആയി പേയ്മെന്റ് മോഡ് തിരഞ്ഞെടുക്കേണ്ടതുണ്ട്. മാത്രമല്ല, നിങ്ങൾ പേയ്മെന്റുകൾ നടത്താൻ ആഗ്രഹിക്കുന്ന ബാങ്ക് അക്കൗണ്ട് നമ്പർ തിരഞ്ഞെടുക്കേണ്ടതുണ്ട്. എല്ലാ വിശദാംശങ്ങളും നൽകിയ ശേഷം, നിങ്ങൾ ക്ലിക്ക് ചെയ്യണംപോകൂ സ്ക്രീനിന്റെ താഴെയുള്ള ബട്ടൺ. ഈ ഘട്ടത്തിനായുള്ള ചിത്രം ചുവടെ നൽകിയിരിക്കുന്നു, അവിടെ മുഴുവൻ ബിൽ തുക അടയ്ക്കുക എന്ന ഓപ്ഷനും ബാങ്ക് അക്കൗണ്ട് ടാബും ഗോ ബട്ടണും പച്ചയിൽ ഹൈലൈറ്റ് ചെയ്തിരിക്കുന്നു.
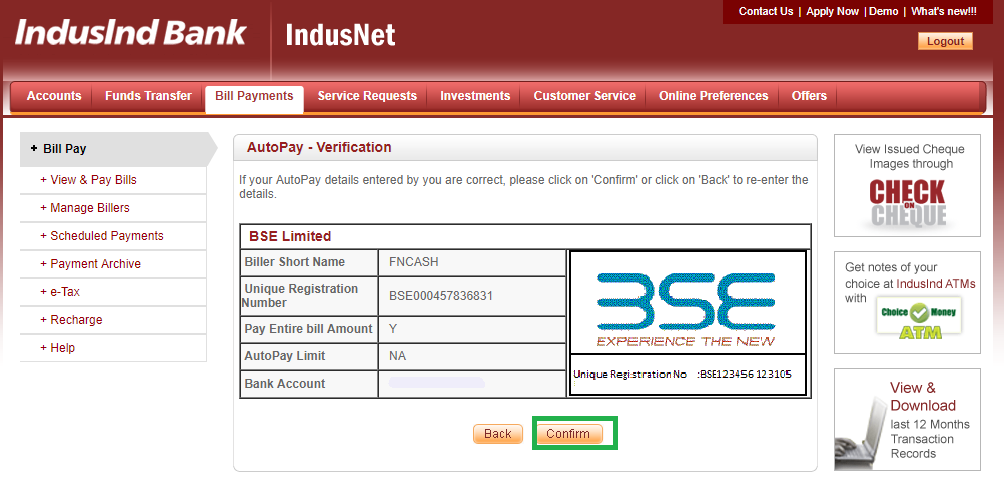
പേയ്മെന്റ് വിശദാംശങ്ങളുടെ പരിശോധന
ഒരിക്കൽ നിങ്ങൾ പേയ്മെന്റ് വിശദാംശങ്ങൾ നൽകി ക്ലിക്കുചെയ്യുകപോകൂ, നിങ്ങൾ നൽകിയ എല്ലാ വിശദാംശങ്ങളും പരിശോധിക്കാൻ കഴിയുന്ന ഒരു പുതിയ സ്ക്രീനിലേക്ക് നിങ്ങളെ റീഡയറക്ട് ചെയ്യുന്നു. എല്ലാ വിശദാംശങ്ങളും ശരിയായി നൽകിയിട്ടുണ്ടെന്ന് നിങ്ങൾ കണ്ടെത്തുകയാണെങ്കിൽ, നിങ്ങൾക്ക് ക്ലിക്ക് ചെയ്യാംസ്ഥിരീകരിക്കുക. ഇല്ലെങ്കിൽ, പിന്നിലേക്ക് ക്ലിക്ക് ചെയ്യുക, അതുവഴി നിങ്ങൾക്ക് പ്രസക്തമായ വിശദാംശങ്ങൾ എഡിറ്റുചെയ്യാനാകും. സ്ഥിരീകരിക്കുക ബട്ടൺ പച്ചയിൽ ഹൈലൈറ്റ് ചെയ്തിരിക്കുന്ന ഈ ഘട്ടത്തിനായുള്ള ചിത്രം ചുവടെ നൽകിയിരിക്കുന്നു.
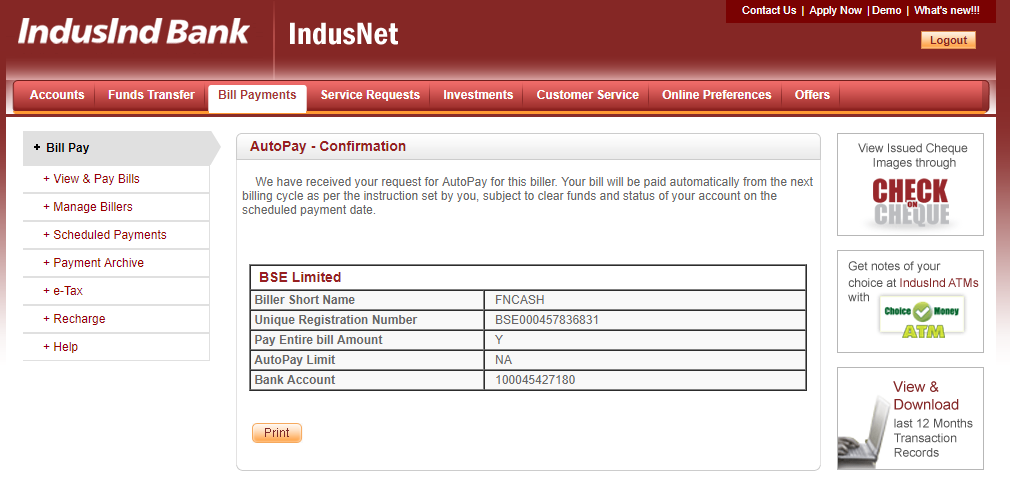
ഓട്ടോപേ വിശദാംശങ്ങളുടെ സ്ഥിരീകരണം
ഈ ഘട്ടത്തിൽ, നിങ്ങൾക്ക് ഓട്ടോപേ നിലയെക്കുറിച്ചുള്ള ഒരു സ്ഥിരീകരണം ലഭിക്കും. ഈ ഘട്ടത്തിനായുള്ള ചിത്രം ചുവടെ നൽകിയിരിക്കുന്നു.
അതിനാൽ, മുകളിലുള്ള ഘട്ടങ്ങളിൽ നിന്ന്, IndusInd ബാങ്കിലെ SIP ഇടപാടുകൾക്കായി ബില്ലർ ചേർക്കുന്ന പ്രക്രിയ ബുദ്ധിമുട്ടുള്ള കാര്യമല്ലെന്ന് പറയാം. ഇത് ചേർക്കുന്നതിലൂടെ, വ്യക്തികൾക്ക് അവരുടെ SIP കിഴിവുകൾ സമയബന്ധിതമായി നടക്കുന്നുണ്ടെന്ന് ഉറപ്പാക്കാൻ കഴിയും. അവരുടെ ബാങ്ക് അക്കൗണ്ടിൽ മതിയായ ബാലൻസ് ഉണ്ടെന്ന് ഉറപ്പുവരുത്തിയാൽ മതിയാകും.
മികച്ച വരുമാനം നേടുന്നതിന് നിക്ഷേപിക്കുന്നതിനുള്ള മികച്ച SIP-കൾ
അനുസരിച്ച് ശുപാർശ ചെയ്യുന്ന ചില SIP-കൾ ഇതാ5 വർഷം റിട്ടേണുകളും എയുഎം കൂടുതലും500 കോടി രൂപ
Fund NAV Net Assets (Cr) Min SIP Investment 3 MO (%) 6 MO (%) 1 YR (%) 3 YR (%) 5 YR (%) 2024 (%) ICICI Prudential Infrastructure Fund Growth ₹204.61
↑ 0.29 ₹8,351 100 3.8 5.4 2.5 20.9 23.3 6.7 SBI PSU Fund Growth ₹34.3974
↓ -0.06 ₹6,594 500 -3.5 0.6 6.6 25.6 23.1 11.3 LIC MF Infrastructure Fund Growth ₹54.3117
↓ -0.12 ₹1,099 1,000 7.8 13.3 7.7 25.5 22.8 -3.7 SBI Gold Fund Growth ₹41.0572
↑ 0.03 ₹16,533 500 -7.2 -1.6 42.4 31.8 22.5 71.5 DSP India T.I.G.E.R Fund Growth ₹361.563
↓ -0.05 ₹6,019 500 8.5 16.7 12.9 23.8 22.4 -2.5 Note: Returns up to 1 year are on absolute basis & more than 1 year are on CAGR basis. as on 16 Jul 26 Research Highlights & Commentary of 5 Funds showcased
Commentary ICICI Prudential Infrastructure Fund SBI PSU Fund LIC MF Infrastructure Fund SBI Gold Fund DSP India T.I.G.E.R Fund Point 1 Upper mid AUM (₹8,351 Cr). Lower mid AUM (₹6,594 Cr). Bottom quartile AUM (₹1,099 Cr). Highest AUM (₹16,533 Cr). Bottom quartile AUM (₹6,019 Cr). Point 2 Established history (20+ yrs). Established history (16+ yrs). Established history (18+ yrs). Established history (14+ yrs). Oldest track record among peers (22 yrs). Point 3 Rating: 3★ (upper mid). Rating: 2★ (lower mid). Not Rated. Rating: 2★ (bottom quartile). Top rated. Point 4 Risk profile: High. Risk profile: High. Risk profile: High. Risk profile: Moderately High. Risk profile: High. Point 5 5Y return: 23.34% (top quartile). 5Y return: 23.12% (upper mid). 5Y return: 22.85% (lower mid). 5Y return: 22.48% (bottom quartile). 5Y return: 22.44% (bottom quartile). Point 6 3Y return: 20.87% (bottom quartile). 3Y return: 25.60% (upper mid). 3Y return: 25.50% (lower mid). 3Y return: 31.84% (top quartile). 3Y return: 23.76% (bottom quartile). Point 7 1Y return: 2.54% (bottom quartile). 1Y return: 6.60% (bottom quartile). 1Y return: 7.66% (lower mid). 1Y return: 42.41% (top quartile). 1Y return: 12.85% (upper mid). Point 8 Alpha: 0.00 (lower mid). Alpha: 0.16 (upper mid). Alpha: 4.51 (top quartile). 1M return: -6.28% (bottom quartile). Alpha: 0.00 (bottom quartile). Point 9 Sharpe: 0.00 (bottom quartile). Sharpe: 0.26 (bottom quartile). Sharpe: 0.26 (lower mid). Alpha: 0.00 (bottom quartile). Sharpe: 0.48 (upper mid). Point 10 Information ratio: 0.00 (upper mid). Information ratio: -0.02 (bottom quartile). Information ratio: 0.55 (top quartile). Sharpe: 1.93 (top quartile). Information ratio: 0.00 (bottom quartile). ICICI Prudential Infrastructure Fund
SBI PSU Fund
LIC MF Infrastructure Fund
SBI Gold Fund
DSP India T.I.G.E.R Fund
To generate capital appreciation and income distribution to unit holders by investing predominantly in equity/equity related securities of the companies belonging to the infrastructure development and balance in debt securities and money market instruments. Below is the key information for ICICI Prudential Infrastructure Fund Returns up to 1 year are on The objective of the scheme would be to provide investors with opportunities for long-term growth in capital along with the liquidity of an open-ended scheme through an active management of investments in a diversified basket of equity stocks of domestic Public Sector Undertakings and in debt and money market instruments issued by PSUs AND others. Research Highlights for SBI PSU Fund Below is the key information for SBI PSU Fund Returns up to 1 year are on The investment objective of the scheme is to provide long term growth from a portfolio of equity / equity related instruments of companies engaged either directly or indirectly in the infrastructure sector. Research Highlights for LIC MF Infrastructure Fund Below is the key information for LIC MF Infrastructure Fund Returns up to 1 year are on The scheme seeks to provide returns that closely correspond to returns provided by SBI - ETF Gold (Previously known as SBI GETS). Research Highlights for SBI Gold Fund Below is the key information for SBI Gold Fund Returns up to 1 year are on To generate capital appreciation, from a portfolio that is substantially constituted of equity securities and equity related securities of corporates, which could benefit from structural changes brought about by continuing liberalization in economic policies by the government and/or continuing investments in infrastructure, both by the public and private sector. Research Highlights for DSP India T.I.G.E.R Fund Below is the key information for DSP India T.I.G.E.R Fund Returns up to 1 year are on 1. ICICI Prudential Infrastructure Fund
ICICI Prudential Infrastructure Fund
Growth Launch Date 31 Aug 05 NAV (16 Jul 26) ₹204.61 ↑ 0.29 (0.14 %) Net Assets (Cr) ₹8,351 on 31 May 26 Category Equity - Sectoral AMC ICICI Prudential Asset Management Company Limited Rating ☆☆☆ Risk High Expense Ratio 1.89 Sharpe Ratio 0 Information Ratio 0 Alpha Ratio 0 Min Investment 5,000 Min SIP Investment 100 Exit Load 0-1 Years (1%),1 Years and above(NIL) Growth of 10,000 investment over the years.
Date Value 30 Jun 21 ₹10,000 30 Jun 22 ₹11,534 30 Jun 23 ₹16,346 30 Jun 24 ₹27,296 30 Jun 25 ₹28,743 30 Jun 26 ₹29,425 Returns for ICICI Prudential Infrastructure Fund
absolute basis & more than 1 year are on CAGR (Compound Annual Growth Rate) basis. as on 16 Jul 26 Duration Returns 1 Month 1.6% 3 Month 3.8% 6 Month 5.4% 1 Year 2.5% 3 Year 20.9% 5 Year 23.3% 10 Year 15 Year Since launch 15.6% Historical performance (Yearly) on absolute basis
Year Returns 2024 6.7% 2023 27.4% 2022 44.6% 2021 28.8% 2020 50.1% 2019 3.6% 2018 2.6% 2017 -14% 2016 40.8% 2015 2% Fund Manager information for ICICI Prudential Infrastructure Fund
Name Since Tenure Ihab Dalwai 3 Jun 17 9.08 Yr. Sharmila D’mello 30 Jun 22 4.01 Yr. Data below for ICICI Prudential Infrastructure Fund as on 31 May 26
Equity Sector Allocation
Sector Value Industrials 47.57% Financial Services 10.57% Utility 10.32% Basic Materials 9.74% Real Estate 8.09% Energy 5.04% Consumer Cyclical 1.98% Communication Services 0.09% Asset Allocation
Asset Class Value Cash 5.83% Equity 94.17% Top Securities Holdings / Portfolio
Name Holding Value Quantity InterGlobe Aviation Ltd (Industrials)
Equity, Since 28 Feb 23 | INDIGO9% ₹745 Cr 1,691,985
↑ 50,000 Larsen & Toubro Ltd (Industrials)
Equity, Since 30 Nov 09 | LT7% ₹614 Cr 1,505,704 Oberoi Realty Ltd (Real Estate)
Equity, Since 31 May 23 | OBEROIRLTY4% ₹365 Cr 2,139,426 Gujarat Energy Ltd (Utilities)
Equity, Since 31 Jan 23 | GUJGASLTD4% ₹340 Cr 8,482,024
↑ 156,557 NTPC Ltd (Utilities)
Equity, Since 29 Feb 16 | NTPC4% ₹334 Cr 8,626,448 Shree Cement Ltd (Basic Materials)
Equity, Since 30 Apr 24 | SHREECEM3% ₹270 Cr 106,892
↑ 3,387 Kalpataru Projects International Ltd (Industrials)
Equity, Since 30 Sep 06 | KPIL3% ₹262 Cr 2,005,608 AIA Engineering Ltd (Industrials)
Equity, Since 28 Feb 21 | AIAENG3% ₹258 Cr 572,697 HDFC Bank Ltd (Financial Services)
Equity, Since 31 Jan 22 | HDFCBANK3% ₹250 Cr 3,357,506
↑ 1,057,506 Container Corporation of India Ltd (Industrials)
Equity, Since 31 Jan 16 | CONCOR3% ₹227 Cr 4,885,153 2. SBI PSU Fund
SBI PSU Fund
Growth Launch Date 7 Jul 10 NAV (16 Jul 26) ₹34.3974 ↓ -0.06 (-0.19 %) Net Assets (Cr) ₹6,594 on 31 May 26 Category Equity - Sectoral AMC SBI Funds Management Private Limited Rating ☆☆ Risk High Expense Ratio 1.89 Sharpe Ratio 0.26 Information Ratio -0.02 Alpha Ratio 0.16 Min Investment 5,000 Min SIP Investment 500 Exit Load 0-1 Years (1%),1 Years and above(NIL) Growth of 10,000 investment over the years.
Date Value 30 Jun 21 ₹10,000 30 Jun 22 ₹9,973 30 Jun 23 ₹13,609 30 Jun 24 ₹26,792 30 Jun 25 ₹26,602 30 Jun 26 ₹28,255 Returns for SBI PSU Fund
absolute basis & more than 1 year are on CAGR (Compound Annual Growth Rate) basis. as on 16 Jul 26 Duration Returns 1 Month -1.2% 3 Month -3.5% 6 Month 0.6% 1 Year 6.6% 3 Year 25.6% 5 Year 23.1% 10 Year 15 Year Since launch 8% Historical performance (Yearly) on absolute basis
Year Returns 2024 11.3% 2023 23.5% 2022 54% 2021 29% 2020 32.4% 2019 -10% 2018 6% 2017 -23.8% 2016 21.9% 2015 16.2% Fund Manager information for SBI PSU Fund
Name Since Tenure Rohit Shimpi 1 Jun 24 2.08 Yr. Data below for SBI PSU Fund as on 31 May 26
Equity Sector Allocation
Sector Value Financial Services 32.54% Utility 31.22% Industrials 14.07% Energy 11.97% Basic Materials 6.94% Asset Allocation
Asset Class Value Cash 3.18% Equity 96.74% Debt 0.07% Top Securities Holdings / Portfolio
Name Holding Value Quantity State Bank of India (Financial Services)
Equity, Since 31 Jul 10 | SBIN17% ₹1,112 Cr 11,527,500
↑ 1,000,000 GAIL (India) Ltd (Utilities)
Equity, Since 31 May 24 | GAIL10% ₹628 Cr 38,150,000 NTPC Ltd (Utilities)
Equity, Since 31 Jul 10 | NTPC9% ₹597 Cr 15,443,244 Bharat Electronics Ltd (Industrials)
Equity, Since 30 Jun 24 | BEL9% ₹583 Cr 14,185,000
↑ 800,000 Power Grid Corp Of India Ltd (Utilities)
Equity, Since 31 Jul 10 | POWERGRID9% ₹579 Cr 19,935,554 Oil & Natural Gas Corp Ltd (Energy)
Equity, Since 31 May 20 | ONGC6% ₹389 Cr 14,655,000 Bank of Baroda (Financial Services)
Equity, Since 31 Aug 24 | BANKBARODA5% ₹352 Cr 13,100,000 Bharat Petroleum Corp Ltd (Energy)
Equity, Since 31 Aug 24 | BPCL4% ₹289 Cr 9,700,000 Bharat Heavy Electricals Ltd (Industrials)
Equity, Since 30 Jun 25 | BHEL4% ₹271 Cr 6,500,000 NMDC Ltd (Basic Materials)
Equity, Since 31 Oct 23 | NMDC4% ₹245 Cr 27,900,000 3. LIC MF Infrastructure Fund
LIC MF Infrastructure Fund
Growth Launch Date 29 Feb 08 NAV (16 Jul 26) ₹54.3117 ↓ -0.12 (-0.22 %) Net Assets (Cr) ₹1,099 on 31 May 26 Category Equity - Sectoral AMC LIC Mutual Fund Asset Mgmt Co Ltd Rating Risk High Expense Ratio 2.21 Sharpe Ratio 0.26 Information Ratio 0.55 Alpha Ratio 4.51 Min Investment 5,000 Min SIP Investment 1,000 Exit Load 0-1 Years (1%),1 Years and above(NIL) Growth of 10,000 investment over the years.
Date Value 30 Jun 21 ₹10,000 30 Jun 22 ₹11,137 30 Jun 23 ₹14,179 30 Jun 24 ₹26,268 30 Jun 25 ₹26,896 30 Jun 26 ₹29,151 Returns for LIC MF Infrastructure Fund
absolute basis & more than 1 year are on CAGR (Compound Annual Growth Rate) basis. as on 16 Jul 26 Duration Returns 1 Month 1% 3 Month 7.8% 6 Month 13.3% 1 Year 7.7% 3 Year 25.5% 5 Year 22.8% 10 Year 15 Year Since launch 9.7% Historical performance (Yearly) on absolute basis
Year Returns 2024 -3.7% 2023 47.8% 2022 44.4% 2021 7.9% 2020 46.6% 2019 -0.1% 2018 13.3% 2017 -14.6% 2016 42.2% 2015 -2.2% Fund Manager information for LIC MF Infrastructure Fund
Name Since Tenure Sumit Bhatnagar 7 Apr 26 0.23 Yr. Mahesh Bendre 1 Jul 24 2 Yr. Data below for LIC MF Infrastructure Fund as on 31 May 26
Equity Sector Allocation
Sector Value Industrials 37.05% Consumer Cyclical 20.88% Basic Materials 12.42% Utility 11.88% Communication Services 5.02% Financial Services 3.98% Real Estate 1.97% Health Care 1.89% Technology 1.08% Asset Allocation
Asset Class Value Cash 3.82% Equity 96.18% Top Securities Holdings / Portfolio
Name Holding Value Quantity Larsen & Toubro Ltd (Industrials)
Equity, Since 30 Apr 09 | LT4% ₹44 Cr 106,968
↓ -10,884 Garware Hi-Tech Films Ltd (Basic Materials)
Equity, Since 31 Aug 23 | 5006554% ₹40 Cr 65,325
↓ -7,684 Tata Motors Passenger Vehicles Ltd (Consumer Cyclical)
Equity, Since 28 Feb 26 | TMPV4% ₹39 Cr 982,891
↓ -332,760 Tata Motors Ltd (Consumer Cyclical)
Equity, Since 31 Oct 25 | TMCV4% ₹39 Cr 1,015,933
↑ 26,983 Tata Power Co Ltd (Utilities)
Equity, Since 29 Feb 24 | TATAPOWER3% ₹36 Cr 861,040
↑ 524,312 KSH International Ltd (Industrials)
Equity, Since 31 Dec 25 | KSHINTL3% ₹34 Cr 432,816
↑ 6,280 Siemens Energy India Ltd (Utilities)
Equity, Since 31 Aug 25 | ENRIN3% ₹34 Cr 87,106
↑ 24,800 JSW Infrastructure Ltd (Industrials)
Equity, Since 30 Apr 26 | JSWINFRA3% ₹31 Cr 1,133,858
↑ 745,681 Carraro India Ltd (Consumer Cyclical)
Equity, Since 31 Dec 24 | CARRARO3% ₹31 Cr 572,991 Bharat Dynamics Ltd Ordinary Shares (Industrials)
Equity, Since 31 Jan 26 | BDL3% ₹29 Cr 242,954
↑ 157,744 4. SBI Gold Fund
SBI Gold Fund
Growth Launch Date 12 Sep 11 NAV (16 Jul 26) ₹41.0572 ↑ 0.03 (0.07 %) Net Assets (Cr) ₹16,533 on 31 May 26 Category Gold - Gold AMC SBI Funds Management Private Limited Rating ☆☆ Risk Moderately High Expense Ratio 0.3 Sharpe Ratio 1.93 Information Ratio 0 Alpha Ratio 0 Min Investment 5,000 Min SIP Investment 500 Exit Load 0-1 Years (1%),1 Years and above(NIL) Growth of 10,000 investment over the years.
Date Value 30 Jun 21 ₹10,000 30 Jun 22 ₹10,828 30 Jun 23 ₹12,154 30 Jun 24 ₹14,949 30 Jun 25 ₹19,644 30 Jun 26 ₹28,455 Returns for SBI Gold Fund
absolute basis & more than 1 year are on CAGR (Compound Annual Growth Rate) basis. as on 16 Jul 26 Duration Returns 1 Month -6.3% 3 Month -7.2% 6 Month -1.6% 1 Year 42.4% 3 Year 31.8% 5 Year 22.5% 10 Year 15 Year Since launch 10% Historical performance (Yearly) on absolute basis
Year Returns 2024 71.5% 2023 19.6% 2022 14.1% 2021 12.6% 2020 -5.7% 2019 27.4% 2018 22.8% 2017 6.4% 2016 3.5% 2015 10% Fund Manager information for SBI Gold Fund
Name Since Tenure Viral Chhadva 1 Mar 26 0.33 Yr. Data below for SBI Gold Fund as on 31 May 26
Asset Allocation
Asset Class Value Cash 1.64% Other 98.36% Top Securities Holdings / Portfolio
Name Holding Value Quantity SBI Gold ETF
- | -100% ₹16,542 Cr 1,246,686,194
↑ 13,950,000 Net Receivable / Payable
CBLO | -0% -₹55 Cr Treps
CBLO/Reverse Repo | -0% ₹45 Cr 5. DSP India T.I.G.E.R Fund
DSP India T.I.G.E.R Fund
Growth Launch Date 11 Jun 04 NAV (16 Jul 26) ₹361.563 ↓ -0.05 (-0.01 %) Net Assets (Cr) ₹6,019 on 31 May 26 Category Equity - Sectoral AMC DSP BlackRock Invmt Managers Pvt. Ltd. Rating ☆☆☆☆ Risk High Expense Ratio 1.89 Sharpe Ratio 0.48 Information Ratio 0 Alpha Ratio 0 Min Investment 1,000 Min SIP Investment 500 Exit Load 0-12 Months (1%),12 Months and above(NIL) Growth of 10,000 investment over the years.
Date Value 30 Jun 21 ₹10,000 30 Jun 22 ₹10,551 30 Jun 23 ₹14,508 30 Jun 24 ₹25,980 30 Jun 25 ₹25,049 30 Jun 26 ₹28,384 Returns for DSP India T.I.G.E.R Fund
absolute basis & more than 1 year are on CAGR (Compound Annual Growth Rate) basis. as on 16 Jul 26 Duration Returns 1 Month 1.8% 3 Month 8.5% 6 Month 16.7% 1 Year 12.9% 3 Year 23.8% 5 Year 22.4% 10 Year 15 Year Since launch 17.6% Historical performance (Yearly) on absolute basis
Year Returns 2024 -2.5% 2023 32.4% 2022 49% 2021 13.9% 2020 51.6% 2019 2.7% 2018 6.7% 2017 -17.2% 2016 47% 2015 4.1% Fund Manager information for DSP India T.I.G.E.R Fund
Name Since Tenure Rohit Singhania 21 Jun 10 16.04 Yr. Data below for DSP India T.I.G.E.R Fund as on 31 May 26
Equity Sector Allocation
Sector Value Industrials 28.69% Basic Materials 13.29% Energy 9.47% Utility 9.46% Financial Services 8.49% Consumer Cyclical 6.52% Health Care 6.13% Communication Services 2.58% Technology 1.52% Real Estate 1.49% Consumer Defensive 0.71% Asset Allocation
Asset Class Value Cash 11.66% Equity 88.34% Top Securities Holdings / Portfolio
Name Holding Value Quantity Reliance Industries Ltd (Energy)
Equity, Since 31 Aug 19 | RELIANCE4% ₹262 Cr 1,983,815
↑ 1,304,235 NTPC Ltd (Utilities)
Equity, Since 30 Nov 17 | NTPC4% ₹249 Cr 6,433,748
↓ -94,844 Apollo Hospitals Enterprise Ltd (Healthcare)
Equity, Since 31 Dec 24 | APOLLOHOSP4% ₹247 Cr 301,630 Larsen & Toubro Ltd (Industrials)
Equity, Since 30 Jun 04 | LT4% ₹240 Cr 588,665 Kirloskar Oil Engines Ltd (Industrials)
Equity, Since 31 Mar 23 | 5332933% ₹161 Cr 834,973 Bharti Airtel Ltd (Communication Services)
Equity, Since 31 Oct 18 | BHARTIARTL3% ₹155 Cr 849,969 Coal India Ltd (Energy)
Equity, Since 31 Dec 23 | COALINDIA3% ₹154 Cr 3,352,298
↑ 647,118 INOX India Ltd (Industrials)
Equity, Since 31 Dec 23 | INOXINDIA2% ₹139 Cr 931,429
↓ -9,412 UltraTech Cement Ltd (Basic Materials)
Equity, Since 31 Dec 14 | ULTRACEMCO2% ₹135 Cr 118,010
↑ 51,464 Hindustan Aeronautics Ltd Ordinary Shares (Industrials)
Equity, Since 31 Oct 25 | HAL2% ₹131 Cr 305,098
കൂടുതൽ ചോദ്യങ്ങളുണ്ടെങ്കിൽ, നിങ്ങൾക്ക് 8451864111 എന്ന നമ്പറിൽ ഏതെങ്കിലും പ്രവൃത്തി ദിവസങ്ങളിൽ രാവിലെ 9.30 മുതൽ വൈകിട്ട് 6.30 വരെ ഞങ്ങളെ ബന്ധപ്പെടാം അല്ലെങ്കിൽ എപ്പോൾ വേണമെങ്കിലും ഞങ്ങൾക്ക് ഒരു മെയിൽ എഴുതുക.support@fincash.com അല്ലെങ്കിൽ ഞങ്ങളുടെ വെബ്സൈറ്റിൽ ലോഗിൻ ചെയ്ത് ഞങ്ങളുമായി ചാറ്റ് ചെയ്യുകwww.fincash.com.
ഇവിടെ നൽകിയിരിക്കുന്ന വിവരങ്ങൾ കൃത്യമാണെന്ന് ഉറപ്പാക്കാൻ എല്ലാ ശ്രമങ്ങളും നടത്തിയിട്ടുണ്ട്. എന്നിരുന്നാലും, ഡാറ്റയുടെ കൃത്യത സംബന്ധിച്ച് യാതൊരു ഉറപ്പും നൽകുന്നില്ല. എന്തെങ്കിലും നിക്ഷേപം നടത്തുന്നതിന് മുമ്പ് സ്കീം വിവര രേഖ ഉപയോഗിച്ച് പരിശോധിക്കുക.
")


AMFI Registration No. 112358 | CIN: U74999MH2016PTC282153
Shepard Technologies Pvt. Ltd. (with ARN code 112358) makes no warranties or representations, express or implied, on products offered through the platform. It accepts no liability for any damages or losses, however caused, in connection with the use of, or on the reliance of its product or related services. Terms and conditions of the website are applicable.
©2026 Shepard Technologies Private Limited. All Rights Reserved
Research Highlights for ICICI Prudential Infrastructure Fund