 +91-22-48913909
Table of Contents
- എന്തുകൊണ്ട് മികച്ച 11 SIP ഫണ്ടുകളിൽ നിക്ഷേപിക്കണം?
- എസ്ഐപിയിൽ എങ്ങനെ നിക്ഷേപിക്കാം?
- ഇന്ത്യയിലെ ഏറ്റവും മികച്ച 11 SIP മ്യൂച്വൽ ഫണ്ടുകൾ FY 22 - 23
- മികച്ച ചിട്ടയായ നിക്ഷേപ പദ്ധതികളിൽ നിക്ഷേപിക്കുമ്പോൾ പരിഗണിക്കേണ്ട പാരാമീറ്ററുകൾ
- SIP MF ഓൺലൈനിൽ എങ്ങനെ നിക്ഷേപിക്കാം?
- പതിവുചോദ്യങ്ങൾ
- 1. മ്യൂച്വൽ ഫണ്ടുകൾ എന്തൊക്കെയാണ്?
- 2. മ്യൂച്വൽ ഫണ്ടുകളുടെ വ്യത്യസ്ത തരം ഏതൊക്കെയാണ്?
- 3. വളർച്ചാ ഇക്വിറ്റി ഫണ്ടുകൾ എന്തൊക്കെയാണ്?
- 4. എന്തുകൊണ്ടാണ് നിങ്ങൾ ഒരു ഡെറ്റ് ഫണ്ടിൽ നിക്ഷേപിക്കേണ്ടത്?
- 5. നിങ്ങൾ എന്തിന് SIP-കളിൽ നിക്ഷേപിക്കണം?
- 6. നികുതി ലാഭിക്കുന്ന മ്യൂച്വൽ ഫണ്ടിൽ നിക്ഷേപിക്കുന്നത് എന്തുകൊണ്ട്?
- 7. മ്യൂച്വൽ ഫണ്ടുകളിൽ നിക്ഷേപിക്കാൻ എനിക്ക് ഒരു ബ്രോക്കറെ ആവശ്യമുണ്ടോ?
Top 11 Funds
- Invesco India Infrastructure Fund
- ICICI Prudential Infrastructure Fund
- Invesco India PSU Equity Fund
- Nippon India Power and Infra Fund
- BOI AXA Manufacturing and Infrastructure Fund
- Kotak Small Cap Fund
- Motilal Oswal Midcap 30 Fund
- DSP BlackRock India T.I.G.E.R Fund
- ICICI Prudential Smallcap Fund
- TATA Infrastructure Fund
- SBI Infrastructure Fund
SIP 2022-നുള്ള 11 മികച്ച മ്യൂച്വൽ ഫണ്ടുകൾ
എസ്.ഐ.പി മ്യൂച്വൽ ഫണ്ടുകൾ (അല്ലെങ്കിൽ മികച്ച 11 എസ്ഐപി മ്യൂച്വൽ ഫണ്ടുകൾ) സ്റ്റോക്ക് മാർക്കറ്റിന്റെ അനിവാര്യമായ ഉയർച്ച താഴ്ചകളിൽ നാഡീ വിൽപന ഒഴിവാക്കാൻ ആനുകാലിക നിക്ഷേപത്തിന്റെ ലളിതമായ സൂത്രവാക്യം പാലിക്കുന്ന ഫണ്ടുകളാണ്.
സാധാരണ, SIP അല്ലെങ്കിൽ സിസ്റ്റമാറ്റിക്നിക്ഷേപ പദ്ധതി മ്യൂച്വൽ ഫണ്ടുകളിൽ പണം നിക്ഷേപിക്കുന്നതിനുള്ള ഒരു മോഡാണ്.നിക്ഷേപിക്കുന്നു മികച്ച 11 എസ്ഐപി മ്യൂച്വൽ ഫണ്ടുകളിൽ നിങ്ങളുടെ നിക്ഷേപത്തിന് ചിട്ടയായതും അച്ചടക്കമുള്ളതുമായ ഒരു സമീപനം നൽകുന്നു. ദിവസേനയുള്ള നിങ്ങളുടെ നിക്ഷേപം നിയന്ത്രിക്കാനുള്ള നിങ്ങളുടെ ശ്രമത്തെ ഇത് കുറയ്ക്കുന്നുഅടിസ്ഥാനം. മാത്രമല്ല, ഇത് ലിവറേജ് വാഗ്ദാനം ചെയ്യുന്നുസംയുക്തത്തിന്റെ ശക്തി കാലക്രമേണ ആവശ്യമുള്ള വരുമാനത്തിലേക്ക് നയിക്കുന്നു.

വ്യത്യസ്തങ്ങളുണ്ട്മ്യൂച്വൽ ഫണ്ടുകളുടെ തരങ്ങൾ ഇക്വിറ്റി, ഡെറ്റ്, ബാലൻസ്ഡ്, അൾട്രാ- എന്നിവ ഉൾപ്പെടുന്ന എസ്ഐപിക്ക്ഹ്രസ്വകാല ഫണ്ടുകൾ, മുതലായവ. എന്നിരുന്നാലും, ഒരു SIP വഴി നിക്ഷേപിക്കുമ്പോൾ ഇക്വിറ്റി മ്യൂച്വൽ ഫണ്ടുകൾ പരമാവധി വരുമാനം വാഗ്ദാനം ചെയ്യുന്നു. നിക്ഷേപകർ നിക്ഷേപം നടത്തണമെന്ന് സാമ്പത്തിക ഉപദേഷ്ടാക്കൾ നിർദ്ദേശിക്കുന്നുമികച്ച മ്യൂച്വൽ ഫണ്ടുകൾ എസ്ഐപിയുടെ അടിസ്ഥാനത്തിൽ അവരുടെ നിക്ഷേപ ലക്ഷ്യങ്ങളും കാലയളവുംSIP നിക്ഷേപം.
എന്തുകൊണ്ട് മികച്ച 11 SIP ഫണ്ടുകളിൽ നിക്ഷേപിക്കണം?
മ്യൂച്വൽ ഫണ്ടുകളിൽ നിക്ഷേപിക്കുന്നതിന് എസ്ഐപികൾ അച്ചടക്കമുള്ള സമീപനം നൽകുന്നു
ചിട്ടയായ നിക്ഷേപം ഭാവി സ്വപ്നത്തിനും റിട്ടയർമെന്റ്, കുട്ടിയുടെ കരിയർ, വീട്, കാർ അല്ലെങ്കിൽ മറ്റേതെങ്കിലും ആസ്തികൾ വാങ്ങൽ തുടങ്ങിയ പ്രധാന ലക്ഷ്യങ്ങൾക്കും ധനസഹായം നൽകുന്നു.
എസ്ഐപികൾ കോമ്പൗണ്ടിംഗ് പരമാവധി പ്രയോജനപ്പെടുത്താൻ സഹായിക്കുന്നു, മാത്രമല്ല യുവ നിക്ഷേപകർക്ക് അനുയോജ്യവുമാണ്
വ്യവസ്ഥാപിത നിക്ഷേപ പദ്ധതികൾ ഇക്വിറ്റി ഏറ്റക്കുറച്ചിലുകളുടെ അപകടസാധ്യത കുറയ്ക്കുന്നു
എസ്ഐപിയിൽ എങ്ങനെ നിക്ഷേപിക്കാം?
പണം നിക്ഷേപിക്കുന്നത് ഒരു കലയാണ്, അത് ശരിയായി ചെയ്താൽ അത് അത്ഭുതങ്ങൾ സൃഷ്ടിക്കും. ഇപ്പോൾ നിങ്ങൾക്കറിയാംടോപ്പ് SIP അതിൽ എങ്ങനെ നിക്ഷേപിക്കണമെന്ന് നിങ്ങൾ അറിഞ്ഞിരിക്കേണ്ട പദ്ധതികൾ. എസ്ഐപിയിൽ നിക്ഷേപിക്കുന്നതിനുള്ള ഘട്ടങ്ങൾ ഞങ്ങൾ ചുവടെ സൂചിപ്പിച്ചിട്ടുണ്ട്.
1. നിങ്ങളുടെ സാമ്പത്തിക ലക്ഷ്യങ്ങൾ വിശകലനം ചെയ്യുക
നിങ്ങൾക്ക് അനുയോജ്യമായ ഒരു SIP നിക്ഷേപം തിരഞ്ഞെടുക്കുകസാമ്പത്തിക ലക്ഷ്യങ്ങൾ. ഉദാഹരണത്തിന്, നിങ്ങളുടെ ലക്ഷ്യം ഹ്രസ്വകാലമാണെങ്കിൽ (അടുത്ത 2 വർഷത്തിനുള്ളിൽ ഒരു കാർ വാങ്ങണമെങ്കിൽ), നിങ്ങൾ ഡെറ്റ് മ്യൂച്വൽ ഫണ്ടുകളിൽ നിക്ഷേപിക്കണം. കൂടാതെ, നിങ്ങളുടെ ലക്ഷ്യം ദീർഘകാലമാണെങ്കിൽ (ഇത് പോലെവിരമിക്കൽ ആസൂത്രണം) തുടർന്ന് ഇക്വിറ്റി മ്യൂച്വൽ ഫണ്ടുകളിൽ നിക്ഷേപിക്കാൻ മുൻഗണന നൽകുക.
2. നിക്ഷേപത്തിന്റെ ഒരു ടൈംലൈൻ തിരഞ്ഞെടുക്കുക
ഒരു നിശ്ചിത സമയത്തേക്ക് നിങ്ങൾ ശരിയായ തുക നിക്ഷേപിക്കുന്നുവെന്ന് ഇത് ഉറപ്പാക്കും.
3. നിങ്ങൾ പ്രതിമാസം നിക്ഷേപിക്കാൻ ആഗ്രഹിക്കുന്ന തുക തീരുമാനിക്കുക
എസ്ഐപി പ്രതിമാസ നിക്ഷേപമായതിനാൽ, പ്രതിമാസം നിക്ഷേപിക്കാൻ കഴിയുന്ന തുക നിങ്ങൾ തിരഞ്ഞെടുക്കണംപരാജയപ്പെടുക. നിങ്ങളുടെ ലക്ഷ്യം അനുസരിച്ച് നിങ്ങൾക്ക് അനുയോജ്യമായ തുക കണക്കാക്കാനും കഴിയുംസിപ്പ് കാൽക്കുലേറ്റർ അല്ലെങ്കിൽ SIP റിട്ടേൺ കാൽക്കുലേറ്റർ.
4. മികച്ച SIP പ്ലാൻ തിരഞ്ഞെടുക്കുക
കൺസൾട്ട് ചെയ്തുകൊണ്ട് ബുദ്ധിപരമായ നിക്ഷേപ തിരഞ്ഞെടുപ്പ് നടത്തുക aസാമ്പത്തിക ഉപദേഷ്ടാവ് അല്ലെങ്കിൽ തിരഞ്ഞെടുക്കുന്നതിലൂടെമികച്ച SIP പ്ലാനുകൾ വിവിധ ഓൺലൈൻ നിക്ഷേപ പ്ലാറ്റ്ഫോമുകൾ വാഗ്ദാനം ചെയ്യുന്നു.
Talk to our investment specialist
ഇന്ത്യയിലെ ഏറ്റവും മികച്ച 11 SIP മ്യൂച്വൽ ഫണ്ടുകൾ FY 22 - 23
The Scheme seeks to provide long term capital appreciation by investing in a portfolio that is predominantly constituted of equity and equity related instruments of infrastructure companies. However, there can be no assurance that the investment objective of the Scheme will be achieved. Invesco India Infrastructure Fund is a Equity - Sectoral fund was launched on 21 Nov 07. It is a fund with High risk and has given a Below is the key information for Invesco India Infrastructure Fund Returns up to 1 year are on To generate capital appreciation and income distribution to unit holders by investing predominantly in equity/equity related securities of the companies belonging to the infrastructure development and balance in debt securities and money market instruments. ICICI Prudential Infrastructure Fund is a Equity - Sectoral fund was launched on 31 Aug 05. It is a fund with High risk and has given a Below is the key information for ICICI Prudential Infrastructure Fund Returns up to 1 year are on To generate capital appreciation by investing in Equity and Equity Related Instruments of companies where the Central / State Government(s) has majority shareholding or management control or has powers to appoint majority of directors. However, there is no assurance or guarantee that the investment objective of the Scheme will be achieved. The Scheme does not assure or guarantee any returns. Invesco India PSU Equity Fund is a Equity - Sectoral fund was launched on 18 Nov 09. It is a fund with High risk and has given a Below is the key information for Invesco India PSU Equity Fund Returns up to 1 year are on (Erstwhile Reliance Diversified Power Sector Fund) The primary investment objective of the scheme is to generate long term capital appreciation by investing predominantly in equity and equity related securities of companies in the power sector. Nippon India Power and Infra Fund is a Equity - Sectoral fund was launched on 8 May 04. It is a fund with High risk and has given a Below is the key information for Nippon India Power and Infra Fund Returns up to 1 year are on The Scheme seeks to generate long term capital appreciation through a portfolio of predominantly equity and equity related securities of companies engaged in manufacturing and infrastructure and related sectors. Further, there can be no assurance that the investment objectives of the scheme will be realized. The Scheme is not providing any assured or guaranteed returns BOI AXA Manufacturing and Infrastructure Fund is a Equity - Sectoral fund was launched on 5 Mar 10. It is a fund with High risk and has given a Below is the key information for BOI AXA Manufacturing and Infrastructure Fund Returns up to 1 year are on (Erstwhile Kotak Midcap Scheme) The investment objective of the Scheme is to generate capital appreciation from a diversified portfolio of equity and equity related securities. Kotak Small Cap Fund is a Equity - Small Cap fund was launched on 24 Feb 05. It is a fund with Moderately High risk and has given a Below is the key information for Kotak Small Cap Fund Returns up to 1 year are on (Erstwhile Motilal Oswal MOSt Focused Midcap 30 Fund) The investment objective of the Scheme is to achieve long term capital appreciation by investing in a maximum of 30 quality mid-cap companies having long-term competitive advantages and potential for growth. However, there can be no assurance or guarantee that the investment objective of the Scheme would be achieved. Motilal Oswal Midcap 30 Fund is a Equity - Mid Cap fund was launched on 24 Feb 14. It is a fund with Moderately High risk and has given a Below is the key information for Motilal Oswal Midcap 30 Fund Returns up to 1 year are on To generate capital appreciation, from a portfolio that is substantially constituted of equity securities and equity related securities of corporates, which could benefit from structural changes brought about by continuing liberalization in economic policies by the government and/or continuing investments in infrastructure, both by the public and private sector. DSP BlackRock India T.I.G.E.R Fund is a Equity - Sectoral fund was launched on 11 Jun 04. It is a fund with High risk and has given a Below is the key information for DSP BlackRock India T.I.G.E.R Fund Returns up to 1 year are on (Erstwhile ICICI Prudential Indo Asia Equity Fund) ICICI Prudential Indo Asia Equity Fund is an OE equity scheme that seeks to generate long term capital appreciation by investing in equity, equity related securities and or share classes/units of equity funds of companies, which are incorporated or have their area of primary activity, in the Asia Pacific region. Initially the Scheme will invest in share classes of International Opportunities Fund Asian Equity Fund and thereafter the Fund Manager of the Indo Asia Equity Fund may choose to make investment in listed equity shares, securities in the Asia Pacific region. However, there can be no assurance that the investment objective of the Scheme will be realized. ICICI Prudential Smallcap Fund is a Equity - Small Cap fund was launched on 18 Oct 07. It is a fund with Moderately High risk and has given a Below is the key information for ICICI Prudential Smallcap Fund Returns up to 1 year are on To provide income distribution and / or medium to long term capital gains by investing predominantly in equity / equity related instruments of the companies in the infrastructure sector. TATA Infrastructure Fund is a Equity - Sectoral fund was launched on 31 Dec 04. It is a fund with High risk and has given a Below is the key information for TATA Infrastructure Fund Returns up to 1 year are on To provide investors with opportunities for long-term growth in capital through an active management of investments in a diversified basket of equity stocks of companies directly or indirectly involved in the infrastructure growth in the Indian economy and in debt & money market instruments. SBI Infrastructure Fund is a Equity - Sectoral fund was launched on 6 Jul 07. It is a fund with High risk and has given a Below is the key information for SBI Infrastructure Fund Returns up to 1 year are on Fund NAV Net Assets (Cr) Min SIP Investment 3 MO (%) 6 MO (%) 1 YR (%) 3 YR (%) 5 YR (%) 2023 (%) Invesco India Infrastructure Fund Growth ₹58.28
↑ 0.48 ₹961 500 11.5 45.2 73.9 36.2 28.4 51.1 ICICI Prudential Infrastructure Fund Growth ₹174.7
↑ 0.16 ₹5,186 100 12.4 42.5 66.2 41.6 28 44.6 Invesco India PSU Equity Fund Growth ₹59.56
↑ 0.18 ₹859 500 15.7 55.8 86.9 39 27.9 54.5 Nippon India Power and Infra Fund Growth ₹326.816
↑ 0.20 ₹4,529 100 11.8 44.4 77 39.6 27.4 58 BOI AXA Manufacturing and Infrastructure Fund Growth ₹51.36
↑ 0.04 ₹256 1,000 11.5 36.8 62.8 31.5 27.4 44.7 Kotak Small Cap Fund Growth ₹232.884
↑ 0.70 ₹13,882 1,000 4.2 21.1 41.9 23.7 27 34.8 Motilal Oswal Midcap 30 Fund Growth ₹82.9292
↑ 0.02 ₹8,987 500 11.9 33.8 61.3 36.6 26.9 41.7 DSP BlackRock India T.I.G.E.R Fund Growth ₹293.985
↑ 2.30 ₹3,364 500 15.1 44.8 76 38.4 26.7 49 ICICI Prudential Smallcap Fund Growth ₹79.44
↑ 0.46 ₹7,173 100 2.7 20.6 45.7 28.9 26.4 37.9 TATA Infrastructure Fund Growth ₹176.716
↑ 1.08 ₹1,885 150 13.9 41.8 70.1 35.8 26.2 45.1 SBI Infrastructure Fund Growth ₹47.7941
↑ 0.02 ₹2,432 500 10.2 36.6 67.4 35.1 25.9 49.7 Note: Returns up to 1 year are on absolute basis & more than 1 year are on CAGR basis. as on 30 Apr 24 200 കോടി മ്യൂച്വൽ ഫണ്ടുകളുടെ ഇക്വിറ്റി വിഭാഗത്തിൽ 5 വർഷത്തെ കലണ്ടർ വർഷ റിട്ടേണുകളെ അടിസ്ഥാനമാക്കി ഓർഡർ ചെയ്യുന്നു.1. Invesco India Infrastructure Fund
CAGR/Annualized return of 11.3% since its launch. Ranked 24 in Sectoral category. Return for 2023 was 51.1% , 2022 was 2.3% and 2021 was 55.4% . Invesco India Infrastructure Fund
Growth Launch Date 21 Nov 07 NAV (30 Apr 24) ₹58.28 ↑ 0.48 (0.83 %) Net Assets (Cr) ₹961 on 31 Mar 24 Category Equity - Sectoral AMC Invesco Asset Management (India) Private Ltd Rating ☆☆☆ Risk High Expense Ratio 2.49 Sharpe Ratio 3.65 Information Ratio 0 Alpha Ratio 0 Min Investment 5,000 Min SIP Investment 500 Exit Load 0-1 Years (1%),1 Years and above(NIL) Growth of 10,000 investment over the years.
Date Value 30 Apr 19 ₹10,000 30 Apr 20 ₹9,295 30 Apr 21 ₹13,802 30 Apr 22 ₹18,326 30 Apr 23 ₹20,036 30 Apr 24 ₹34,836 Returns for Invesco India Infrastructure Fund
absolute basis & more than 1 year are on CAGR (Compound Annual Growth Rate) basis. as on 30 Apr 24 Duration Returns 1 Month 6.6% 3 Month 11.5% 6 Month 45.2% 1 Year 73.9% 3 Year 36.2% 5 Year 28.4% 10 Year 15 Year Since launch 11.3% Historical performance (Yearly) on absolute basis
Year Returns 2023 51.1% 2022 2.3% 2021 55.4% 2020 16.2% 2019 6.1% 2018 -15.8% 2017 48.1% 2016 0.8% 2015 -2.6% 2014 83.6% Fund Manager information for Invesco India Infrastructure Fund
Name Since Tenure Amit Nigam 3 Sep 20 3.58 Yr. Data below for Invesco India Infrastructure Fund as on 31 Mar 24
Equity Sector Allocation
Sector Value Industrials 47.58% Utility 22.85% Basic Materials 9.5% Health Care 4.32% Energy 3.41% Consumer Cyclical 2.97% Financial Services 2.47% Technology 1.74% Communication Services 1.29% Real Estate 1.07% Asset Allocation
Asset Class Value Cash 2.79% Equity 97.21% Top Securities Holdings / Portfolio
Name Holding Value Quantity Larsen & Toubro Ltd (Industrials)
Equity, Since 29 Feb 12 | LT7% ₹64 Cr 169,760 Power Grid Corp Of India Ltd (Utilities)
Equity, Since 30 Apr 22 | 5328986% ₹62 Cr 2,234,017 Tata Power Co Ltd (Utilities)
Equity, Since 31 Jan 21 | 5004004% ₹40 Cr 1,019,084 Gujarat State Petronet Ltd (Utilities)
Equity, Since 30 Nov 22 | 5327024% ₹38 Cr 1,061,584 GAIL (India) Ltd (Utilities)
Equity, Since 31 Jan 23 | 5321554% ₹35 Cr 1,946,687 Bharat Petroleum Corp Ltd (Energy)
Equity, Since 31 Jan 23 | 5005473% ₹33 Cr 543,643 Bharat Electronics Ltd (Industrials)
Equity, Since 30 Nov 17 | BEL3% ₹33 Cr 1,623,224 Thermax Ltd (Industrials)
Equity, Since 30 Jun 21 | THERMAX3% ₹32 Cr 76,244 Suzlon Energy Ltd (Industrials)
Equity, Since 31 Aug 23 | 5326673% ₹28 Cr 7,038,755
↑ 2,121,098 Container Corporation of India Ltd (Industrials)
Equity, Since 31 Mar 17 | 5313443% ₹28 Cr 312,742 2. ICICI Prudential Infrastructure Fund
CAGR/Annualized return of 16.6% since its launch. Ranked 27 in Sectoral category. Return for 2023 was 44.6% , 2022 was 28.8% and 2021 was 50.1% . ICICI Prudential Infrastructure Fund
Growth Launch Date 31 Aug 05 NAV (30 Apr 24) ₹174.7 ↑ 0.16 (0.09 %) Net Assets (Cr) ₹5,186 on 31 Mar 24 Category Equity - Sectoral AMC ICICI Prudential Asset Management Company Limited Rating ☆☆☆ Risk High Expense Ratio 2.22 Sharpe Ratio 3.64 Information Ratio 0 Alpha Ratio 0 Min Investment 5,000 Min SIP Investment 100 Exit Load 0-1 Years (1%),1 Years and above(NIL) Growth of 10,000 investment over the years.
Date Value 30 Apr 19 ₹10,000 30 Apr 20 ₹7,227 30 Apr 21 ₹12,079 30 Apr 22 ₹16,844 30 Apr 23 ₹20,652 30 Apr 24 ₹34,329 Returns for ICICI Prudential Infrastructure Fund
absolute basis & more than 1 year are on CAGR (Compound Annual Growth Rate) basis. as on 30 Apr 24 Duration Returns 1 Month 5.8% 3 Month 12.4% 6 Month 42.5% 1 Year 66.2% 3 Year 41.6% 5 Year 28% 10 Year 15 Year Since launch 16.6% Historical performance (Yearly) on absolute basis
Year Returns 2023 44.6% 2022 28.8% 2021 50.1% 2020 3.6% 2019 2.6% 2018 -14% 2017 40.8% 2016 2% 2015 -3.4% 2014 56.2% Fund Manager information for ICICI Prudential Infrastructure Fund
Name Since Tenure Ihab Dalwai 3 Jun 17 6.83 Yr. Sharmila D’mello 30 Jun 22 1.76 Yr. Data below for ICICI Prudential Infrastructure Fund as on 31 Mar 24
Equity Sector Allocation
Sector Value Industrials 30.27% Financial Services 18.01% Basic Materials 15.02% Utility 13.03% Energy 8.19% Consumer Cyclical 2.8% Real Estate 2.17% Communication Services 1.99% Asset Allocation
Asset Class Value Cash 7.68% Equity 91.48% Debt 0.84% Top Securities Holdings / Portfolio
Name Holding Value Quantity NTPC Ltd (Utilities)
Equity, Since 29 Feb 16 | 5325557% ₹340 Cr 10,112,000
↓ -600,000 HDFC Bank Ltd (Financial Services)
Equity, Since 31 Jan 22 | HDFCBANK5% ₹262 Cr 1,809,500
↑ 110,000 ICICI Bank Ltd (Financial Services)
Equity, Since 31 Dec 16 | ICICIBANK5% ₹250 Cr 2,290,000 Larsen & Toubro Ltd (Industrials)
Equity, Since 30 Nov 09 | LT5% ₹241 Cr 640,393
↓ -120,000 InterGlobe Aviation Ltd (Industrials)
Equity, Since 28 Feb 23 | INDIGO4% ₹200 Cr 563,217
↑ 253,315 Kalpataru Projects International Ltd (Industrials)
Equity, Since 30 Sep 06 | 5222873% ₹179 Cr 1,670,581
↓ -174,407 Grasim Industries Ltd (Basic Materials)
Equity, Since 31 Aug 23 | GRASIM3% ₹169 Cr 739,601 Gujarat Gas Ltd (Utilities)
Equity, Since 31 Jan 23 | 5393363% ₹158 Cr 2,894,977
↑ 50,531 NCC Ltd (Industrials)
Equity, Since 31 Aug 21 | NCC3% ₹154 Cr 6,607,507
↓ -292,493 Cummins India Ltd (Industrials)
Equity, Since 31 May 17 | 5004802% ₹125 Cr 415,782 3. Invesco India PSU Equity Fund
CAGR/Annualized return of 13.1% since its launch. Ranked 33 in Sectoral category. Return for 2023 was 54.5% , 2022 was 20.5% and 2021 was 31.1% . Invesco India PSU Equity Fund
Growth Launch Date 18 Nov 09 NAV (30 Apr 24) ₹59.56 ↑ 0.18 (0.30 %) Net Assets (Cr) ₹859 on 31 Mar 24 Category Equity - Sectoral AMC Invesco Asset Management (India) Private Ltd Rating ☆☆☆ Risk High Expense Ratio 2.46 Sharpe Ratio 3.07 Information Ratio -1.18 Alpha Ratio -0.44 Min Investment 5,000 Min SIP Investment 500 Exit Load 0-1 Years (1%),1 Years and above(NIL) Growth of 10,000 investment over the years.
Date Value 30 Apr 19 ₹10,000 30 Apr 20 ₹9,782 30 Apr 21 ₹12,732 30 Apr 22 ₹15,408 30 Apr 23 ₹18,289 30 Apr 24 ₹34,191 Returns for Invesco India PSU Equity Fund
absolute basis & more than 1 year are on CAGR (Compound Annual Growth Rate) basis. as on 30 Apr 24 Duration Returns 1 Month 8.4% 3 Month 15.7% 6 Month 55.8% 1 Year 86.9% 3 Year 39% 5 Year 27.9% 10 Year 15 Year Since launch 13.1% Historical performance (Yearly) on absolute basis
Year Returns 2023 54.5% 2022 20.5% 2021 31.1% 2020 6.1% 2019 10.1% 2018 -16.9% 2017 24.3% 2016 17.9% 2015 2.5% 2014 54.5% Fund Manager information for Invesco India PSU Equity Fund
Name Since Tenure Dhimant Kothari 19 May 20 3.87 Yr. Data below for Invesco India PSU Equity Fund as on 31 Mar 24
Equity Sector Allocation
Sector Value Industrials 28.41% Financial Services 25.67% Utility 25.61% Energy 17.26% Asset Allocation
Asset Class Value Cash 3.05% Equity 96.95% Top Securities Holdings / Portfolio
Name Holding Value Quantity Bharat Electronics Ltd (Industrials)
Equity, Since 31 Mar 17 | BEL9% ₹77 Cr 3,801,222 NTPC Ltd (Utilities)
Equity, Since 31 May 19 | 5325559% ₹76 Cr 2,254,157 State Bank of India (Financial Services)
Equity, Since 28 Feb 21 | SBIN9% ₹75 Cr 990,944
↑ 15,318 Hindustan Aeronautics Ltd Ordinary Shares (Industrials)
Equity, Since 31 May 22 | 5411549% ₹74 Cr 221,859
↑ 64,215 Coal India Ltd (Energy)
Equity, Since 31 Aug 23 | COALINDIA8% ₹70 Cr 1,612,886
↑ 86,457 Power Grid Corp Of India Ltd (Utilities)
Equity, Since 28 Feb 22 | 5328987% ₹63 Cr 2,261,566
↑ 134,899 NHPC Ltd (Utilities)
Equity, Since 31 Oct 22 | 5330986% ₹49 Cr 5,435,618 Bharat Petroleum Corp Ltd (Energy)
Equity, Since 30 Sep 18 | 5005475% ₹42 Cr 699,865
↓ -133,222 Bank of Baroda (Financial Services)
Equity, Since 30 Jun 21 | 5321344% ₹38 Cr 1,431,527 Container Corporation of India Ltd (Industrials)
Equity, Since 31 Mar 17 | 5313444% ₹34 Cr 386,333 4. Nippon India Power and Infra Fund
CAGR/Annualized return of 19.1% since its launch. Ranked 13 in Sectoral category. Return for 2023 was 58% , 2022 was 10.9% and 2021 was 48.9% . Nippon India Power and Infra Fund
Growth Launch Date 8 May 04 NAV (30 Apr 24) ₹326.816 ↑ 0.20 (0.06 %) Net Assets (Cr) ₹4,529 on 31 Mar 24 Category Equity - Sectoral AMC Nippon Life Asset Management Ltd. Rating ☆☆☆☆ Risk High Expense Ratio 2.23 Sharpe Ratio 3.98 Information Ratio 1.48 Alpha Ratio 11.98 Min Investment 5,000 Min SIP Investment 100 Exit Load 0-1 Years (1%),1 Years and above(NIL) Growth of 10,000 investment over the years.
Date Value 30 Apr 19 ₹10,000 30 Apr 20 ₹7,554 30 Apr 21 ₹12,336 30 Apr 22 ₹15,736 30 Apr 23 ₹18,958 30 Apr 24 ₹33,554 Returns for Nippon India Power and Infra Fund
absolute basis & more than 1 year are on CAGR (Compound Annual Growth Rate) basis. as on 30 Apr 24 Duration Returns 1 Month 5.6% 3 Month 11.8% 6 Month 44.4% 1 Year 77% 3 Year 39.6% 5 Year 27.4% 10 Year 15 Year Since launch 19.1% Historical performance (Yearly) on absolute basis
Year Returns 2023 58% 2022 10.9% 2021 48.9% 2020 10.8% 2019 -2.9% 2018 -21.1% 2017 61.7% 2016 0.1% 2015 0.3% 2014 50.8% Fund Manager information for Nippon India Power and Infra Fund
Name Since Tenure Sanjay Doshi 2 Jan 17 7.25 Yr. Kinjal Desai 25 May 18 5.86 Yr. Data below for Nippon India Power and Infra Fund as on 31 Mar 24
Equity Sector Allocation
Sector Value Industrials 39.87% Utility 14.35% Basic Materials 8.87% Energy 7.65% Communication Services 6.96% Consumer Cyclical 6.08% Technology 4.64% Real Estate 4.13% Health Care 2.39% Asset Allocation
Asset Class Value Cash 5.06% Equity 94.94% Top Securities Holdings / Portfolio
Name Holding Value Quantity Larsen & Toubro Ltd (Industrials)
Equity, Since 30 Nov 07 | LT6% ₹282 Cr 750,000 Reliance Industries Ltd (Energy)
Equity, Since 30 Nov 18 | RELIANCE6% ₹275 Cr 925,000 NTPC Ltd (Utilities)
Equity, Since 31 May 09 | 5325556% ₹269 Cr 8,000,000
↑ 1,000,000 Bosch Ltd (Consumer Cyclical)
Equity, Since 31 Aug 21 | 5005305% ₹240 Cr 80,000
↓ -3,500 UltraTech Cement Ltd (Basic Materials)
Equity, Since 31 Oct 19 | ULTRACEMCO5% ₹205 Cr 210,000 Kaynes Technology India Ltd (Industrials)
Equity, Since 30 Nov 22 | 5436644% ₹201 Cr 700,000
↑ 30,000 Bharti Airtel Ltd (Communication Services)
Equity, Since 30 Apr 18 | BHARTIARTL4% ₹184 Cr 1,500,000 Honeywell Automation India Ltd (Industrials)
Equity, Since 31 Jan 24 | 5171743% ₹151 Cr 39,000
↑ 3,000 Carborundum Universal Ltd (Industrials)
Equity, Since 30 Sep 23 | 5133753% ₹146 Cr 1,150,000
↑ 581,749 Cyient DLM Ltd (Technology)
Equity, Since 31 Jul 23 | 5439333% ₹137 Cr 1,900,000
↑ 191,331 5. BOI AXA Manufacturing and Infrastructure Fund
CAGR/Annualized return of 12.3% since its launch. Return for 2023 was 44.7% , 2022 was 3.3% and 2021 was 52.5% . BOI AXA Manufacturing and Infrastructure Fund
Growth Launch Date 5 Mar 10 NAV (30 Apr 24) ₹51.36 ↑ 0.04 (0.08 %) Net Assets (Cr) ₹256 on 31 Mar 24 Category Equity - Sectoral AMC BOI AXA Investment Mngrs Private Ltd Rating Risk High Expense Ratio 2.55 Sharpe Ratio 3.79 Information Ratio 0 Alpha Ratio 0 Min Investment 5,000 Min SIP Investment 1,000 Exit Load 0-1 Years (1%),1 Years and above(NIL) Growth of 10,000 investment over the years.
Date Value 30 Apr 19 ₹10,000 30 Apr 20 ₹8,885 30 Apr 21 ₹14,729 30 Apr 22 ₹18,604 30 Apr 23 ₹20,581 30 Apr 24 ₹33,503 Returns for BOI AXA Manufacturing and Infrastructure Fund
absolute basis & more than 1 year are on CAGR (Compound Annual Growth Rate) basis. as on 30 Apr 24 Duration Returns 1 Month 7.4% 3 Month 11.5% 6 Month 36.8% 1 Year 62.8% 3 Year 31.5% 5 Year 27.4% 10 Year 15 Year Since launch 12.3% Historical performance (Yearly) on absolute basis
Year Returns 2023 44.7% 2022 3.3% 2021 52.5% 2020 28.1% 2019 2.5% 2018 -22.8% 2017 56% 2016 1% 2015 0.3% 2014 54.1% Fund Manager information for BOI AXA Manufacturing and Infrastructure Fund
Name Since Tenure Nitin Gosar 27 Sep 22 1.51 Yr. Data below for BOI AXA Manufacturing and Infrastructure Fund as on 31 Mar 24
Equity Sector Allocation
Sector Value Industrials 21.67% Basic Materials 15.53% Consumer Cyclical 14.28% Energy 14.22% Health Care 9.54% Utility 6.08% Communication Services 5.19% Consumer Defensive 4.46% Real Estate 2.89% Technology 1.28% Asset Allocation
Asset Class Value Cash 4.83% Equity 95.13% Debt 0.04% Top Securities Holdings / Portfolio
Name Holding Value Quantity Reliance Industries Ltd (Energy)
Equity, Since 31 Oct 20 | RELIANCE8% ₹21 Cr 69,156 Larsen & Toubro Ltd (Industrials)
Equity, Since 31 Mar 10 | LT7% ₹19 Cr 50,207 NTPC Ltd (Utilities)
Equity, Since 31 May 21 | 5325555% ₹12 Cr 370,539 Hero MotoCorp Ltd (Consumer Cyclical)
Equity, Since 30 Nov 23 | HEROMOTOCO4% ₹10 Cr 22,106 Indus Towers Ltd Ordinary Shares (Communication Services)
Equity, Since 31 Jan 24 | 5348163% ₹8 Cr 275,782 Sun Pharmaceuticals Industries Ltd (Healthcare)
Equity, Since 31 Aug 22 | SUNPHARMA3% ₹8 Cr 47,707 Maruti Suzuki India Ltd (Consumer Cyclical)
Equity, Since 31 Jul 23 | MARUTI2% ₹6 Cr 4,816 Oil India Ltd (Energy)
Equity, Since 31 Dec 23 | 5331062% ₹6 Cr 99,102 ITD Cementation India Ltd (Industrials)
Equity, Since 31 Dec 22 | 5094962% ₹6 Cr 177,327
↓ -3,233 Ashok Leyland Ltd (Industrials)
Equity, Since 31 Dec 22 | 5004772% ₹5 Cr 320,461 6. Kotak Small Cap Fund
CAGR/Annualized return of 17.8% since its launch. Ranked 23 in Small Cap category. Return for 2023 was 34.8% , 2022 was -3.1% and 2021 was 70.9% . Kotak Small Cap Fund
Growth Launch Date 24 Feb 05 NAV (30 Apr 24) ₹232.884 ↑ 0.70 (0.30 %) Net Assets (Cr) ₹13,882 on 31 Mar 24 Category Equity - Small Cap AMC Kotak Mahindra Asset Management Co Ltd Rating ☆☆☆ Risk Moderately High Expense Ratio 1.48 Sharpe Ratio 2.13 Information Ratio -0.79 Alpha Ratio -6.19 Min Investment 5,000 Min SIP Investment 1,000 Exit Load 0-1 Years (1%),1 Years and above(NIL) Growth of 10,000 investment over the years.
Date Value 30 Apr 19 ₹10,000 30 Apr 20 ₹8,344 30 Apr 21 ₹17,453 30 Apr 22 ₹23,228 30 Apr 23 ₹23,292 30 Apr 24 ₹33,056 Returns for Kotak Small Cap Fund
absolute basis & more than 1 year are on CAGR (Compound Annual Growth Rate) basis. as on 30 Apr 24 Duration Returns 1 Month 7.1% 3 Month 4.2% 6 Month 21.1% 1 Year 41.9% 3 Year 23.7% 5 Year 27% 10 Year 15 Year Since launch 17.8% Historical performance (Yearly) on absolute basis
Year Returns 2023 34.8% 2022 -3.1% 2021 70.9% 2020 34.2% 2019 5% 2018 -17.3% 2017 44% 2016 8.9% 2015 7.4% 2014 74% Fund Manager information for Kotak Small Cap Fund
Name Since Tenure Arjun Khanna 30 Apr 22 1.92 Yr. Harish Bihani 20 Oct 23 0.45 Yr. Data below for Kotak Small Cap Fund as on 31 Mar 24
Equity Sector Allocation
Sector Value Industrials 37.83% Consumer Cyclical 21.66% Basic Materials 17.01% Health Care 8.15% Consumer Defensive 3.49% Financial Services 3.18% Technology 2.65% Real Estate 1.81% Communication Services 0.92% Asset Allocation
Asset Class Value Cash 2.83% Equity 97.17% Top Securities Holdings / Portfolio
Name Holding Value Quantity Cyient Ltd (Industrials)
Equity, Since 31 Dec 19 | CYIENT4% ₹602 Cr 3,013,563 Carborundum Universal Ltd (Industrials)
Equity, Since 30 Jun 18 | 5133754% ₹507 Cr 4,000,051 Blue Star Ltd (Industrials)
Equity, Since 31 May 18 | BLUESTARCO3% ₹416 Cr 3,264,838
↓ -100,000 Century Plyboards (India) Ltd (Basic Materials)
Equity, Since 31 Oct 18 | 5325483% ₹407 Cr 6,353,571
↑ 15,809 Ratnamani Metals & Tubes Ltd (Basic Materials)
Equity, Since 31 Jan 18 | 5201113% ₹371 Cr 1,328,764
↑ 70,000 Alembic Pharmaceuticals Ltd (Healthcare)
Equity, Since 31 Jan 22 | 5335732% ₹339 Cr 3,441,355 Techno Electric & Engineering Co Ltd (Industrials)
Equity, Since 31 Dec 18 | 5421412% ₹323 Cr 4,184,629 Solar Industries India Ltd (Basic Materials)
Equity, Since 31 Aug 11 | SOLARINDS2% ₹313 Cr 356,620 Garware Technical Fibres Ltd (Consumer Cyclical)
Equity, Since 30 Jun 21 | 5095572% ₹294 Cr 885,547 Galaxy Surfactants Ltd (Basic Materials)
Equity, Since 31 Jan 18 | 5409352% ₹288 Cr 1,268,161 7. Motilal Oswal Midcap 30 Fund
CAGR/Annualized return of 23.1% since its launch. Ranked 27 in Mid Cap category. Return for 2023 was 41.7% , 2022 was 10.7% and 2021 was 55.8% . Motilal Oswal Midcap 30 Fund
Growth Launch Date 24 Feb 14 NAV (30 Apr 24) ₹82.9292 ↑ 0.02 (0.02 %) Net Assets (Cr) ₹8,987 on 31 Mar 24 Category Equity - Mid Cap AMC Motilal Oswal Asset Management Co. Ltd Rating ☆☆☆ Risk Moderately High Expense Ratio 1.45 Sharpe Ratio 3.98 Information Ratio 1.03 Alpha Ratio 18.76 Min Investment 5,000 Min SIP Investment 500 Exit Load 0-1 Years (1%),1 Years and above(NIL) Growth of 10,000 investment over the years.
Date Value 30 Apr 19 ₹10,000 30 Apr 20 ₹8,186 30 Apr 21 ₹12,917 30 Apr 22 ₹18,440 30 Apr 23 ₹20,416 30 Apr 24 ₹32,923 Returns for Motilal Oswal Midcap 30 Fund
absolute basis & more than 1 year are on CAGR (Compound Annual Growth Rate) basis. as on 30 Apr 24 Duration Returns 1 Month 4.7% 3 Month 11.9% 6 Month 33.8% 1 Year 61.3% 3 Year 36.6% 5 Year 26.9% 10 Year 15 Year Since launch 23.1% Historical performance (Yearly) on absolute basis
Year Returns 2023 41.7% 2022 10.7% 2021 55.8% 2020 9.3% 2019 9.7% 2018 -12.7% 2017 30.8% 2016 5.2% 2015 16.5% 2014 Fund Manager information for Motilal Oswal Midcap 30 Fund
Name Since Tenure Niket Shah 1 Jul 20 3.75 Yr. Ankush Sood 11 Nov 22 1.39 Yr. Rakesh Shetty 22 Nov 22 1.36 Yr. Data below for Motilal Oswal Midcap 30 Fund as on 31 Mar 24
Equity Sector Allocation
Sector Value Technology 19.44% Industrials 19% Consumer Cyclical 18.26% Financial Services 12.18% Real Estate 7.56% Health Care 7.38% Communication Services 5.81% Basic Materials 3.84% Asset Allocation
Asset Class Value Cash 6.54% Equity 93.46% Top Securities Holdings / Portfolio
Name Holding Value Quantity Jio Financial Services Ltd (Financial Services)
Equity, Since 31 Aug 23 | 54394012% ₹1,061 Cr 30,000,000 Kalyan Jewellers India Ltd (Consumer Cyclical)
Equity, Since 29 Feb 24 | 54327810% ₹877 Cr 20,500,000 Persistent Systems Ltd (Technology)
Equity, Since 31 Jan 23 | PERSISTENT9% ₹797 Cr 2,000,000
↑ 50,000 Tube Investments of India Ltd Ordinary Shares (Industrials)
Equity, Since 31 Jul 20 | 5407628% ₹753 Cr 2,015,172
↓ -9,828 Prestige Estates Projects Ltd (Real Estate)
Equity, Since 31 Jul 23 | 5332746% ₹527 Cr 4,500,000 Coforge Ltd (Technology)
Equity, Since 31 Mar 23 | 5325416% ₹495 Cr 900,000
↑ 100,000 Balkrishna Industries Ltd (Consumer Cyclical)
Equity, Since 28 Feb 23 | BALKRISIND4% ₹400 Cr 1,725,000 Indus Towers Ltd Ordinary Shares (Communication Services)
Equity, Since 31 Mar 24 | 5348164% ₹390 Cr 13,383,920
↑ 13,383,920 CG Power & Industrial Solutions Ltd (Industrials)
Equity, Since 31 Mar 21 | 5000934% ₹371 Cr 6,850,000
↓ -3,150,000 Max Healthcare Institute Ltd Ordinary Shares (Healthcare)
Equity, Since 31 Mar 24 | 5432204% ₹369 Cr 4,500,000
↑ 4,500,000 8. DSP BlackRock India T.I.G.E.R Fund
CAGR/Annualized return of 18.5% since its launch. Ranked 12 in Sectoral category. Return for 2023 was 49% , 2022 was 13.9% and 2021 was 51.6% . DSP BlackRock India T.I.G.E.R Fund
Growth Launch Date 11 Jun 04 NAV (30 Apr 24) ₹293.985 ↑ 2.30 (0.79 %) Net Assets (Cr) ₹3,364 on 31 Mar 24 Category Equity - Sectoral AMC DSP BlackRock Invmt Managers Pvt. Ltd. Rating ☆☆☆☆ Risk High Expense Ratio 2.24 Sharpe Ratio 3.25 Information Ratio 0 Alpha Ratio 0 Min Investment 1,000 Min SIP Investment 500 Exit Load 0-12 Months (1%),12 Months and above(NIL) Growth of 10,000 investment over the years.
Date Value 30 Apr 19 ₹10,000 30 Apr 20 ₹7,567 30 Apr 21 ₹12,300 30 Apr 22 ₹16,181 30 Apr 23 ₹18,542 30 Apr 24 ₹32,640 Returns for DSP BlackRock India T.I.G.E.R Fund
absolute basis & more than 1 year are on CAGR (Compound Annual Growth Rate) basis. as on 30 Apr 24 Duration Returns 1 Month 10.8% 3 Month 15.1% 6 Month 44.8% 1 Year 76% 3 Year 38.4% 5 Year 26.7% 10 Year 15 Year Since launch 18.5% Historical performance (Yearly) on absolute basis
Year Returns 2023 49% 2022 13.9% 2021 51.6% 2020 2.7% 2019 6.7% 2018 -17.2% 2017 47% 2016 4.1% 2015 0.7% 2014 61.3% Fund Manager information for DSP BlackRock India T.I.G.E.R Fund
Name Since Tenure Rohit Singhania 21 Jun 10 13.79 Yr. Jay Kothari 16 Mar 18 6.05 Yr. Charanjit Singh 1 Jan 21 3.25 Yr. Data below for DSP BlackRock India T.I.G.E.R Fund as on 31 Mar 24
Equity Sector Allocation
Sector Value Industrials 45.73% Basic Materials 18.71% Energy 7.4% Utility 6.41% Technology 6.08% Consumer Cyclical 4.53% Communication Services 3.28% Real Estate 1.02% Consumer Defensive 0.7% Asset Allocation
Asset Class Value Cash 6.13% Equity 93.87% Top Securities Holdings / Portfolio
Name Holding Value Quantity NTPC Ltd (Utilities)
Equity, Since 30 Nov 17 | 5325554% ₹134 Cr 3,998,494
↑ 252,895 Larsen & Toubro Ltd (Industrials)
Equity, Since 30 Jun 04 | LT4% ₹128 Cr 341,272 Siemens Ltd (Industrials)
Equity, Since 30 Nov 18 | 5005504% ₹126 Cr 234,753 Kirloskar Oil Engines Ltd (Industrials)
Equity, Since 31 Mar 23 | KIRLOSENG4% ₹124 Cr 1,447,045 Apar Industries Ltd (Industrials)
Equity, Since 31 Dec 22 | 5322593% ₹110 Cr 157,729
↓ -14,088 Hindustan Aeronautics Ltd Ordinary Shares (Industrials)
Equity, Since 31 Mar 22 | 5411543% ₹106 Cr 320,004
↓ -9,885 Kalpataru Projects International Ltd (Industrials)
Equity, Since 31 Jan 22 | 5222873% ₹102 Cr 957,039
↓ -44,948 Reliance Industries Ltd (Energy)
Equity, Since 31 Aug 19 | RELIANCE3% ₹101 Cr 339,790 Polycab India Ltd (Industrials)
Equity, Since 31 Jan 21 | 5426522% ₹76 Cr 149,305 Indus Towers Ltd Ordinary Shares (Communication Services)
Equity, Since 29 Feb 24 | 5348162% ₹70 Cr 2,418,383
↑ 125,053 9. ICICI Prudential Smallcap Fund
CAGR/Annualized return of 13.4% since its launch. Ranked 26 in Small Cap category. Return for 2023 was 37.9% , 2022 was 5.7% and 2021 was 61% . ICICI Prudential Smallcap Fund
Growth Launch Date 18 Oct 07 NAV (30 Apr 24) ₹79.44 ↑ 0.46 (0.58 %) Net Assets (Cr) ₹7,173 on 31 Mar 24 Category Equity - Small Cap AMC ICICI Prudential Asset Management Company Limited Rating ☆☆☆ Risk Moderately High Expense Ratio 2.04 Sharpe Ratio 2.37 Information Ratio -0.18 Alpha Ratio -4.4 Min Investment 5,000 Min SIP Investment 100 Exit Load 0-1 Years (1%),1 Years and above(NIL) Growth of 10,000 investment over the years.
Date Value 30 Apr 19 ₹10,000 30 Apr 20 ₹7,777 30 Apr 21 ₹15,067 30 Apr 22 ₹20,577 30 Apr 23 ₹22,162 30 Apr 24 ₹32,280 Returns for ICICI Prudential Smallcap Fund
absolute basis & more than 1 year are on CAGR (Compound Annual Growth Rate) basis. as on 30 Apr 24 Duration Returns 1 Month 6.7% 3 Month 2.7% 6 Month 20.6% 1 Year 45.7% 3 Year 28.9% 5 Year 26.4% 10 Year 15 Year Since launch 13.4% Historical performance (Yearly) on absolute basis
Year Returns 2023 37.9% 2022 5.7% 2021 61% 2020 22.8% 2019 10% 2018 -22.4% 2017 42.7% 2016 6% 2015 0.5% 2014 50.6% Fund Manager information for ICICI Prudential Smallcap Fund
Name Since Tenure Anish Tawakley 18 Sep 23 0.54 Yr. Sri Sharma 18 Sep 23 0.54 Yr. Sharmila D’mello 30 Jun 22 1.76 Yr. Data below for ICICI Prudential Smallcap Fund as on 31 Mar 24
Equity Sector Allocation
Sector Value Industrials 26.12% Consumer Cyclical 19.12% Basic Materials 14.4% Financial Services 8.29% Health Care 6.26% Consumer Defensive 4.94% Real Estate 3.04% Technology 2.57% Communication Services 2.35% Utility 1.55% Energy 0.77% Asset Allocation
Asset Class Value Cash 9.91% Equity 90.09% Top Securities Holdings / Portfolio
Name Holding Value Quantity Cyient Ltd (Industrials)
Equity, Since 31 Aug 18 | CYIENT3% ₹222 Cr 1,113,643 Nippon Life India Asset Management Ltd Ordinary Shares (Financial Services)
Equity, Since 31 Oct 23 | 5407673% ₹205 Cr 4,344,360
↓ -626,436 Kalpataru Projects International Ltd (Industrials)
Equity, Since 30 Sep 19 | 5222872% ₹176 Cr 1,646,029
↓ -116,575 Grindwell Norton Ltd (Industrials)
Equity, Since 30 Sep 23 | 5060762% ₹175 Cr 919,168
↑ 146,700 Maruti Suzuki India Ltd (Consumer Cyclical)
Equity, Since 31 Oct 23 | MARUTI2% ₹172 Cr 136,687 Larsen & Toubro Ltd (Industrials)
Equity, Since 31 Oct 23 | LT2% ₹170 Cr 452,798 Rolex Rings Ltd (Industrials)
Equity, Since 31 Jul 21 | 5433252% ₹151 Cr 862,662 Brigade Enterprises Ltd (Real Estate)
Equity, Since 30 Sep 16 | 5329292% ₹147 Cr 1,570,577 Procter & Gamble Health Ltd (Healthcare)
Equity, Since 29 Feb 24 | 5001262% ₹144 Cr 306,071
↑ 229,242 Cummins India Ltd (Industrials)
Equity, Since 30 Sep 23 | 5004802% ₹144 Cr 477,793
↓ -358,024 10. TATA Infrastructure Fund
CAGR/Annualized return of 16% since its launch. Ranked 15 in Sectoral category. Return for 2023 was 45.1% , 2022 was 7.6% and 2021 was 53.5% . TATA Infrastructure Fund
Growth Launch Date 31 Dec 04 NAV (30 Apr 24) ₹176.716 ↑ 1.08 (0.62 %) Net Assets (Cr) ₹1,885 on 31 Mar 24 Category Equity - Sectoral AMC Tata Asset Management Limited Rating ☆☆☆ Risk High Expense Ratio 2.36 Sharpe Ratio 4.05 Information Ratio 0 Alpha Ratio 0 Min Investment 5,000 Min SIP Investment 150 Exit Load NIL Growth of 10,000 investment over the years.
Date Value 30 Apr 19 ₹10,000 30 Apr 20 ₹7,841 30 Apr 21 ₹12,789 30 Apr 22 ₹16,709 30 Apr 23 ₹18,805 30 Apr 24 ₹31,997 Returns for TATA Infrastructure Fund
absolute basis & more than 1 year are on CAGR (Compound Annual Growth Rate) basis. as on 30 Apr 24 Duration Returns 1 Month 6.9% 3 Month 13.9% 6 Month 41.8% 1 Year 70.1% 3 Year 35.8% 5 Year 26.2% 10 Year 15 Year Since launch 16% Historical performance (Yearly) on absolute basis
Year Returns 2023 45.1% 2022 7.6% 2021 53.5% 2020 11.1% 2019 2.8% 2018 -15.7% 2017 42.2% 2016 5.3% 2015 -0.2% 2014 63.1% Fund Manager information for TATA Infrastructure Fund
Name Since Tenure Abhinav Sharma 9 Mar 21 3.07 Yr. Data below for TATA Infrastructure Fund as on 31 Mar 24
Equity Sector Allocation
Sector Value Industrials 55.3% Utility 13.19% Basic Materials 11.43% Real Estate 8.1% Technology 2.73% Consumer Cyclical 2.44% Communication Services 1.47% Energy 0.62% Asset Allocation
Asset Class Value Cash 3.95% Equity 95.27% Debt 0.78% Top Securities Holdings / Portfolio
Name Holding Value Quantity Larsen & Toubro Ltd (Industrials)
Equity, Since 31 Jan 05 | LT7% ₹132 Cr 349,889 NTPC Ltd (Utilities)
Equity, Since 30 Jun 21 | 5325554% ₹78 Cr 2,325,000
↓ -70,000 Adani Ports & Special Economic Zone Ltd (Industrials)
Equity, Since 31 Jan 21 | 5329213% ₹62 Cr 460,000 DLF Ltd (Real Estate)
Equity, Since 30 Sep 20 | 5328683% ₹57 Cr 640,000 Cummins India Ltd (Industrials)
Equity, Since 30 Nov 20 | 5004803% ₹52 Cr 172,668
↓ -20,000 Bharat Heavy Electricals Ltd (Industrials)
Equity, Since 31 Jul 22 | 5001033% ₹51 Cr 2,050,000 Thermax Ltd (Industrials)
Equity, Since 30 Apr 21 | THERMAX3% ₹49 Cr 117,920 G R Infraprojects Ltd (Industrials)
Equity, Since 30 Nov 23 | 5433173% ₹49 Cr 377,647
↑ 42,700 Siemens Ltd (Industrials)
Equity, Since 30 Nov 18 | 5005503% ₹49 Cr 90,575 ABB India Ltd (Industrials)
Equity, Since 29 Feb 20 | 5000023% ₹48 Cr 75,500 11. SBI Infrastructure Fund
CAGR/Annualized return of 9.7% since its launch. Ranked 18 in Sectoral category. Return for 2023 was 49.7% , 2022 was 9.3% and 2021 was 48.3% . SBI Infrastructure Fund
Growth Launch Date 6 Jul 07 NAV (30 Apr 24) ₹47.7941 ↑ 0.02 (0.05 %) Net Assets (Cr) ₹2,432 on 31 Mar 24 Category Equity - Sectoral AMC SBI Funds Management Private Limited Rating ☆☆☆ Risk High Expense Ratio 2.39 Sharpe Ratio 4.42 Information Ratio 0.67 Alpha Ratio 16.5 Min Investment 5,000 Min SIP Investment 500 Exit Load 0-1 Years (1%),1 Years and above(NIL) Growth of 10,000 investment over the years.
Date Value 30 Apr 19 ₹10,000 30 Apr 20 ₹8,422 30 Apr 21 ₹12,828 30 Apr 22 ₹16,778 30 Apr 23 ₹18,919 30 Apr 24 ₹31,662 Returns for SBI Infrastructure Fund
absolute basis & more than 1 year are on CAGR (Compound Annual Growth Rate) basis. as on 30 Apr 24 Duration Returns 1 Month 5.8% 3 Month 10.2% 6 Month 36.6% 1 Year 67.4% 3 Year 35.1% 5 Year 25.9% 10 Year 15 Year Since launch 9.7% Historical performance (Yearly) on absolute basis
Year Returns 2023 49.7% 2022 9.3% 2021 48.3% 2020 8.2% 2019 10.2% 2018 -18.1% 2017 41.7% 2016 9.3% 2015 2.7% 2014 48.1% Fund Manager information for SBI Infrastructure Fund
Name Since Tenure Mohit Jain 30 Nov 17 6.34 Yr. Bhavin Vithlani 1 Jan 22 2.25 Yr. Data below for SBI Infrastructure Fund as on 31 Mar 24
Equity Sector Allocation
Sector Value Industrials 27.71% Basic Materials 16.79% Financial Services 15.27% Energy 10.77% Utility 7.53% Communication Services 6.57% Consumer Cyclical 6.31% Real Estate 1.49% Asset Allocation
Asset Class Value Cash 7.57% Equity 92.43% Top Securities Holdings / Portfolio
Name Holding Value Quantity Reliance Industries Ltd (Energy)
Equity, Since 30 Sep 19 | RELIANCE10% ₹238 Cr 800,000
↑ 100,000 Bharti Airtel Ltd (Communication Services)
Equity, Since 30 Sep 07 | BHARTIARTL7% ₹160 Cr 1,300,000
↑ 200,000 Larsen & Toubro Ltd (Industrials)
Equity, Since 30 Sep 07 | LT5% ₹120 Cr 320,000 Shree Cement Ltd (Basic Materials)
Equity, Since 31 Jul 22 | 5003875% ₹116 Cr 45,000
↑ 9,000 Torrent Power Ltd (Utilities)
Equity, Since 31 May 22 | 5327794% ₹95 Cr 700,000
↓ -200,000 National Highways Infra Trust Units (Financial Services)
Equity, Since 31 Oct 22 | 5433853% ₹81 Cr 6,427,380
↑ 4,027,380 Tega Industries Ltd (Industrials)
Equity, Since 31 Dec 21 | 5434133% ₹74 Cr 600,000
↑ 59,109 Axis Bank Ltd (Financial Services)
Equity, Since 31 Dec 22 | 5322153% ₹73 Cr 700,000 Grasim Industries Ltd (Basic Materials)
Equity, Since 31 Jan 24 | GRASIM3% ₹69 Cr 300,000 UltraTech Cement Ltd (Basic Materials)
Equity, Since 31 Dec 19 | ULTRACEMCO3% ₹68 Cr 70,000
നിക്ഷേപകർ അവർക്കിഷ്ടമുള്ള SIP പ്ലാനുകളിൽ നിക്ഷേപിക്കാൻ നിർദ്ദേശിക്കുന്നു. മുകളിൽ സൂചിപ്പിച്ച മികച്ച 11 മ്യൂച്വൽ ഫണ്ടുകൾ എല്ലാ തരത്തിലുമുള്ള നിക്ഷേപകർക്ക് അനുയോജ്യമാണ്. അതിനാൽ, ഒന്നുകിൽ നിങ്ങൾ ഉയർന്ന അപകടസാധ്യതയുള്ള ആളാണ്നിക്ഷേപകൻ അല്ലെങ്കിൽ താരതമ്യേന താഴ്ന്നത്, ഈ SIP ഫണ്ടുകളാണ്നിക്ഷേപിക്കാൻ മികച്ച മ്യൂച്വൽ ഫണ്ടുകൾ. അതിനാൽ, കാത്തിരിക്കരുത്, ഇപ്പോൾ നിക്ഷേപിക്കുക!
മികച്ച ചിട്ടയായ നിക്ഷേപ പദ്ധതികളിൽ നിക്ഷേപിക്കുമ്പോൾ പരിഗണിക്കേണ്ട പാരാമീറ്ററുകൾ
മികച്ച പ്രകടനം കാഴ്ചവെക്കുന്ന എസ്ഐപി ഫണ്ടുകൾ വിലയിരുത്തുന്നതിന്, നിക്ഷേപിക്കുന്നതിന് മുമ്പ് പരിഗണിക്കേണ്ട ഘടകങ്ങൾ എന്തൊക്കെയെന്ന് നമുക്ക് നോക്കാം.
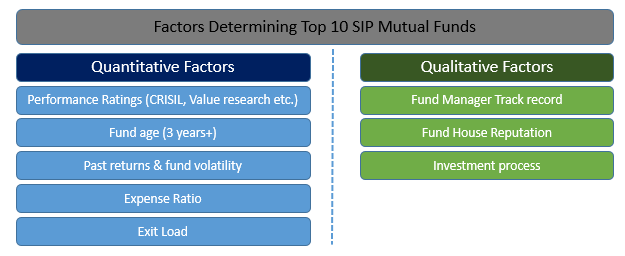
ടോപ്പ് എസ്ഐപിയിൽ നിക്ഷേപിക്കാനുള്ള അളവ് ഘടകങ്ങൾ
എസ്ഐപി വഴി നിക്ഷേപിക്കുന്നതിന് മുമ്പ് ഒരാൾ പരിഗണിക്കേണ്ട അളവ് ഘടകങ്ങളിൽ പ്രകടന റേറ്റിംഗ് (ക്രിസിൽ, മൂല്യ ഗവേഷണം മുതലായവ പ്രകാരം), ഫണ്ടിന്റെ പ്രായം, മുൻകാല റിട്ടേണുകളും ഫണ്ടുകളുടെ ചാഞ്ചാട്ടവും, ചെലവ് അനുപാതവും എക്സിറ്റ് ലോഡും ഉൾപ്പെടുന്നു.
ടോപ്പ് എസ്ഐപിയിൽ നിക്ഷേപിക്കാനുള്ള ഗുണപരമായ ഘടകങ്ങൾ
വിശകലനം ചെയ്യാനുള്ള ഗുണപരമായ പ്രധാന സ്ഥിതിവിവരക്കണക്കുകളിൽ ഫണ്ട് മാനേജരുടെ ട്രാക്ക് റെക്കോർഡ്, ഫണ്ട് ഹൗസിന്റെ പ്രശസ്തി, എസ്ഐപി ഫണ്ടിന്റെ നിക്ഷേപ പ്രക്രിയ എന്നിവ ഉൾപ്പെടുന്നു.
SIP MF ഓൺലൈനിൽ എങ്ങനെ നിക്ഷേപിക്കാം?
Fincash.com-ൽ ആജീവനാന്ത സൗജന്യ നിക്ഷേപ അക്കൗണ്ട് തുറക്കുക
നിങ്ങളുടെ രജിസ്ട്രേഷനും KYC പ്രക്രിയയും പൂർത്തിയാക്കുക
രേഖകൾ അപ്ലോഡ് ചെയ്യുക (പാൻ, ആധാർ മുതലായവ).കൂടാതെ, നിങ്ങൾ നിക്ഷേപിക്കാൻ തയ്യാറാണ്!
ഇന്ന് തന്നെ SIP ഉപയോഗിച്ച് നിങ്ങളുടെ നിക്ഷേപ യാത്ര ആരംഭിക്കൂ!
പതിവുചോദ്യങ്ങൾ
1. മ്യൂച്വൽ ഫണ്ടുകൾ എന്തൊക്കെയാണ്?
എ: മ്യൂച്വൽ ഫണ്ടുകൾ സിസ്റ്റമാറ്റിക് ഇൻവെസ്റ്റ്മെന്റ് പ്ലാനിന്റെ ഭാഗമാണ് അല്ലെങ്കിൽ എസ്ഐപികൾ സാധാരണയായി പിന്നീട് മികച്ച വരുമാനം നൽകുന്നു. നിങ്ങൾ എപ്പോൾമ്യൂച്വൽ ഫണ്ടുകളിൽ നിക്ഷേപിക്കുക, നിങ്ങൾ നിങ്ങളുടെ നിക്ഷേപ പോർട്ട്ഫോളിയോ വൈവിധ്യവൽക്കരിക്കുന്നു. ഒരു മ്യൂച്വൽ ഫണ്ട് വികസിപ്പിച്ച ഒരു നിക്ഷേപ ഉപകരണമായി കണക്കാക്കാംഅസറ്റ് മാനേജ്മെന്റ് കമ്പനി ഒന്നിലധികം നിക്ഷേപകരും കമ്പനികളുടെ നിക്ഷേപവും സമാഹരിച്ചുകൊണ്ട്.
2. മ്യൂച്വൽ ഫണ്ടുകളുടെ വ്യത്യസ്ത തരം ഏതൊക്കെയാണ്?
എ: മ്യൂച്വൽ ഫണ്ടുകളെ ഇനിപ്പറയുന്ന തരങ്ങളായി തരംതിരിക്കാം:
- ഇക്വിറ്റി അല്ലെങ്കിൽ വളർച്ചാ ഫണ്ടുകൾ
- സ്ഥിര വരുമാന ഫണ്ടുകൾ അല്ലെങ്കിൽഡെറ്റ് ഫണ്ട്
- നികുതി ലാഭിക്കൽ ഫണ്ടുകൾ
- ലിക്വിഡ് ഫണ്ടുകൾ
- ബാലൻസ്ഡ് ഫണ്ട്
- ഗിൽറ്റ് ഫണ്ടുകൾ
- എക്സ്ചേഞ്ച്-ട്രേഡഡ് ഫണ്ടുകൾ അല്ലെങ്കിൽഇടിഎഫുകൾ
3. വളർച്ചാ ഇക്വിറ്റി ഫണ്ടുകൾ എന്തൊക്കെയാണ്?
എ: വളർച്ചഇക്വിറ്റി ഫണ്ടുകൾ ഏറ്റവും സാധാരണമായ മ്യൂച്വൽ ഫണ്ടുകളാണ്. എന്നിരുന്നാലും, ഈ പോർട്ട്ഫോളിയോ അസ്ഥിരമായ നിക്ഷേപങ്ങൾ ഉൾക്കൊള്ളുന്നതാണ്. എന്നിരുന്നാലും, നിക്ഷേപകർ പലപ്പോഴും വളർച്ചാ ഇക്വിറ്റി ഫണ്ടുകൾ തിരഞ്ഞെടുക്കുന്നു, കാരണം ഇവയ്ക്ക് ഉയർന്ന റിട്ടേൺ ഉണ്ട്, കുറഞ്ഞ കാലയളവിലേക്ക് നിക്ഷേപിക്കാം.
4. എന്തുകൊണ്ടാണ് നിങ്ങൾ ഒരു ഡെറ്റ് ഫണ്ടിൽ നിക്ഷേപിക്കേണ്ടത്?
എ: നിക്ഷേപത്തിൽ സ്ഥിരമായ വരുമാനം തേടുന്ന വ്യക്തികൾക്ക് ഈ നിക്ഷേപങ്ങൾ അനുയോജ്യമാണ്. ഡിബഞ്ചറുകൾ, ഡെറ്റ് സെക്യൂരിറ്റികൾ, വാണിജ്യ പേപ്പറുകൾ, സർക്കാർ സെക്യൂരിറ്റികൾ എന്നിവയിൽ നിന്ന് സ്ഥിരവരുമാനം നേടാം. മ്യൂച്വൽ ഫണ്ടുകൾ വിവിധ തരത്തിലുള്ള നിക്ഷേപങ്ങളുടെ ഒരു പോർട്ട്ഫോളിയോ സൃഷ്ടിക്കുകയും അപകടസാധ്യത ഇല്ലാതാക്കുകയും ചെയ്യും.
5. നിങ്ങൾ എന്തിന് SIP-കളിൽ നിക്ഷേപിക്കണം?
എ: SIP-കൾക്ക് നിക്ഷേപകന് ഉറപ്പായ വരുമാനം നൽകാൻ കഴിയും. നിഷ്ക്രിയ വരുമാനം നേടുന്നതിൽ നിങ്ങൾക്ക് താൽപ്പര്യമുണ്ടെങ്കിൽ നിങ്ങളുടെ നിക്ഷേപം സ്ഥിരമായ വരുമാനം ഉണ്ടാക്കുന്നുവെന്ന് ഉറപ്പാക്കാൻ ആഗ്രഹിക്കുന്നുവെങ്കിൽ, നിങ്ങൾക്ക് SIP-കളിൽ നിക്ഷേപിക്കുന്നത് പരിഗണിക്കാം. .
6. നികുതി ലാഭിക്കുന്ന മ്യൂച്വൽ ഫണ്ടിൽ നിക്ഷേപിക്കുന്നത് എന്തുകൊണ്ട്?
എ: നിങ്ങൾ വളരാൻ നോക്കുകയാണെങ്കിൽ നിങ്ങളുടെമൂലധനം അതേ സമയം നികുതി ഇളവുകൾ ആസ്വദിക്കാൻ ആഗ്രഹിക്കുന്നു, തുടർന്ന് നിങ്ങൾക്ക് നികുതി ലാഭിക്കുന്ന മ്യൂച്വൽ ഫണ്ടിൽ നിക്ഷേപിക്കാം. താഴെസെക്ഷൻ 80 സി യുടെആദായ നികുതി 1861 ലെ നിയമം, നിങ്ങൾ ഇക്വിറ്റി-ലിങ്ക്ഡ് ടാക്സ് സേവിംഗ് മ്യൂച്വൽ ഫണ്ടുകളിൽ നിക്ഷേപിക്കുകയാണെങ്കിൽ, നിങ്ങളുടെ നിക്ഷേപത്തിൽ നിങ്ങൾക്ക് നികുതി ഇളവുകൾ ആസ്വദിക്കാം.
7. മ്യൂച്വൽ ഫണ്ടുകളിൽ നിക്ഷേപിക്കാൻ എനിക്ക് ഒരു ബ്രോക്കറെ ആവശ്യമുണ്ടോ?
എ: നിക്ഷേപത്തിൽ നിങ്ങളെ സഹായിക്കാൻ നിങ്ങൾക്ക് ഒരു ബ്രോക്കറുടെയോ ഒരു ധനകാര്യ സ്ഥാപനത്തിന്റെയോ പിന്തുണ ആവശ്യമാണ്. അനുയോജ്യമായ SIP-കൾ തിരിച്ചറിയുന്നതിനും നിക്ഷേപങ്ങൾ കൃത്യമായി നടത്തിയിട്ടുണ്ടെന്ന് ഉറപ്പുവരുത്തുന്നതിനും നിങ്ങൾക്ക് പിന്തുണ ആവശ്യമാണ്.
ഇവിടെ നൽകിയിരിക്കുന്ന വിവരങ്ങൾ കൃത്യമാണെന്ന് ഉറപ്പാക്കാൻ എല്ലാ ശ്രമങ്ങളും നടത്തിയിട്ടുണ്ട്. എന്നിരുന്നാലും, ഡാറ്റയുടെ കൃത്യത സംബന്ധിച്ച് യാതൊരു ഉറപ്പും നൽകുന്നില്ല. എന്തെങ്കിലും നിക്ഷേപം നടത്തുന്നതിന് മുമ്പ് സ്കീം വിവര രേഖ ഉപയോഗിച്ച് പരിശോധിക്കുക.


AMFI Registration No. 112358 | CIN: U74999MH2016PTC282153
Shepard Technologies Pvt. Ltd. (with ARN code 112358) makes no warranties or representations, express or implied, on products offered through the platform. It accepts no liability for any damages or losses, however caused, in connection with the use of, or on the reliance of its product or related services. Terms and conditions of the website are applicable.
©2024 Shepard Technologies Private Limited. All Rights Reserved