 +91-22-48913909
Table of Contents
- എന്തുകൊണ്ടാണ് ബാലൻസ്ഡ് മ്യൂച്വൽ ഫണ്ടുകളിൽ നിക്ഷേപിക്കുന്നത്?
- മികച്ച ബാലൻസ്ഡ് ഫണ്ടുകളുടെ ഗുണങ്ങളും ദോഷങ്ങളും
- FY 22 - 23 നിക്ഷേപിക്കാൻ മികച്ച പ്രകടനം കാഴ്ചവയ്ക്കുന്ന ബാലൻസ്ഡ് ഫണ്ടുകൾ അല്ലെങ്കിൽ ഹൈബ്രിഡ് ഫണ്ടുകൾ
- മികച്ച പ്രകടനം നടത്തുന്ന അഗ്രസീവ് ഹൈബ്രിഡ് ഫണ്ടുകൾ
- മികച്ച പ്രകടനം നടത്തുന്ന കൺസർവേറ്റീവ് ഹൈബ്രിഡ് ഫണ്ടുകൾ
- മികച്ച പ്രകടനം നടത്തുന്ന ആർബിട്രേജ് ഫണ്ടുകൾ
- മികച്ച പ്രകടനം നടത്തുന്ന ഡൈനാമിക് അസറ്റ് അലോക്കേഷൻ ഫണ്ടുകൾ
- മികച്ച പ്രകടനം നടത്തുന്ന ഇക്വിറ്റി സേവിംഗ്സ് ഫണ്ടുകൾ
- മികച്ച പ്രകടനം നടത്തുന്ന മൾട്ടി അസറ്റ് അലോക്കേഷൻ ഫണ്ടുകൾ
- സമതുലിതമായ മ്യൂച്വൽ ഫണ്ടുകളിൽ ഓൺലൈനിൽ എങ്ങനെ നിക്ഷേപിക്കാം?
Top 11 Funds
- HDFC Balanced Advantage Fund
- ICICI Prudential Equity and Debt Fund
- ICICI Prudential Multi-Asset Fund
- BOI AXA Mid and Small Cap Equity and Debt Fund
- JM Equity Hybrid Fund
- Edelweiss Multi Asset Allocation Fund
- UTI Hybrid Equity Fund
- UTI Multi Asset Fund
- Nippon India Equity Hybrid Fund
- Franklin India Equity Hybrid Fund
- HDFC Hybrid Equity Fund
മികച്ച ബാലൻസ്ഡ് മ്യൂച്വൽ ഫണ്ടുകൾ 2022
മുകളിൽബാലൻസ്ഡ് ഫണ്ട് ആകുന്നുമ്യൂച്വൽ ഫണ്ടുകൾ മൊത്തത്തിലുള്ള നല്ല വരുമാനം ലഭിക്കുന്നതിന് അവരുടെ ആസ്തികൾ ഇക്വിറ്റികളിലും ഡെറ്റ് ഉപകരണങ്ങളിലും നിക്ഷേപിക്കുന്നു. ഒരു എടുക്കാൻ തയ്യാറുള്ള നിക്ഷേപകർക്ക് ബാലൻസ്ഡ് മ്യൂച്വൽ ഫണ്ടുകൾ പ്രയോജനകരമാണ്വിപണി ചില ഫിക്സഡ് റിട്ടേണുകൾക്കായി നോക്കുമ്പോൾ റിസ്ക്.
ഇക്വിറ്റികളിലും സ്റ്റോക്കുകളിലും നിക്ഷേപിച്ച ആസ്തികൾ മാർക്കറ്റ്-ലിങ്ക്ഡ് റിട്ടേൺ വാഗ്ദാനം ചെയ്യുമ്പോൾ ഡെറ്റ് ഉപകരണങ്ങളിൽ നിക്ഷേപിച്ച ആസ്തികൾ സ്ഥിരമായ റിട്ടേൺ വാഗ്ദാനം ചെയ്യുന്നു. ഇക്വിറ്റി, ഡെറ്റ് എന്നിവയുടെ സംയോജനമായതിനാൽ, നിക്ഷേപകർ വളരെ ശ്രദ്ധാലുവായിരിക്കണംനിക്ഷേപിക്കുന്നു ഈ ഫണ്ടുകളിൽ. ബാലൻസ്ഡ് മ്യൂച്വൽ ഫണ്ടുകളിൽ നിക്ഷേപിക്കുന്നതിന് മുമ്പ് മികച്ച ബാലൻസ്ഡ് ഫണ്ടുകൾ നോക്കാൻ നിക്ഷേപകർ നിർദ്ദേശിക്കുന്നു. മികച്ച ബാലൻസ്ഡ് മ്യൂച്വൽ ഫണ്ടുകൾ ഞങ്ങൾ താഴെ ലിസ്റ്റ് ചെയ്തിട്ടുണ്ട്.
എന്തുകൊണ്ടാണ് ബാലൻസ്ഡ് മ്യൂച്വൽ ഫണ്ടുകളിൽ നിക്ഷേപിക്കുന്നത്?
സാധാരണയായി, നിക്ഷേപകർ തങ്ങളുടെ നിക്ഷേപങ്ങൾ കുറഞ്ഞ സമയത്തിനുള്ളിൽ കുറഞ്ഞ അപകടസാധ്യതയോടെ വൈവിധ്യവത്കരിക്കാനുള്ള വഴികൾ തേടുന്നു. ഇക്വിറ്റിയുടെയും ഡെറ്റ് ഉപകരണങ്ങളുടെയും സംയോജനമായതിനാൽ, ബാലൻസ്ഡ് മ്യൂച്വൽ ഫണ്ടുകൾ ഈ രണ്ട് ലോകങ്ങളിലും ഏറ്റവും മികച്ചത് വാഗ്ദാനം ചെയ്യുന്നു. അതിനാൽ, ഈ ഫണ്ടുകൾ ഡെറ്റ് എക്സ്പോഷർ കാരണം ചില അടിസ്ഥാന വരുമാനങ്ങൾ കൈകാര്യം ചെയ്യുമ്പോൾ നിരന്തരം മാറിക്കൊണ്ടിരിക്കുന്ന വിപണി സാഹചര്യങ്ങൾ കാരണം തകർച്ചയുടെ അപകടസാധ്യത കുറയ്ക്കുന്നു. 100% നിക്ഷേപിക്കുന്നതിനേക്കാൾ അൽപ്പം കുറഞ്ഞ റിസ്കിൽ റിട്ടേൺ ലഭിക്കാനുള്ള മധ്യപാത തേടുന്ന നിക്ഷേപകർക്ക് ഇത് സമതുലിതമായ ഫണ്ടുകളെ വളരെ അനുയോജ്യമായ നിക്ഷേപ ഓപ്ഷനാക്കി മാറ്റുന്നു.ഇക്വിറ്റി ഫണ്ടുകൾ.
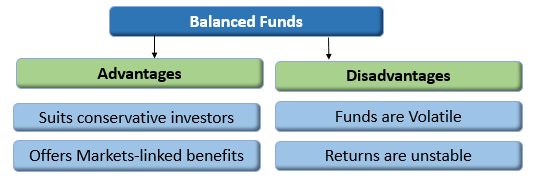
മികച്ച ബാലൻസ്ഡ് ഫണ്ടുകളുടെ ഗുണങ്ങളും ദോഷങ്ങളും
പ്രയോജനങ്ങൾ
- 35-40% ആസ്തികൾ സ്ഥിരമായി നിക്ഷേപിച്ച് സ്ഥിരമായ വരുമാനം നൽകുന്നുവരുമാനം ഓപ്ഷനുകൾ
- ആസ്തിയുടെ 60-65% ഇക്വിറ്റികളിൽ നിക്ഷേപിക്കുന്നതിലൂടെ വിപണി-ലിങ്ക്ഡ് റിട്ടേൺ വാഗ്ദാനം ചെയ്യുന്നു
- മിതമായ റിസ്ക് എടുക്കാൻ തയ്യാറുള്ള യാഥാസ്ഥിതിക നിക്ഷേപകർക്ക് അനുയോജ്യം
ദോഷങ്ങൾ
- ഇക്വിറ്റികളിൽ നിക്ഷേപിക്കുന്ന ഫണ്ടുകൾ അസ്ഥിരവും ഉയർന്ന അപകടസാധ്യതയുള്ളതുമാണ്ഘടകം
- സംയോജിത റിട്ടേണുകൾ (കടത്തിന്റെയും ഇക്വിറ്റി മ്യൂച്വൽ ഫണ്ടുകളുടെയും റിട്ടേൺസ്) ദീർഘകാലാടിസ്ഥാനത്തിൽ നല്ല വരുമാനം നൽകിയേക്കില്ല.
Talk to our investment specialist
FY 22 - 23 നിക്ഷേപിക്കാൻ മികച്ച പ്രകടനം കാഴ്ചവയ്ക്കുന്ന ബാലൻസ്ഡ് ഫണ്ടുകൾ അല്ലെങ്കിൽ ഹൈബ്രിഡ് ഫണ്ടുകൾ
മികച്ച പ്രകടനം നടത്തുന്ന അഗ്രസീവ് ഹൈബ്രിഡ് ഫണ്ടുകൾ
ഈ ഫണ്ട് അതിന്റെ മൊത്തം ആസ്തിയുടെ 65 മുതൽ 85 ശതമാനം വരെ ഇക്വിറ്റിയുമായി ബന്ധപ്പെട്ട ഉപകരണങ്ങളിലും അവരുടെ ആസ്തിയുടെ 20 മുതൽ 35 ശതമാനം വരെ ഡെറ്റ് ഉപകരണങ്ങളിലും നിക്ഷേപിക്കും.മ്യൂച്വൽ ഫണ്ട് ഹൗസുകൾ സമതുലിതമായ ഒരു ഹൈബ്രിഡ് അല്ലെങ്കിൽ ആക്രമണാത്മക ഹൈബ്രിഡ് ഫണ്ട് വാഗ്ദാനം ചെയ്യാൻ കഴിയും, രണ്ടും അല്ല.
Fund NAV Net Assets (Cr) 3 MO (%) 6 MO (%) 1 YR (%) 3 YR (%) 5 YR (%) 2023 (%) ICICI Prudential Equity and Debt Fund Growth ₹344.81
↓ -0.15 ₹33,502 7.7 24.1 40.5 25.9 20.7 28.2 BOI AXA Mid and Small Cap Equity and Debt Fund Growth ₹34.59
↓ -0.02 ₹665 7.5 26.1 48.8 24.3 22.2 33.7 JM Equity Hybrid Fund Growth ₹113.5
↑ 0.48 ₹223 8.9 31.1 56.3 24.2 19.5 33.8 UTI Hybrid Equity Fund Growth ₹354.171
↑ 0.26 ₹5,306 6 19.6 32.2 19.2 16.1 25.5 Nippon India Equity Hybrid Fund Growth ₹93.3426
↓ -0.07 ₹3,435 5.6 18.9 31 17.8 11.9 24.1 Note: Returns up to 1 year are on absolute basis & more than 1 year are on CAGR basis. as on 30 Apr 24
മികച്ച പ്രകടനം നടത്തുന്ന കൺസർവേറ്റീവ് ഹൈബ്രിഡ് ഫണ്ടുകൾ
ഈ സ്കീം പ്രധാനമായും ഡെറ്റ് ഉപകരണങ്ങളിൽ നിക്ഷേപിക്കും. അവരുടെ മൊത്തം ആസ്തിയുടെ 75 മുതൽ 90 ശതമാനം വരെ ഡെറ്റ് ഉപകരണങ്ങളിലും ഏകദേശം 10 മുതൽ 25 ശതമാനം വരെ ഇക്വിറ്റിയുമായി ബന്ധപ്പെട്ട ഉപകരണങ്ങളിലുമാണ് നിക്ഷേപിക്കുക. ഈ സ്കീമിന് യാഥാസ്ഥിതികമെന്ന് പേരിട്ടു, കാരണം ഇത് അപകടസാധ്യതയില്ലാത്ത ആളുകൾക്കുള്ളതാണ്. തങ്ങളുടെ നിക്ഷേപത്തിൽ കൂടുതൽ റിസ്ക് എടുക്കാൻ ആഗ്രഹിക്കാത്ത നിക്ഷേപകർക്ക് ഈ സ്കീമിൽ നിക്ഷേപിക്കാൻ മുൻഗണന നൽകാം.
Fund NAV Net Assets (Cr) 3 MO (%) 6 MO (%) 1 YR (%) 3 YR (%) 5 YR (%) 2023 (%) HDFC Hybrid Debt Fund Growth ₹74.9095
↑ 0.01 ₹3,103 3 10 15.9 11.3 10.5 13.9 Kotak Debt Hybrid Fund Growth ₹52.8768
↑ 0.09 ₹2,331 2.2 10.6 16.2 10.7 11.4 13.9 SBI Debt Hybrid Fund Growth ₹65.3511
↓ -0.02 ₹9,642 2.8 7.6 14.3 10.5 10.8 12.2 Note: Returns up to 1 year are on absolute basis & more than 1 year are on CAGR basis. as on 30 Apr 24
മികച്ച പ്രകടനം നടത്തുന്ന ആർബിട്രേജ് ഫണ്ടുകൾ
ഈ ഫണ്ട് ആർബിട്രേജ് തന്ത്രം പിന്തുടരുകയും അതിന്റെ ആസ്തിയുടെ 65 ശതമാനമെങ്കിലും ഇക്വിറ്റിയുമായി ബന്ധപ്പെട്ട ഉപകരണങ്ങളിൽ നിക്ഷേപിക്കുകയും ചെയ്യും. മ്യൂച്വൽ ഫണ്ട് റിട്ടേണുകൾ സൃഷ്ടിക്കുന്നതിന് ക്യാഷ് മാർക്കറ്റും ഡെറിവേറ്റീവ് മാർക്കറ്റും തമ്മിലുള്ള വ്യത്യാസത്തിന്റെ വിലയെ സ്വാധീനിക്കുന്ന മ്യൂച്വൽ ഫണ്ടുകളാണ് ആർബിട്രേജ് ഫണ്ടുകൾ. ആർബിട്രേജ് ഫണ്ടുകൾ സൃഷ്ടിക്കുന്ന വരുമാനം സ്റ്റോക്ക് മാർക്കറ്റിന്റെ അസ്ഥിരതയെ ആശ്രയിച്ചിരിക്കുന്നു. ആർബിട്രേജ് മ്യൂച്വൽ ഫണ്ടുകൾ ഹൈബ്രിഡ് സ്വഭാവമാണ്, ഉയർന്നതോ സ്ഥിരമായതോ ആയ ചാഞ്ചാട്ടമുള്ള സമയങ്ങളിൽ, ഈ ഫണ്ടുകൾ നിക്ഷേപകർക്ക് താരതമ്യേന അപകടസാധ്യതയില്ലാത്ത വരുമാനം വാഗ്ദാനം ചെയ്യുന്നു.
Fund NAV Net Assets (Cr) 3 MO (%) 6 MO (%) 1 YR (%) 3 YR (%) 5 YR (%) 2023 (%) Kotak Equity Arbitrage Fund Growth ₹34.5533
↑ 0.03 ₹40,051 2 4 8 5.8 5.4 7.4 SBI Arbitrage Opportunities Fund Growth ₹31.1991
↑ 0.02 ₹27,586 1.9 3.8 7.8 5.9 5.2 7.4 Edelweiss Arbitrage Fund Growth ₹17.8973
↑ 0.02 ₹9,167 1.9 3.9 7.7 5.6 5.3 7.1 Note: Returns up to 1 year are on absolute basis & more than 1 year are on CAGR basis. as on 30 Apr 24
മികച്ച പ്രകടനം നടത്തുന്ന ഡൈനാമിക് അസറ്റ് അലോക്കേഷൻ ഫണ്ടുകൾ
ഈ സ്കീം ഇക്വിറ്റിയിലും ഡെറ്റ് ഉപകരണങ്ങളിലുമുള്ള അവരുടെ നിക്ഷേപങ്ങളെ ചലനാത്മകമായി കൈകാര്യം ചെയ്യും. ഈ ഫണ്ടുകൾ കടത്തിലേക്കുള്ള വിഹിതം വർദ്ധിപ്പിക്കുകയും വിപണി ചെലവേറിയതായിരിക്കുമ്പോൾ ഇക്വിറ്റികളിലേക്കുള്ള വെയിറ്റേജ് കുറയ്ക്കുകയും ചെയ്യുന്നു. കൂടാതെ, ഈ ഫണ്ടുകൾ കുറഞ്ഞ റിസ്കിൽ സ്ഥിരത നൽകുന്നതിൽ ശ്രദ്ധ കേന്ദ്രീകരിക്കുന്നു.Fund NAV Net Assets (Cr) 3 MO (%) 6 MO (%) 1 YR (%) 3 YR (%) 5 YR (%) 2023 (%) HDFC Balanced Advantage Fund Growth ₹468.042
↑ 1.31 ₹79,875 5.4 23.7 39.9 25.9 18.6 31.3 BOI AXA Equity Debt Rebalancer Fund Growth ₹23.8554
↓ -0.02 ₹122 4.8 19.5 25.5 15.1 9.6 18.4 Edelweiss Balanced Advantage Fund Growth ₹46.82
↑ 0.04 ₹10,738 6.1 17.9 26.6 14 14.7 18.8 Note: Returns up to 1 year are on absolute basis & more than 1 year are on CAGR basis. as on 30 Apr 24
മികച്ച പ്രകടനം നടത്തുന്ന ഇക്വിറ്റി സേവിംഗ്സ് ഫണ്ടുകൾ
ഈ സ്കീം ഇക്വിറ്റി, ആർബിട്രേജ്, ഡെറ്റ് എന്നിവയിൽ നിക്ഷേപിക്കും. ഇക്വിറ്റി സേവിംഗ്സ് മൊത്തം ആസ്തിയുടെ 65 ശതമാനമെങ്കിലും ഓഹരികളിലും കുറഞ്ഞത് 10 ശതമാനം കടത്തിലും നിക്ഷേപിക്കും. സ്കീം ഇൻഫർമേഷൻ ഡോക്യുമെന്റിലെ ഏറ്റവും കുറഞ്ഞ ഹെഡ്ജഡ്, അൺഹെഡ്ഡ് നിക്ഷേപങ്ങൾ സ്കീം വ്യക്തമാക്കും.Fund NAV Net Assets (Cr) 3 MO (%) 6 MO (%) 1 YR (%) 3 YR (%) 5 YR (%) 2023 (%) L&T Equity Savings Fund Growth ₹29.8116
↓ -0.04 ₹230 6.3 14.8 23.2 13 10.8 17 Principal Equity Savings Fund Growth ₹63.4643
↓ -0.08 ₹742 5 11.9 20.8 13 12.1 15.3 Kotak Equity Savings Fund Growth ₹23.8227
↑ 0.04 ₹4,813 4 12.5 19.6 12.4 10.8 15.7 Note: Returns up to 1 year are on absolute basis & more than 1 year are on CAGR basis. as on 30 Apr 24
മികച്ച പ്രകടനം നടത്തുന്ന മൾട്ടി അസറ്റ് അലോക്കേഷൻ ഫണ്ടുകൾ
ഈ സ്കീമിന് മൂന്ന് അസറ്റ് ക്ലാസുകളിൽ നിക്ഷേപിക്കാം, അതായത് ഇക്വിറ്റിക്കും കടത്തിനും പുറമെ അവർക്ക് ഒരു അധിക അസറ്റ് ക്ലാസിൽ നിക്ഷേപിക്കാം. ഓരോ അസറ്റ് ക്ലാസുകളിലും ഫണ്ട് കുറഞ്ഞത് 10 ശതമാനമെങ്കിലും നിക്ഷേപിക്കണം. വിദേശ സെക്യൂരിറ്റികളെ ഒരു പ്രത്യേക അസറ്റ് ക്ലാസായി പരിഗണിക്കില്ല. (Erstwhile HDFC Growth Fund and HDFC Prudence Fund) Aims to generate long term capital appreciation from a portfolio that is invested predominantly in equity and equity related instruments. HDFC Balanced Advantage Fund is a Hybrid - Dynamic Allocation fund was launched on 11 Sep 00. It is a fund with Moderately High risk and has given a Below is the key information for HDFC Balanced Advantage Fund Returns up to 1 year are on (Erstwhile ICICI Prudential Balanced Fund) To generate long term capital appreciation and current income from a portfolio
that is invested in equity and equity related securities as well as in fixed income
securities. ICICI Prudential Equity and Debt Fund is a Hybrid - Hybrid Equity fund was launched on 3 Nov 99. It is a fund with Moderately High risk and has given a Below is the key information for ICICI Prudential Equity and Debt Fund Returns up to 1 year are on (Erstwhile ICICI Prudential Dynamic Plan) To generate capital appreciation by actively investing in equity and equity related securities. For defensive considerations, the Scheme may invest in debt, money market instruments and derivatives. The investment manager will have the discretion to take aggressive asset calls i.e. by staying 100% invested in equity market/equity related instruments at a given point of time and 0% at another, in which case, the fund may be invested in debt related instruments at its discretion. The AMC may choose to churn the portfolio of the Scheme in order to achieve the investment objective. The Scheme is suitable for investors seeking high returns and for those who are willing to take commensurate risks. ICICI Prudential Multi-Asset Fund is a Hybrid - Multi Asset fund was launched on 31 Oct 02. It is a fund with Moderately High risk and has given a Below is the key information for ICICI Prudential Multi-Asset Fund Returns up to 1 year are on (Erstwhile BOI AXA Mid Cap Equity And Debt Fund) The scheme's objective is to provide capital appreciation and income distribution to investors from a portfolio constituting of mid cap equity and equity related securities as well as fixed income securities.However there can be no assurance that the investment objectives of the Scheme will be realized BOI AXA Mid and Small Cap Equity and Debt Fund is a Hybrid - Hybrid Equity fund was launched on 20 Jul 16. It is a fund with Moderately High risk and has given a Below is the key information for BOI AXA Mid and Small Cap Equity and Debt Fund Returns up to 1 year are on (Erstwhile JM Balanced Fund) To provide steady current income as well as long term growth of capital. JM Equity Hybrid Fund is a Hybrid - Hybrid Equity fund was launched on 1 Apr 95. It is a fund with Moderately High risk and has given a Below is the key information for JM Equity Hybrid Fund Returns up to 1 year are on (Erstwhile Edelweiss Prudent Advantage Fund) The objective of the Scheme is to generate returns through capital appreciation by investing in diversified portfolio of equity and equity-related securities, fixed income instruments and Gold Exchange Traded Funds.
However, there is no assurance that the investment objective of the Scheme will be realized. Edelweiss Multi Asset Allocation Fund is a Hybrid - Multi Asset fund was launched on 12 Aug 09. It is a fund with Moderately High risk and has given a Below is the key information for Edelweiss Multi Asset Allocation Fund Returns up to 1 year are on (Erstwhile UTI Balanced Fund) The scheme aims to invest in a portfolio of equity/equity related securities and fixed income securities (debt and money market securities) with a view to generating regular income together with capital appreciation. UTI Hybrid Equity Fund is a Hybrid - Hybrid Equity fund was launched on 2 Jan 95. It is a fund with Moderately High risk and has given a Below is the key information for UTI Hybrid Equity Fund Returns up to 1 year are on (Erstwhile UTI Wealth Builder Fund) The objective of the Scheme is to achieve long term capital appreciation by investing predominantly in a diversified portfolio of equity and equity related instruments along with investments in Gold ETFs and Debt and Money Market Instruments. However, there can be no assurance that the investment objective of the Scheme will be achieved. UTI Multi Asset Fund is a Hybrid - Multi Asset fund was launched on 21 Oct 08. It is a fund with Moderately High risk and has given a Below is the key information for UTI Multi Asset Fund Returns up to 1 year are on (Erstwhile Reliance Regular Savings Fund - Balanced Plan) The primary investment objective of this option is to generate consistent returns and appreciation of capital by investing in mix of securities comprising of Equity, Equity related instruments & fixed income instruments. Nippon India Equity Hybrid Fund is a Hybrid - Hybrid Equity fund was launched on 8 Jun 05. It is a fund with Moderately High risk and has given a Below is the key information for Nippon India Equity Hybrid Fund Returns up to 1 year are on (Erstwhile Franklin India Balanced Fund) The fund aims to provide long term capital appreciation and current income by investing in equity and equity related securities and high quality fixed income instruments. Franklin India Equity Hybrid Fund is a Hybrid - Hybrid Equity fund was launched on 10 Dec 99. It is a fund with Moderately High risk and has given a Below is the key information for Franklin India Equity Hybrid Fund Returns up to 1 year are on (Erstwhile HDFC Premier Multi-Cap Fund and HDFC Balanced Fund) To generate capital appreciation in the long term through equity
investments by investing in a diversified portfolio of Mid Cap & Large Cap ‘blue chip’ companies. HDFC Hybrid Equity Fund is a Hybrid - Hybrid Equity fund was launched on 6 Apr 05. It is a fund with Moderately High risk and has given a Below is the key information for HDFC Hybrid Equity Fund Returns up to 1 year are on Fund NAV Net Assets (Cr) 3 MO (%) 6 MO (%) 1 YR (%) 3 YR (%) 5 YR (%) 2023 (%) ICICI Prudential Multi-Asset Fund Growth ₹655.458
↑ 2.30 ₹36,843 8.3 20 33.7 24.8 19.6 24.1 Edelweiss Multi Asset Allocation Fund Growth ₹55.45 ₹1,440 6.2 21 33.8 19.8 16.8 25.4 UTI Multi Asset Fund Growth ₹66.3531
↑ 0.01 ₹1,394 9 26.4 39.9 18.3 14.6 29.1 Note: Returns up to 1 year are on absolute basis & more than 1 year are on CAGR basis. as on 29 Apr 24 AUM >= 200 കോടി & അടുക്കി3 വർഷംസിഎജിആർ മടങ്ങുക.1. HDFC Balanced Advantage Fund
CAGR/Annualized return of 18.6% since its launch. Ranked 23 in Dynamic Allocation category. Return for 2023 was 31.3% , 2022 was 18.8% and 2021 was 26.4% . HDFC Balanced Advantage Fund
Growth Launch Date 11 Sep 00 NAV (30 Apr 24) ₹468.042 ↑ 1.31 (0.28 %) Net Assets (Cr) ₹79,875 on 31 Mar 24 Category Hybrid - Dynamic Allocation AMC HDFC Asset Management Company Limited Rating ☆☆☆☆ Risk Moderately High Expense Ratio 1.61 Sharpe Ratio 3.3 Information Ratio 0 Alpha Ratio 0 Min Investment 5,000 Min SIP Investment 300 Exit Load 0-1 Years (1%),1 Years and above(NIL) Growth of 10,000 investment over the years.
Date Value 30 Apr 19 ₹10,000 30 Apr 20 ₹8,275 30 Apr 21 ₹11,770 30 Apr 22 ₹14,576 30 Apr 23 ₹16,803 30 Apr 24 ₹23,501 Returns for HDFC Balanced Advantage Fund
absolute basis & more than 1 year are on CAGR (Compound Annual Growth Rate) basis. as on 30 Apr 24 Duration Returns 1 Month 3.7% 3 Month 5.4% 6 Month 23.7% 1 Year 39.9% 3 Year 25.9% 5 Year 18.6% 10 Year 15 Year Since launch 18.6% Historical performance (Yearly) on absolute basis
Year Returns 2023 31.3% 2022 18.8% 2021 26.4% 2020 7.6% 2019 6.9% 2018 -3.1% 2017 27.9% 2016 9.4% 2015 0.3% 2014 51.8% Fund Manager information for HDFC Balanced Advantage Fund
Name Since Tenure Anil Bamboli 29 Jul 22 1.68 Yr. Gopal Agrawal 29 Jul 22 1.68 Yr. Arun Agarwal 6 Oct 22 1.49 Yr. Srinivasan Ramamurthy 29 Jul 22 1.68 Yr. Nirman Morakhia 15 Feb 23 1.13 Yr. Dhruv Muchhal 22 Jun 23 0.78 Yr. Data below for HDFC Balanced Advantage Fund as on 31 Mar 24
Asset Allocation
Asset Class Value Cash 15.5% Equity 57.04% Debt 27.46% Equity Sector Allocation
Sector Value Financial Services 23.48% Industrials 10.46% Energy 8.84% Utility 6.09% Consumer Cyclical 4.2% Technology 4.1% Health Care 3.74% Consumer Defensive 2.68% Basic Materials 1.93% Communication Services 1.87% Real Estate 1.44% Debt Sector Allocation
Sector Value Government 18.08% Cash Equivalent 15.25% Corporate 9.63% Credit Quality
Rating Value AA 1.65% AAA 96.73% Top Securities Holdings / Portfolio
Name Holding Value Quantity HDFC Bank Ltd (Financial Services)
Equity, Since 31 Mar 22 | HDFCBANK6% ₹4,741 Cr 32,745,251
↑ 940,500 Coal India Ltd (Energy)
Equity, Since 31 Jan 18 | COALINDIA4% ₹3,133 Cr 72,171,400
↓ -1,528,600 State Bank of India (Financial Services)
Equity, Since 31 May 07 | SBIN4% ₹3,041 Cr 40,426,000 ICICI Bank Ltd (Financial Services)
Equity, Since 31 Oct 09 | ICICIBANK3% ₹2,795 Cr 25,564,524 7.38% Govt Stock 2027
Sovereign Bonds | -3% ₹2,751 Cr 272,581,800 NTPC Ltd (Utilities)
Equity, Since 31 Aug 16 | 5325553% ₹2,711 Cr 80,739,943
↑ 564,000 Larsen & Toubro Ltd (Industrials)
Equity, Since 30 Jun 12 | LT3% ₹2,118 Cr 5,627,883
↑ 71,700 Reliance Industries Ltd (Energy)
Equity, Since 31 Dec 21 | RELIANCE3% ₹2,077 Cr 6,988,933
↑ 316,250 Infosys Ltd (Technology)
Equity, Since 31 Oct 09 | INFY2% ₹1,941 Cr 12,955,098
↑ 988,000 ITC Ltd (Consumer Defensive)
Equity, Since 30 Apr 18 | ITC2% ₹1,778 Cr 41,497,726
↑ 20,800 2. ICICI Prudential Equity and Debt Fund
CAGR/Annualized return of 15.6% since its launch. Ranked 7 in Hybrid Equity category. Return for 2023 was 28.2% , 2022 was 11.7% and 2021 was 41.7% . ICICI Prudential Equity and Debt Fund
Growth Launch Date 3 Nov 99 NAV (30 Apr 24) ₹344.81 ↓ -0.15 (-0.04 %) Net Assets (Cr) ₹33,502 on 31 Mar 24 Category Hybrid - Hybrid Equity AMC ICICI Prudential Asset Management Company Limited Rating ☆☆☆☆ Risk Moderately High Expense Ratio 1.78 Sharpe Ratio 3.84 Information Ratio 2.49 Alpha Ratio 12.16 Min Investment 5,000 Min SIP Investment 100 Exit Load 0-1 Years (1%),1 Years and above(NIL) Growth of 10,000 investment over the years.
Date Value 30 Apr 19 ₹10,000 30 Apr 20 ₹8,728 30 Apr 21 ₹12,842 30 Apr 22 ₹16,797 30 Apr 23 ₹18,238 30 Apr 24 ₹25,631 Returns for ICICI Prudential Equity and Debt Fund
absolute basis & more than 1 year are on CAGR (Compound Annual Growth Rate) basis. as on 30 Apr 24 Duration Returns 1 Month 2.4% 3 Month 7.7% 6 Month 24.1% 1 Year 40.5% 3 Year 25.9% 5 Year 20.7% 10 Year 15 Year Since launch 15.6% Historical performance (Yearly) on absolute basis
Year Returns 2023 28.2% 2022 11.7% 2021 41.7% 2020 9% 2019 9.3% 2018 -1.9% 2017 24.8% 2016 13.7% 2015 2.1% 2014 45.6% Fund Manager information for ICICI Prudential Equity and Debt Fund
Name Since Tenure Sankaran Naren 7 Dec 15 8.32 Yr. Manish Banthia 19 Sep 13 10.54 Yr. Mittul Kalawadia 29 Dec 20 3.26 Yr. Akhil Kakkar 22 Jan 24 0.19 Yr. Sri Sharma 30 Apr 21 2.92 Yr. Sharmila D’mello 31 Jul 22 1.67 Yr. Data below for ICICI Prudential Equity and Debt Fund as on 31 Mar 24
Asset Allocation
Asset Class Value Cash 4.87% Equity 76.15% Debt 18.97% Other 0% Equity Sector Allocation
Sector Value Financial Services 18.92% Consumer Cyclical 12.58% Energy 7.86% Utility 7.26% Communication Services 6.01% Health Care 5.67% Industrials 4.63% Technology 4.55% Consumer Defensive 3.95% Basic Materials 3.14% Real Estate 1.57% Debt Sector Allocation
Sector Value Government 11.77% Corporate 7.7% Cash Equivalent 4.37% Credit Quality
Rating Value A 3.71% AA 30.59% AAA 63.88% Top Securities Holdings / Portfolio
Name Holding Value Quantity ICICI Bank Ltd (Financial Services)
Equity, Since 31 Jul 12 | ICICIBANK7% ₹2,404 Cr 21,991,832 NTPC Ltd (Utilities)
Equity, Since 28 Feb 17 | 5325557% ₹2,340 Cr 69,672,100
↓ -714,703 Bharti Airtel Ltd (Communication Services)
Equity, Since 31 May 16 | BHARTIARTL5% ₹1,793 Cr 14,595,380 Maruti Suzuki India Ltd (Consumer Cyclical)
Equity, Since 31 Jul 21 | MARUTI5% ₹1,613 Cr 1,280,135 Reliance Industries Ltd (Energy)
Equity, Since 30 Jun 22 | RELIANCE4% ₹1,325 Cr 4,459,343 HDFC Bank Ltd (Financial Services)
Equity, Since 30 Apr 21 | HDFCBANK4% ₹1,320 Cr 9,116,385 Sun Pharmaceuticals Industries Ltd (Healthcare)
Equity, Since 31 May 16 | SUNPHARMA4% ₹1,306 Cr 8,056,414
↑ 220,779 7.18% Govt Stock 2033
Sovereign Bonds | -4% ₹1,217 Cr 120,666,240 Oil & Natural Gas Corp Ltd (Energy)
Equity, Since 30 Apr 17 | 5003123% ₹1,065 Cr 39,721,201 8.25% Govt Stock 2033
Sovereign Bonds | -3% ₹1,058 Cr 104,079,550
↓ -1,200,000 3. ICICI Prudential Multi-Asset Fund
CAGR/Annualized return of 21.5% since its launch. Ranked 53 in Multi Asset category. Return for 2023 was 24.1% , 2022 was 16.8% and 2021 was 34.7% . ICICI Prudential Multi-Asset Fund
Growth Launch Date 31 Oct 02 NAV (29 Apr 24) ₹655.458 ↑ 2.30 (0.35 %) Net Assets (Cr) ₹36,843 on 31 Mar 24 Category Hybrid - Multi Asset AMC ICICI Prudential Asset Management Company Limited Rating ☆☆ Risk Moderately High Expense Ratio 1.83 Sharpe Ratio 3.6 Information Ratio 0 Alpha Ratio 0 Min Investment 5,000 Min SIP Investment 100 Exit Load 0-1 Years (1%),1 Years and above(NIL) Growth of 10,000 investment over the years.
Date Value 30 Apr 19 ₹10,000 30 Apr 20 ₹8,959 30 Apr 21 ₹12,653 30 Apr 22 ₹16,469 30 Apr 23 ₹18,393 30 Apr 24 ₹24,547 Returns for ICICI Prudential Multi-Asset Fund
absolute basis & more than 1 year are on CAGR (Compound Annual Growth Rate) basis. as on 30 Apr 24 Duration Returns 1 Month 3.2% 3 Month 8.3% 6 Month 20% 1 Year 33.7% 3 Year 24.8% 5 Year 19.6% 10 Year 15 Year Since launch 21.5% Historical performance (Yearly) on absolute basis
Year Returns 2023 24.1% 2022 16.8% 2021 34.7% 2020 9.9% 2019 7.7% 2018 -2.2% 2017 28.2% 2016 12.5% 2015 -1.4% 2014 37% Fund Manager information for ICICI Prudential Multi-Asset Fund
Name Since Tenure Sankaran Naren 1 Feb 12 12.17 Yr. Manish Banthia 22 Jan 24 0.19 Yr. Ihab Dalwai 3 Jun 17 6.83 Yr. Akhil Kakkar 22 Jan 24 0.19 Yr. Sri Sharma 30 Apr 21 2.92 Yr. Gaurav Chikane 2 Aug 21 2.67 Yr. Sharmila D’mello 31 Jul 22 1.67 Yr. Data below for ICICI Prudential Multi-Asset Fund as on 31 Mar 24
Asset Allocation
Asset Class Value Cash 18.47% Equity 67.9% Debt 8.52% Other 5.11% Equity Sector Allocation
Sector Value Financial Services 20.19% Consumer Cyclical 7.86% Energy 7.14% Basic Materials 5.35% Utility 5.26% Consumer Defensive 4.88% Health Care 4.61% Industrials 4.26% Technology 4.24% Communication Services 3.06% Real Estate 1.04% Debt Sector Allocation
Sector Value Cash Equivalent 16.11% Government 6.18% Corporate 4.71% Credit Quality
Rating Value A 2.97% AA 13.53% AAA 83.49% Top Securities Holdings / Portfolio
Name Holding Value Quantity ICICI Bank Ltd (Financial Services)
Equity, Since 31 May 06 | ICICIBANK6% ₹2,059 Cr 18,829,681 HDFC Bank Ltd (Financial Services)
Equity, Since 31 Jan 22 | HDFCBANK4% ₹1,633 Cr 11,277,759
↑ 220,000 NTPC Ltd (Utilities)
Equity, Since 31 Mar 17 | 5325554% ₹1,573 Cr 46,833,163
↓ -2,214,000 Maruti Suzuki India Ltd (Consumer Cyclical)
Equity, Since 31 Aug 21 | MARUTI4% ₹1,458 Cr 1,157,159 Reliance Industries Ltd (Energy)
Equity, Since 31 Dec 20 | RELIANCE3% ₹1,176 Cr 3,956,373
↑ 128,615 ICICI Pru Gold ETF
- | -3% ₹1,019 Cr 174,388,851
↓ -4,700,000 ICICI Pru Liquid Dir Gr
Investment Fund | -3% ₹1,001 Cr 28,020,769
↑ 28,020,769 ICICI Prudential Silver ETF
- | -2% ₹908 Cr 120,250,750
↑ 15,040,530 SBI Cards and Payment Services Ltd Ordinary Shares (Financial Services)
Equity, Since 30 Nov 22 | 5430662% ₹836 Cr 12,250,556 Bharti Airtel Ltd (Communication Services)
Equity, Since 31 May 16 | BHARTIARTL2% ₹799 Cr 6,505,066
↓ -561,450 4. BOI AXA Mid and Small Cap Equity and Debt Fund
CAGR/Annualized return of 17.3% since its launch. Return for 2023 was 33.7% , 2022 was -4.8% and 2021 was 54.5% . BOI AXA Mid and Small Cap Equity and Debt Fund
Growth Launch Date 20 Jul 16 NAV (30 Apr 24) ₹34.59 ↓ -0.02 (-0.06 %) Net Assets (Cr) ₹665 on 31 Mar 24 Category Hybrid - Hybrid Equity AMC BOI AXA Investment Mngrs Private Ltd Rating Risk Moderately High Expense Ratio 2.58 Sharpe Ratio 3.14 Information Ratio 0 Alpha Ratio 0 Min Investment 5,000 Min SIP Investment 1,000 Exit Load 0-1 Years (1%),1 Years and above(NIL) Growth of 10,000 investment over the years.
Date Value 30 Apr 19 ₹10,000 30 Apr 20 ₹8,898 30 Apr 21 ₹14,197 30 Apr 22 ₹17,961 30 Apr 23 ₹18,299 30 Apr 24 ₹27,236 Returns for BOI AXA Mid and Small Cap Equity and Debt Fund
absolute basis & more than 1 year are on CAGR (Compound Annual Growth Rate) basis. as on 30 Apr 24 Duration Returns 1 Month 5.9% 3 Month 7.5% 6 Month 26.1% 1 Year 48.8% 3 Year 24.3% 5 Year 22.2% 10 Year 15 Year Since launch 17.3% Historical performance (Yearly) on absolute basis
Year Returns 2023 33.7% 2022 -4.8% 2021 54.5% 2020 31.1% 2019 -4.7% 2018 -14.2% 2017 47.1% 2016 2015 2014 Fund Manager information for BOI AXA Mid and Small Cap Equity and Debt Fund
Name Since Tenure Alok Singh 16 Feb 17 7.13 Yr. Data below for BOI AXA Mid and Small Cap Equity and Debt Fund as on 31 Mar 24
Asset Allocation
Asset Class Value Cash 8.42% Equity 76.97% Debt 14.61% Equity Sector Allocation
Sector Value Basic Materials 14.92% Financial Services 13.9% Consumer Cyclical 13.55% Industrials 9.45% Health Care 8% Energy 5.87% Consumer Defensive 4.31% Technology 3.37% Communication Services 2.74% Utility 0.87% Debt Sector Allocation
Sector Value Government 12.35% Corporate 5.89% Cash Equivalent 4.79% Credit Quality
Rating Value AAA 100% Top Securities Holdings / Portfolio
Name Holding Value Quantity Jindal Stainless Ltd (Basic Materials)
Equity, Since 30 Sep 21 | 5325084% ₹26 Cr 375,000
↑ 70,000 Oil India Ltd (Energy)
Equity, Since 31 Mar 23 | 5331064% ₹24 Cr 406,000 Indian Railway Finance Corporation Limited
Debentures | -3% ₹20 Cr 2,000,000
↑ 2,000,000 Indus Towers Ltd Ordinary Shares (Communication Services)
Equity, Since 31 Jan 24 | 5348163% ₹18 Cr 625,000 UNO Minda Ltd (Consumer Cyclical)
Equity, Since 31 Jul 19 | 5325392% ₹16 Cr 230,000
↑ 10,000 Power Grid Corporation Of India Limited
Debentures | -2% ₹15 Cr 150,000,000 Castrol India Ltd (Energy)
Equity, Since 31 Jan 24 | 5008702% ₹15 Cr 790,000
↑ 170,000 JK Cement Ltd (Basic Materials)
Equity, Since 31 Aug 22 | JKCEMENT2% ₹15 Cr 36,000
↑ 4,100 CRISIL Ltd (Financial Services)
Equity, Since 29 Feb 24 | 5000922% ₹14 Cr 27,000 Indian Bank (Financial Services)
Equity, Since 31 Aug 23 | 5328142% ₹14 Cr 260,000
↑ 80,000 5. JM Equity Hybrid Fund
CAGR/Annualized return of 12.9% since its launch. Ranked 35 in Hybrid Equity category. Return for 2023 was 33.8% , 2022 was 8.1% and 2021 was 22.9% . JM Equity Hybrid Fund
Growth Launch Date 1 Apr 95 NAV (30 Apr 24) ₹113.5 ↑ 0.48 (0.43 %) Net Assets (Cr) ₹223 on 31 Mar 24 Category Hybrid - Hybrid Equity AMC JM Financial Asset Management Limited Rating ☆ Risk Moderately High Expense Ratio 2.46 Sharpe Ratio 3.58 Information Ratio 1.33 Alpha Ratio 20.88 Min Investment 5,000 Min SIP Investment 500 Exit Load 0-60 Days (1%),60 Days and above(NIL) Growth of 10,000 investment over the years.
Date Value 30 Apr 19 ₹10,000 30 Apr 20 ₹7,686 30 Apr 21 ₹12,727 30 Apr 22 ₹14,191 30 Apr 23 ₹15,617 30 Apr 24 ₹24,409 Returns for JM Equity Hybrid Fund
absolute basis & more than 1 year are on CAGR (Compound Annual Growth Rate) basis. as on 30 Apr 24 Duration Returns 1 Month 7.2% 3 Month 8.9% 6 Month 31.1% 1 Year 56.3% 3 Year 24.2% 5 Year 19.5% 10 Year 15 Year Since launch 12.9% Historical performance (Yearly) on absolute basis
Year Returns 2023 33.8% 2022 8.1% 2021 22.9% 2020 30.5% 2019 -8.1% 2018 1.7% 2017 18.5% 2016 3% 2015 -0.2% 2014 33.4% Fund Manager information for JM Equity Hybrid Fund
Name Since Tenure Asit Bhandarkar 31 Dec 21 2.25 Yr. Gurvinder Wasan 1 Dec 22 1.33 Yr. Chaitanya Choksi 20 Aug 21 2.62 Yr. Data below for JM Equity Hybrid Fund as on 31 Mar 24
Asset Allocation
Asset Class Value Cash 5.42% Equity 75.11% Debt 19.48% Equity Sector Allocation
Sector Value Financial Services 16.15% Consumer Cyclical 15.38% Industrials 13.74% Technology 8.91% Health Care 6.7% Communication Services 4.6% Consumer Defensive 3.48% Real Estate 2.23% Energy 1.77% Utility 1.2% Basic Materials 0.95% Debt Sector Allocation
Sector Value Corporate 10.68% Government 8.79% Cash Equivalent 5.42% Credit Quality
Rating Value AAA 100% Top Securities Holdings / Portfolio
Name Holding Value Quantity 7.18% Govt Stock 2037
Sovereign Bonds | -5% ₹12 Cr 1,200,000
↑ 300,000 ICICI Bank Ltd (Financial Services)
Equity, Since 31 Oct 21 | ICICIBANK5% ₹11 Cr 101,000
↑ 36,900 Larsen & Toubro Ltd (Industrials)
Equity, Since 31 May 21 | LT4% ₹9 Cr 23,000
↑ 11,000 Bharti Airtel Ltd (Communication Services)
Equity, Since 31 Mar 24 | BHARTIARTL4% ₹8 Cr 65,000
↑ 65,000 Bank of Baroda (Financial Services)
Equity, Since 31 Dec 23 | 5321343% ₹7 Cr 282,000
↑ 100,000 Infosys Ltd (Technology)
Equity, Since 30 Nov 20 | INFY3% ₹7 Cr 44,050 Mahindra & Mahindra Ltd (Consumer Cyclical)
Equity, Since 29 Feb 24 | M&M3% ₹6 Cr 33,000 Tata Consultancy Services Ltd (Technology)
Equity, Since 29 Feb 24 | TCS3% ₹6 Cr 16,000
↑ 3,000 Tata Motors Ltd Class A (Consumer Cyclical)
Equity, Since 31 Jul 23 | TATAMTRDVR3% ₹6 Cr 91,000 REC Ltd (Financial Services)
Equity, Since 30 Nov 22 | 5329553% ₹6 Cr 130,500
↓ -3,500 6. Edelweiss Multi Asset Allocation Fund
CAGR/Annualized return of since its launch. Ranked 71 in Multi Asset category. Return for 2023 was 25.4% , 2022 was 5.3% and 2021 was 27.1% . Edelweiss Multi Asset Allocation Fund
Growth Launch Date 12 Aug 09 NAV (30 Apr 24) ₹55.45 Net Assets (Cr) ₹1,440 on 31 Mar 24 Category Hybrid - Multi Asset AMC Edelweiss Asset Management Limited Rating ☆ Risk Moderately High Expense Ratio 2.5 Sharpe Ratio 3.14 Information Ratio 1.86 Alpha Ratio 5.81 Min Investment 5,000 Min SIP Investment 500 Exit Load NIL Growth of 10,000 investment over the years.
Date Value 30 Apr 19 ₹10,000 30 Apr 20 ₹9,207 30 Apr 21 ₹12,641 30 Apr 22 ₹15,012 30 Apr 23 ₹16,260 30 Apr 24 ₹21,762 Returns for Edelweiss Multi Asset Allocation Fund
absolute basis & more than 1 year are on CAGR (Compound Annual Growth Rate) basis. as on 30 Apr 24 Duration Returns 1 Month 2.5% 3 Month 6.2% 6 Month 21% 1 Year 33.8% 3 Year 19.8% 5 Year 16.8% 10 Year 15 Year Since launch Historical performance (Yearly) on absolute basis
Year Returns 2023 25.4% 2022 5.3% 2021 27.1% 2020 12.7% 2019 10.4% 2018 -0.1% 2017 26.1% 2016 0.2% 2015 2.2% 2014 38.4% Fund Manager information for Edelweiss Multi Asset Allocation Fund
Name Since Tenure Dhawal Dalal 23 Nov 21 2.36 Yr. Bhavesh Jain 14 Oct 15 8.47 Yr. Bharat Lahoti 1 Oct 21 2.5 Yr. Data below for Edelweiss Multi Asset Allocation Fund as on 31 Mar 24
Asset Allocation
Asset Class Value Cash 3.79% Equity 77.53% Debt 18.68% Other 0% Equity Sector Allocation
Sector Value Financial Services 22.62% Consumer Cyclical 11.89% Health Care 8.76% Energy 6.66% Industrials 6.45% Technology 6.18% Consumer Defensive 4.87% Utility 4.2% Communication Services 2.68% Basic Materials 2.57% Real Estate 0.66% Debt Sector Allocation
Sector Value Government 15.75% Cash Equivalent 3.41% Corporate 3.29% Securitized 0.02% Credit Quality
Rating Value AAA 100% Top Securities Holdings / Portfolio
Name Holding Value Quantity 7.06% Govt Stock 2028
Sovereign Bonds | -10% ₹150 Cr 15,000,000 ICICI Bank Ltd (Financial Services)
Equity, Since 31 Mar 15 | ICICIBANK5% ₹73 Cr 668,195
↑ 39,200 Reliance Industries Ltd (Energy)
Equity, Since 31 Aug 20 | RELIANCE3% ₹49 Cr 166,486 NTPC Ltd (Utilities)
Equity, Since 30 Nov 21 | 5325553% ₹45 Cr 1,336,578
↑ 375,806 HDFC Bank Ltd (Financial Services)
Equity, Since 31 Oct 15 | HDFCBANK3% ₹44 Cr 304,840
↑ 24,840 Sun Pharmaceuticals Industries Ltd (Healthcare)
Equity, Since 31 Oct 19 | SUNPHARMA3% ₹41 Cr 253,984
↑ 58,823 7.18% Govt Stock 2033
Sovereign Bonds | -3% ₹39 Cr 3,850,000 Bharti Airtel Ltd (Communication Services)
Equity, Since 31 Oct 19 | BHARTIARTL3% ₹38 Cr 313,328
↑ 47,763 Larsen & Toubro Ltd (Industrials)
Equity, Since 30 Jun 16 | LT3% ₹37 Cr 98,194 ITC Ltd (Consumer Defensive)
Equity, Since 30 Sep 16 | ITC2% ₹36 Cr 839,944 7. UTI Hybrid Equity Fund
CAGR/Annualized return of 15.2% since its launch. Ranked 12 in Hybrid Equity category. Return for 2023 was 25.5% , 2022 was 5.6% and 2021 was 30.5% . UTI Hybrid Equity Fund
Growth Launch Date 2 Jan 95 NAV (30 Apr 24) ₹354.171 ↑ 0.26 (0.07 %) Net Assets (Cr) ₹5,306 on 31 Mar 24 Category Hybrid - Hybrid Equity AMC UTI Asset Management Company Ltd Rating ☆☆☆ Risk Moderately High Expense Ratio 1.95 Sharpe Ratio 2.99 Information Ratio 1.4 Alpha Ratio 4.68 Min Investment 1,000 Min SIP Investment 500 Exit Load 0-12 Months (1%),12 Months and above(NIL) Growth of 10,000 investment over the years.
Date Value 30 Apr 19 ₹10,000 30 Apr 20 ₹8,472 30 Apr 21 ₹12,426 30 Apr 22 ₹14,518 30 Apr 23 ₹15,935 30 Apr 24 ₹21,058 Returns for UTI Hybrid Equity Fund
absolute basis & more than 1 year are on CAGR (Compound Annual Growth Rate) basis. as on 30 Apr 24 Duration Returns 1 Month 3.1% 3 Month 6% 6 Month 19.6% 1 Year 32.2% 3 Year 19.2% 5 Year 16.1% 10 Year 15 Year Since launch 15.2% Historical performance (Yearly) on absolute basis
Year Returns 2023 25.5% 2022 5.6% 2021 30.5% 2020 13.2% 2019 2.5% 2018 -5.6% 2017 25.7% 2016 8.8% 2015 2.4% 2014 32.8% Fund Manager information for UTI Hybrid Equity Fund
Name Since Tenure V Srivatsa 24 Sep 09 14.53 Yr. Sunil Patil 5 Feb 18 6.16 Yr. Data below for UTI Hybrid Equity Fund as on 31 Mar 24
Asset Allocation
Asset Class Value Cash 4.28% Equity 70.12% Debt 25.59% Other 0% Equity Sector Allocation
Sector Value Financial Services 22.19% Consumer Cyclical 10.54% Industrials 6.88% Health Care 6.31% Technology 6.08% Energy 5.16% Consumer Defensive 3.92% Basic Materials 3.5% Communication Services 2.54% Utility 2% Real Estate 0.99% Debt Sector Allocation
Sector Value Government 17.54% Corporate 8.23% Cash Equivalent 4.11% Credit Quality
Rating Value AA 9.94% AAA 90.06% Top Securities Holdings / Portfolio
Name Holding Value Quantity 7.18% Govt Stock 2037
Sovereign Bonds | -7% ₹368 Cr 3,650,000,000
↑ 900,000,000 HDFC Bank Ltd (Financial Services)
Equity, Since 29 Feb 20 | HDFCBANK7% ₹361 Cr 2,495,825 ICICI Bank Ltd (Financial Services)
Equity, Since 31 Mar 10 | ICICIBANK6% ₹321 Cr 2,933,979
↑ 66,575 Reliance Industries Ltd (Energy)
Equity, Since 31 Dec 19 | RELIANCE4% ₹229 Cr 770,258 Larsen & Toubro Ltd (Industrials)
Equity, Since 31 Mar 12 | LT3% ₹178 Cr 473,882 Infosys Ltd (Technology)
Equity, Since 31 Mar 06 | INFY3% ₹176 Cr 1,174,118
↓ -86,546 7.18% Govt Stock 2033
Sovereign Bonds | -3% ₹163 Cr 1,617,800,000
↑ 1,000,000,000 ITC Ltd (Consumer Defensive)
Equity, Since 31 Aug 06 | ITC3% ₹152 Cr 3,544,914
↑ 290,494 Mahindra & Mahindra Ltd (Consumer Cyclical)
Equity, Since 31 Mar 21 | M&M3% ₹144 Cr 748,614 7.41% Govt Stock 2036
Sovereign Bonds | -2% ₹128 Cr 1,250,000,000 8. UTI Multi Asset Fund
CAGR/Annualized return of 13% since its launch. Ranked 34 in Multi Asset category. Return for 2023 was 29.1% , 2022 was 4.4% and 2021 was 11.8% . UTI Multi Asset Fund
Growth Launch Date 21 Oct 08 NAV (30 Apr 24) ₹66.3531 ↑ 0.01 (0.01 %) Net Assets (Cr) ₹1,394 on 31 Mar 24 Category Hybrid - Multi Asset AMC UTI Asset Management Company Ltd Rating ☆ Risk Moderately High Expense Ratio 1.61 Sharpe Ratio 3.9 Information Ratio 0 Alpha Ratio 0 Min Investment 5,000 Min SIP Investment 500 Exit Load 0-12 Months (1%),12 Months and above(NIL) Growth of 10,000 investment over the years.
Date Value 30 Apr 19 ₹10,000 30 Apr 20 ₹9,595 30 Apr 21 ₹11,910 30 Apr 22 ₹12,841 30 Apr 23 ₹14,099 30 Apr 24 ₹19,726 Returns for UTI Multi Asset Fund
absolute basis & more than 1 year are on CAGR (Compound Annual Growth Rate) basis. as on 30 Apr 24 Duration Returns 1 Month 3% 3 Month 9% 6 Month 26.4% 1 Year 39.9% 3 Year 18.3% 5 Year 14.6% 10 Year 15 Year Since launch 13% Historical performance (Yearly) on absolute basis
Year Returns 2023 29.1% 2022 4.4% 2021 11.8% 2020 13.1% 2019 3.9% 2018 -0.5% 2017 17.1% 2016 7.3% 2015 -3.7% 2014 22.7% Fund Manager information for UTI Multi Asset Fund
Name Since Tenure Sunil Patil 1 Sep 21 2.58 Yr. Sharwan Kumar Goyal 12 Nov 21 2.39 Yr. Data below for UTI Multi Asset Fund as on 31 Mar 24
Asset Allocation
Asset Class Value Cash 16.76% Equity 52.58% Debt 10.53% Other 20.13% Equity Sector Allocation
Sector Value Financial Services 16.93% Consumer Cyclical 13.32% Industrials 8.8% Consumer Defensive 6.79% Health Care 6.29% Energy 4.19% Technology 3.7% Utility 2.83% Real Estate 1.8% Basic Materials 1.55% Debt Sector Allocation
Sector Value Cash Equivalent 16.62% Government 9.86% Corporate 0.81% Credit Quality
Rating Value AAA 100% Top Securities Holdings / Portfolio
Name Holding Value Quantity UTI Gold ETF
- | -20% ₹283 Cr 49,753,787
↓ -2,053,928 Axis Bank Ltd (Financial Services)
Equity, Since 30 Apr 23 | 5322155% ₹70 Cr 671,158
↑ 338,750 Larsen & Toubro Ltd (Industrials)
Equity, Since 30 Apr 23 | LT4% ₹54 Cr 143,540
↑ 7,800 7.41% Govt Stock 2036
Sovereign Bonds | -4% ₹51 Cr 500,000,000 Future on Axis Bank Ltd
Derivatives | -3% -₹41 Cr 389,375
↑ 389,375 7.18% Govt Stock 2037
Sovereign Bonds | -3% ₹40 Cr 400,000,000
↑ 100,000,000 ITC Ltd (Consumer Defensive)
Equity, Since 31 Oct 22 | ITC3% ₹37 Cr 861,215
↑ 36,800 ICICI Bank Ltd (Financial Services)
Equity, Since 29 Feb 24 | ICICIBANK3% ₹35 Cr 319,238
↑ 20,106 NTPC Ltd (Utilities)
Equity, Since 31 Oct 22 | 5325552% ₹28 Cr 841,623 Tata Motors Ltd (Consumer Cyclical)
Equity, Since 31 Jul 23 | TATAMOTORS2% ₹27 Cr 271,486 9. Nippon India Equity Hybrid Fund
CAGR/Annualized return of 12.5% since its launch. Ranked 8 in Hybrid Equity category. Return for 2023 was 24.1% , 2022 was 6.6% and 2021 was 27.8% . Nippon India Equity Hybrid Fund
Growth Launch Date 8 Jun 05 NAV (30 Apr 24) ₹93.3426 ↓ -0.07 (-0.08 %) Net Assets (Cr) ₹3,435 on 31 Mar 24 Category Hybrid - Hybrid Equity AMC Nippon Life Asset Management Ltd. Rating ☆☆☆☆ Risk Moderately High Expense Ratio 2.06 Sharpe Ratio 2.94 Information Ratio 1.22 Alpha Ratio 3.86 Min Investment 500 Min SIP Investment 100 Exit Load 0-12 Months (1%),12 Months and above(NIL) Growth of 10,000 investment over the years.
Date Value 30 Apr 19 ₹10,000 30 Apr 20 ₹7,319 30 Apr 21 ₹10,742 30 Apr 22 ₹12,400 30 Apr 23 ₹13,423 30 Apr 24 ₹17,578 Returns for Nippon India Equity Hybrid Fund
absolute basis & more than 1 year are on CAGR (Compound Annual Growth Rate) basis. as on 30 Apr 24 Duration Returns 1 Month 2.5% 3 Month 5.6% 6 Month 18.9% 1 Year 31% 3 Year 17.8% 5 Year 11.9% 10 Year 15 Year Since launch 12.5% Historical performance (Yearly) on absolute basis
Year Returns 2023 24.1% 2022 6.6% 2021 27.8% 2020 -5.3% 2019 3% 2018 -4.9% 2017 29.5% 2016 4.2% 2015 8.7% 2014 43.2% Fund Manager information for Nippon India Equity Hybrid Fund
Name Since Tenure Meenakshi Dawar 10 Sep 21 2.56 Yr. Kinjal Desai 25 May 18 5.86 Yr. Sushil Budhia 1 Feb 20 4.16 Yr. Akshay Sharma 1 Dec 22 1.33 Yr. Data below for Nippon India Equity Hybrid Fund as on 31 Mar 24
Asset Allocation
Asset Class Value Cash 3.37% Equity 74.65% Debt 21.4% Other 0.59% Equity Sector Allocation
Sector Value Financial Services 23.07% Industrials 9.37% Consumer Cyclical 8.26% Health Care 7.62% Technology 6.17% Energy 5.76% Utility 3.81% Consumer Defensive 3.73% Basic Materials 3.1% Communication Services 2.8% Real Estate 0.94% Debt Sector Allocation
Sector Value Corporate 16.81% Government 4.59% Cash Equivalent 3.37% Credit Quality
Rating Value A 2.75% AA 45.24% AAA 52.01% Top Securities Holdings / Portfolio
Name Holding Value Quantity ICICI Bank Ltd (Financial Services)
Equity, Since 30 Apr 12 | ICICIBANK5% ₹172 Cr 1,570,000 HDFC Bank Ltd (Financial Services)
Equity, Since 31 Jul 10 | HDFCBANK5% ₹171 Cr 1,182,356 Reliance Industries Ltd (Energy)
Equity, Since 31 Jul 14 | RELIANCE4% ₹149 Cr 503,000 Larsen & Toubro Ltd (Industrials)
Equity, Since 28 Feb 13 | LT4% ₹134 Cr 354,838 Sun Pharmaceuticals Industries Ltd (Healthcare)
Equity, Since 31 Oct 11 | SUNPHARMA3% ₹113 Cr 700,000 Infosys Ltd (Technology)
Equity, Since 28 Feb 11 | INFY3% ₹109 Cr 730,000 NTPC Ltd (Utilities)
Equity, Since 31 Aug 20 | 5325553% ₹99 Cr 2,950,620 Axis Bank Ltd (Financial Services)
Equity, Since 30 Sep 18 | 5322153% ₹98 Cr 933,200 Bharti Airtel Ltd (Communication Services)
Equity, Since 31 Dec 19 | BHARTIARTL2% ₹84 Cr 685,000 State Bank of India (Financial Services)
Equity, Since 31 Jul 16 | SBIN2% ₹83 Cr 1,100,000 10. Franklin India Equity Hybrid Fund
CAGR/Annualized return of 14% since its launch. Ranked 16 in Hybrid Equity category. Return for 2023 was 22.5% , 2022 was 4.7% and 2021 was 23.8% . Franklin India Equity Hybrid Fund
Growth Launch Date 10 Dec 99 NAV (30 Apr 24) ₹241.784 ↓ -0.03 (-0.01 %) Net Assets (Cr) ₹1,714 on 31 Mar 24 Category Hybrid - Hybrid Equity AMC Franklin Templeton Asst Mgmt(IND)Pvt Ltd Rating ☆☆☆ Risk Moderately High Expense Ratio 2.22 Sharpe Ratio 2.72 Information Ratio 0.56 Alpha Ratio 3.45 Min Investment 5,000 Min SIP Investment 500 Exit Load 0-1 Years (1%),1 Years and above(NIL) Growth of 10,000 investment over the years.
Date Value 30 Apr 19 ₹10,000 30 Apr 20 ₹8,796 30 Apr 21 ₹12,666 30 Apr 22 ₹14,200 30 Apr 23 ₹15,067 30 Apr 24 ₹20,010 Returns for Franklin India Equity Hybrid Fund
absolute basis & more than 1 year are on CAGR (Compound Annual Growth Rate) basis. as on 30 Apr 24 Duration Returns 1 Month 2.8% 3 Month 5.7% 6 Month 19.9% 1 Year 32.8% 3 Year 16.5% 5 Year 14.9% 10 Year 15 Year Since launch 14% Historical performance (Yearly) on absolute basis
Year Returns 2023 22.5% 2022 4.7% 2021 23.8% 2020 13.7% 2019 7.9% 2018 -1.6% 2017 21% 2016 7.6% 2015 4.8% 2014 47% Fund Manager information for Franklin India Equity Hybrid Fund
Name Since Tenure Anuj Tagra 7 Mar 24 0.07 Yr. Chandni Gupta 7 Mar 24 0.07 Yr. Varun Sharma 1 Sep 23 0.58 Yr. Sandeep Manam 18 Oct 21 2.45 Yr. Rajasa Kakulavarapu 6 Sep 21 2.57 Yr. Data below for Franklin India Equity Hybrid Fund as on 31 Mar 24
Asset Allocation
Asset Class Value Cash 1.77% Equity 69.38% Debt 28.85% Equity Sector Allocation
Sector Value Financial Services 18.89% Industrials 11.44% Consumer Cyclical 11.03% Technology 6.47% Health Care 4.92% Utility 4.27% Energy 4.1% Consumer Defensive 2.99% Communication Services 2.83% Basic Materials 2.44% Debt Sector Allocation
Sector Value Corporate 15.25% Government 13.6% Cash Equivalent 1.77% Credit Quality
Rating Value AAA 100% Top Securities Holdings / Portfolio
Name Holding Value Quantity ICICI Bank Ltd (Financial Services)
Equity, Since 31 Oct 18 | ICICIBANK5% ₹92 Cr 839,000 HDFC Bank Ltd (Financial Services)
Equity, Since 31 Mar 07 | HDFCBANK4% ₹73 Cr 506,400 Larsen & Toubro Ltd (Industrials)
Equity, Since 31 Dec 19 | LT4% ₹72 Cr 191,263 5.63% Govt Stock 2026
Sovereign Bonds | -4% ₹65 Cr 6,500,000 Infosys Ltd (Technology)
Equity, Since 29 Feb 12 | INFY3% ₹53 Cr 356,567 LIC Housing Finance Ltd. 7.835%
Debentures | -3% ₹50 Cr 5,000
↑ 5,000 ICICI Home Finance Company Limited 8.1%
Debentures | -3% ₹50 Cr 5,000
↑ 5,000 5.74% Govt Stock 2026
Sovereign Bonds | -3% ₹50 Cr 5,000,000 Tata Motors Ltd (Consumer Cyclical)
Equity, Since 30 Sep 14 | TATAMOTORS3% ₹49 Cr 492,000 Reliance Industries Ltd (Energy)
Equity, Since 31 May 22 | RELIANCE3% ₹48 Cr 162,400
↑ 33,400 11. HDFC Hybrid Equity Fund
CAGR/Annualized return of 15.6% since its launch. Ranked 57 in Hybrid Equity category. Return for 2023 was 17.7% , 2022 was 8.9% and 2021 was 25.7% . HDFC Hybrid Equity Fund
Growth Launch Date 6 Apr 05 NAV (30 Apr 24) ₹106.555 ↓ -0.08 (-0.07 %) Net Assets (Cr) ₹22,697 on 31 Mar 24 Category Hybrid - Hybrid Equity AMC HDFC Asset Management Company Limited Rating ☆☆ Risk Moderately High Expense Ratio 1.76 Sharpe Ratio 1.88 Information Ratio 0 Alpha Ratio 0 Min Investment 5,000 Min SIP Investment 300 Exit Load 0-1 Years (1%),1 Years and above(NIL) Growth of 10,000 investment over the years.
Date Value 30 Apr 19 ₹10,000 30 Apr 20 ₹8,728 30 Apr 21 ₹12,552 30 Apr 22 ₹14,656 30 Apr 23 ₹16,249 30 Apr 24 ₹19,797 Returns for HDFC Hybrid Equity Fund
absolute basis & more than 1 year are on CAGR (Compound Annual Growth Rate) basis. as on 30 Apr 24 Duration Returns 1 Month 2.3% 3 Month 4.1% 6 Month 15% 1 Year 21.8% 3 Year 16.4% 5 Year 14.6% 10 Year 15 Year Since launch 15.6% Historical performance (Yearly) on absolute basis
Year Returns 2023 17.7% 2022 8.9% 2021 25.7% 2020 13.4% 2019 7.5% 2018 -2.8% 2017 27.5% 2016 9.7% 2015 3% 2014 51.5% Fund Manager information for HDFC Hybrid Equity Fund
Name Since Tenure Chirag Setalvad 2 Apr 07 17.01 Yr. Anupam Joshi 6 Oct 22 1.49 Yr. Dhruv Muchhal 22 Jun 23 0.78 Yr. Data below for HDFC Hybrid Equity Fund as on 31 Mar 24
Asset Allocation
Asset Class Value Cash 1.95% Equity 69.75% Debt 28.31% Equity Sector Allocation
Sector Value Financial Services 25.11% Industrials 11.75% Consumer Defensive 6.76% Technology 6.65% Energy 6.57% Health Care 3.59% Communication Services 3.4% Consumer Cyclical 2.88% Utility 1.5% Real Estate 0.73% Basic Materials 0.54% Debt Sector Allocation
Sector Value Government 16.9% Corporate 11.41% Cash Equivalent 1.95% Credit Quality
Rating Value AA 4.56% AAA 93.57% Top Securities Holdings / Portfolio
Name Holding Value Quantity ICICI Bank Ltd (Financial Services)
Equity, Since 30 Nov 10 | ICICIBANK7% ₹1,596 Cr 14,600,000 HDFC Bank Ltd (Financial Services)
Equity, Since 31 Aug 13 | HDFCBANK6% ₹1,439 Cr 9,940,000 Larsen & Toubro Ltd (Industrials)
Equity, Since 30 Nov 11 | LT5% ₹1,181 Cr 3,137,093 Reliance Industries Ltd (Energy)
Equity, Since 31 Mar 18 | RELIANCE5% ₹1,092 Cr 3,675,000 State Bank of India (Financial Services)
Equity, Since 31 Oct 11 | SBIN4% ₹941 Cr 12,508,071 ITC Ltd (Consumer Defensive)
Equity, Since 31 May 15 | ITC4% ₹857 Cr 20,000,000
↓ -2,814,004 Infosys Ltd (Technology)
Equity, Since 31 Jan 03 | INFY3% ₹782 Cr 5,223,368 Axis Bank Ltd (Financial Services)
Equity, Since 30 Apr 15 | 5322153% ₹759 Cr 7,250,000 Bharti Airtel Ltd (Communication Services)
Equity, Since 31 May 12 | BHARTIARTL3% ₹737 Cr 6,000,000 National Bank For Agriculture And Rural Development
Debentures | -3% ₹573 Cr 57,500
സമതുലിതമായ മ്യൂച്വൽ ഫണ്ടുകളിൽ ഓൺലൈനിൽ എങ്ങനെ നിക്ഷേപിക്കാം?
Fincash.com-ൽ ആജീവനാന്ത സൗജന്യ നിക്ഷേപ അക്കൗണ്ട് തുറക്കുക.
നിങ്ങളുടെ രജിസ്ട്രേഷനും KYC പ്രക്രിയയും പൂർത്തിയാക്കുക
രേഖകൾ അപ്ലോഡ് ചെയ്യുക (പാൻ, ആധാർ മുതലായവ).കൂടാതെ, നിങ്ങൾ നിക്ഷേപിക്കാൻ തയ്യാറാണ്!
ഇവിടെ നൽകിയിരിക്കുന്ന വിവരങ്ങൾ കൃത്യമാണെന്ന് ഉറപ്പാക്കാൻ എല്ലാ ശ്രമങ്ങളും നടത്തിയിട്ടുണ്ട്. എന്നിരുന്നാലും, ഡാറ്റയുടെ കൃത്യത സംബന്ധിച്ച് യാതൊരു ഉറപ്പും നൽകുന്നില്ല. എന്തെങ്കിലും നിക്ഷേപം നടത്തുന്നതിന് മുമ്പ് സ്കീം വിവര രേഖ ഉപയോഗിച്ച് പരിശോധിക്കുക.


AMFI Registration No. 112358 | CIN: U74999MH2016PTC282153
Shepard Technologies Pvt. Ltd. (with ARN code 112358) makes no warranties or representations, express or implied, on products offered through the platform. It accepts no liability for any damages or losses, however caused, in connection with the use of, or on the reliance of its product or related services. Terms and conditions of the website are applicable.
©2024 Shepard Technologies Private Limited. All Rights Reserved