Ready to Trade? Get to Know About Candlestick Patterns First!
Being a technical tool, candlestick charts are meant to pack data from different time frames into one price bars. This technique makes them more effective in comparison to traditional low-close and open-high bars; or even the simple lines that connect varying dots.
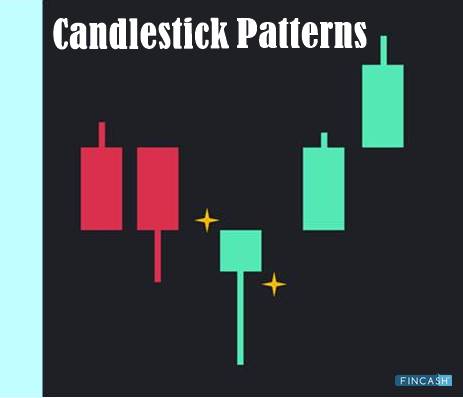
Candlesticks are famous for building patterns that foresee the direction of price. With adequate colour coding, you can add depth to the technical tool. What started as a Japanese trend somewhere in the 18th century has become an integral part of the stock market armoury.
Keeping this in mind, in this post, let’s figure out more about candlestick patterns and how they could be useful in stock readings.
What is Candlestick?
A candlestick is a substantial method of displaying information regarding the price movement of an asset. These charts are the accessible components of Technical Analysis, allowing traders to comprehend price information immediately from a few bars.
Every candlestick comprises three basic features, such as:
- Body: Representing the open-to-close range
- Wick (Shadow): Indicating the intra-day low and high
- Colour: Revealing the direction of the market’s movements
Over a period of time, individual candlesticks create patterns that traders can refer to while recognizing considerable resistance and support levels. There is a variety of candlestick patterns cheat sheet indicating opportunities within the market.
While some patterns help to identify the consistency in market indecision or patterns, some others give an insight into the balance between selling and purchasing pressures.
Talk to our investment specialist
Defining Patterns
With some of the best candlestick patterns, you can identify four primary prices of trading indexes or stocks, such as:
- Open: This represents the first price at which the execution of trade takes place whenever the market opens.
- High: During the day, it represents the highest price at which a trade can be executed.
- Low: During the day, it represents the lowest price at which a trade can be executed.
- Close: This signifies the last price at which the market is closed.
Generally, different colours are used to represent the bearish and bullish behaviour of the market. These colours basically vary from a chart to chart.
Bearish Candlestick Patterns
The structure of a bearish pattern comprises three different aspects, such as:
- Body: The central body is meant to signify the closing and opening price. In a bearish candlestick, the opening price is always higher than the closing price.
- Head: Also known as the upper shadow, the candlestick’s head is meant to connect the opening and the high price.
- Tail: Also known as the lower shadow, the tail of a candlestick is meant to connect the closing and the low price.
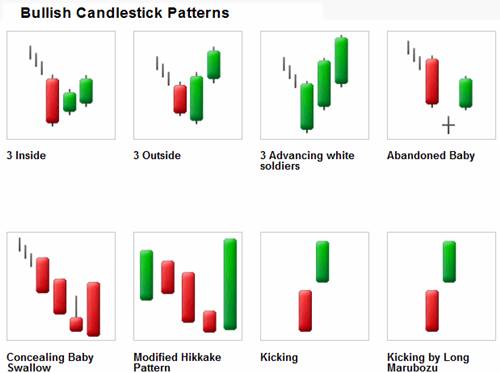
Bullish Candlestick Patterns
This one also comprises three aspects in its structure:
- Body: Although it represents the closing and opening price; however, unlike the bearish pattern, in bullish, body’s opening price is always lower than the closing price.
- Head: It is responsible for connecting the closing and the high price.
- Tail: It is responsible for connecting the opening and the low price.
Types of Candlestick Patterns
There are two different ways to categorize these patterns, such as:
Single Candlestick Patterns
In this one, candles could either be single or multiple, creating a specific pattern. They range from a minute to hours, days, weeks, months, and years. The larger the timeframe, the more will be the information regarding upcoming moves and trends. Some of the most important single candlestick patterns include:
- Marubozu (Bullish Marubozu and Bearish Marubozu)
- Paper Umbrella (Hammer and Hanging Man)
- Shooting Star
- Doji
- Spinning Tops
Multiple Candlestick Patterns
In this pattern, there are always two or more candles that form the behaviour of the trading stock. There are several types of patterns that are used to indicate several trading behaviours:
- Engulfing Pattern (Bullish Engulfing and Bearish Engulfing)
- Piercing Pattern
- Dark Cloud Cover
- Harami Pattern (Bullish Harami and Bearish Harami)
- Morning Star
- Evening Star
- Three White Soldiers
- Three Black Crows
Things to Keep in Mind Before Using a Candlestick Pattern
- When following any trend reversal candlestick pattern, make sure that you keep a tab on the previous trends.
- Based on your abilities to take a risk, either wait for another candlestick appearing in the same direction or place the trade just after the completion of pattern creation.
- Keep monitoring the volume, if the pattern has low volume, wait for some time before placing your trade.
- Keep a strict stop-loss and exit the trade as soon as it occurs
- Don’t follow any candlestick pattern blindly. Keep referring to other indicators side by side as well.
- Once you have entered a trade, have some patience and avoid correcting it.
Conclusion
The understanding of candlestick chart patterns has definitely come a long way. However, irrespective of the chart you are studying, the accuracy depends upon consistent study, knowledge of fine points, prolonged experience, and understanding of both fundamental and technical aspects. So, while there are several patterns that can be found, appropriate analysis and practice are required to reap the benefits.
All efforts have been made to ensure the information provided here is accurate. However, no guarantees are made regarding correctness of data. Please verify with scheme information document before making any investment.
You Might Also Like

Ready To Get Small Business Loan? Check These Schemes First!

Get Ready For India's First Ipo From A Cruise Line: Cordelia Cruises Plans ₹800 Crore Offering
")


Do You Get To Adopt The Provisions Of Section 44ad? Know Here!

Ready To Verify Your Returns? Know These Ways To Itr Verification

Get Ready To Fund Your Business With These Msme Loan Schemes

AMFI Registration No. 112358 | CIN: U74999MH2016PTC282153
Shepard Technologies Pvt. Ltd. (with ARN code 112358) makes no warranties or representations, express or implied, on products offered through the platform. It accepts no liability for any damages or losses, however caused, in connection with the use of, or on the reliance of its product or related services. Terms and conditions of the website are applicable.
©2026 Shepard Technologies Private Limited. All Rights Reserved