What is a Demand Schedule?
A demand schedule is a table expressing quantity demanded at varying prices and time. It is, thereby, represented in the form of a graph through the demand curve.
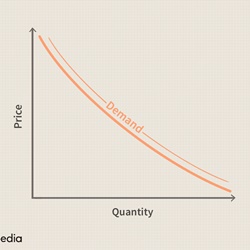
A demand curve expresses the relationship between price and demand of a commodity, other factors remaining constant.
What is a Law of Demand?
This relation between price and demand is postulated in the form of the law of demand. It is called a law due to the universality of its hypothesis. It states that other factors remaining constant; when the price of a commodity decreases, its demand in the market increases and vice versa. The other factors here being preferences, population size, consumer income, etc.
Most of the time, the inverse relationship between price and quantity might differ according to these other factors which affect the market determinants, which are the price and quantity. Hence, while pre-assuming the other factors remaining constant in the market, the demand curve moves towards the right when price increases in the graph (quantity being the dimension of x-axis and price being dimension of the y-axis.)
For instance, if you visit a cloth store, the costume cost depends on the number of its replicas available, which is their quantity, when there is just one single costume left, the price increases.
Thereby, when there is an increase in the price of a commodity, the demand for it decreases. Whereas if other factors, like consumer preference and their income, are varied, high affordability leads to an increase in demand with an increase in price due to consumer preference, like designer wear costumes.
Talk to our investment specialist
Demand Curve Formula
The formula of the Demand curve is:
Qd= a-b(P)
Where:
- ’Qd’ = quantity demanded
- ‘a’ = other factors influencing demand other than price (like income, population size, preferences etc.)
- ‘b’ = the slope
- ‘P’ = the price
Types of Demand Schedule
A demand schedule is tabulated in two different types:
- Individual demand schedule shows the variation in the individual quantity of a commodity demanded with respect to price
- On the other hand, the market demand schedule is an aggregate of quantity demanded by different individuals at varying prices of a commodity We arrive at an equilibrium quantity and price when the supply curve and demand curve intersect
To explain it in a normal context, suppose a person buys rice for daily consumption. Individual demand schedules enlist the quantity demanded concerning the price of rice of a single household.
| Price (Rs.) | Quantity (Kilos) |
|---|---|
| 120 | 1 |
| 110 | 3 |
| 100 | 5 |
The market demand schedule enlists the aggregated quantity demanded by different households with a varying price.
| Price (Rs.) | Household A | Household B | Aggregated Demand |
|---|---|---|---|
| 120 | 1 | 0 | 1 |
| 110 | 2 | 1 | 3 |
| 100 | 3 | 2 | 5 |
In day-to-day life, the law of demand applies to many activities, like budget, company marketing strategy, product designing and more.
All efforts have been made to ensure the information provided here is accurate. However, no guarantees are made regarding correctness of data. Please verify with scheme information document before making any investment.


AMFI Registration No. 112358 | CIN: U74999MH2016PTC282153
Shepard Technologies Pvt. Ltd. (with ARN code 112358) makes no warranties or representations, express or implied, on products offered through the platform. It accepts no liability for any damages or losses, however caused, in connection with the use of, or on the reliance of its product or related services. Terms and conditions of the website are applicable.
©2026 Shepard Technologies Private Limited. All Rights Reserved