What is a Demand Curve?
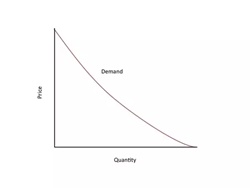
Demand Curve refers to the graphical representation of the relationship between a good’s or service’s price and the demanded quantity for a given period. In any of the typical demand curve diagram, the price for the curve appears on the left vertical axis and the demanded quantity on the horizontal axis.
Law of Demand
There is a downward movement in the demand curve from left to right, and this expresses the law of demand. Whenever there is an increase in the price of any commodity, the demanded quantity decreases while everything else stays equal.
This formulation indicates that the price is an independent variable and quantity is the dependent variable. While the independent variable is marked in the horizontal axis in most cases, the exception arises while representing economics.
In the law of demand, the relationship between the price and the quantity follows the demand curve when there is no evident change in the four determinants of demand. These determinants are as follows:
- Price for the goods or services related
- Buyer’s income
- Buyer’s preferences or tastes
- Buyer’s expectations
If there is a change in any of these four determinants, a shift in the entire demand curve arises as a new demand schedule must form to show the changed relationship between the quantity and the price.
The demand curve formula is:
Q = a - bP
Here;
- Q = linear demand curve
- a = factors influencing demand besides price
- b = slope
- P = price
Talk to our investment specialist
Demand Curve Example
To understand this concept better, let’s have an example of demand curve. In the table mentioned below, you can see how the price of bread changed with changes in its demand.
| Demand of Bread | Price of Bread |
|---|---|
| 1000 | INR 10 |
| 1200 | INR 9 |
| 1400 | INR 8 |
| 1700 | INR 7 |
| 2000 | INR 6 |
| 2400 | INR 5 |
| 3000 | INR 4 |
Now, let’s assume that the price of peanut butter, which is a complementary product, also decreases. How is this going to impact the demand curve for bread? Considering that peanut butter is a complementary product to bread, the decrease in its price will eventually increase the quantity demanded for bread and vice versa.
Types of Demand Curves
In reality, different goods show different relationships between the demand levels and the price associated. This leads to the production of different degrees of elasticity in the demand curve. Here are two main types of demand curves:
Elastic Demand
In this situation, a decrease in the price leads to a significant increase in the quantities and vice versa. This relationship is like a stretchy elastic band, where there is a significant rise in the demanded quantity with just a slight change in the price. In the case of elastic demand, the curve appears just like a perfect horizontal flat line.
Inelastic Demand
In the case of inelastic demand, there is no increase in the purchased quantities if there is a decrease in the price. In the perfectly inelastic demand, the curve appears like a perfectly vertical straight line.
Demand Curve Shifts
Consumer interest is the crucial factor that affects the shifts in the demand curve. But there are other factors, too, that lead to shifting in the curve, like:
Change in the level of income
The higher level of income leads to an outward shift in the demand curve, and the lower level leads to an inward shift. When the income increases, the demand for standard goods or services also increases.
Changes in the market size
There is an outward shift in the demand curve with a growing market and an inward shift with a shrinking market. There is a larger market size due to more consumers, and thus the demand increases.
Changes in the price of related services
When there is a decrease in the price of complementary goods, the demand curve shifts outward. However, If the price of the goods increases, the curve shifts inwards. And the opposite of this case is valid for the substitute goods.
All efforts have been made to ensure the information provided here is accurate. However, no guarantees are made regarding correctness of data. Please verify with scheme information document before making any investment.


AMFI Registration No. 112358 | CIN: U74999MH2016PTC282153
Shepard Technologies Pvt. Ltd. (with ARN code 112358) makes no warranties or representations, express or implied, on products offered through the platform. It accepts no liability for any damages or losses, however caused, in connection with the use of, or on the reliance of its product or related services. Terms and conditions of the website are applicable.
©2026 Shepard Technologies Private Limited. All Rights Reserved