J-Curve
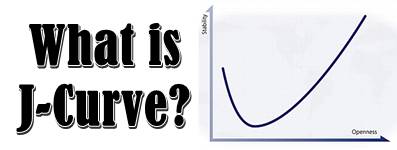
What is J-Curve?
J-curve definition implies an economic theory stating that, under specific assumptions, the trade deficit of a country is going to become worse initially after currency’s depreciation. This is primarily because of higher prices on the overall imports that tend to be higher in comparison to the lower volumes of imports.
The J Curve is known to operate as per the principle that trading volumes of exports and imports are known to experience only macroeconomic changes in the initial phases. However, with the overall progress of time, export levels start increasing dramatically. This happens due to the presence of more attractive prices to the foreign buyers. At the same time, domestic consumers are known to buy less imported products because of the overall higher costs.
The given set of parallel actions is known to shift the given trade balance. This helps in presenting smaller deficit and increased surplus in comparison to the figures before the process of devaluation. Effectively, the same economic rationale gets applied to opposite cases in which a nation would experience an appreciation in the currency –eventually resulting in the formation of an inverted J Curve.
An Insight into the J Curve Theory
There happens to be a lag between the response and devaluation on the given curve. Primarily, this happens due to the effect that in spite of the currency of the nation suffering a state of depreciation, the total value with respect to imports would increase. However, the exports of the country remain static until the trade contracts that pre-exist would play out.
Over the period of the long haul, increasing numbers of foreign customers might consider bumping up the overall purchase of products that are coming into the country from another country having devalued currency. The given products now tend to become cheaper in comparison to the products that are produced domestically.
Talk to our investment specialist
Applications of the J Curve
The concept of the J Curve serves to be a tool that is made use of across several fields. For instance, in the field of private equity, J Curve can be used for demonstrating how private Equity Funds ushered traditionally in negative returns after the starting post-launch years. However, later on, they started experiencing the gains after finding the respective footing. Private equity funds are known to consider early losses because the overall management fees and investment costs are known to absorb money initially. However, upon maturing of the funds, they start manifesting unrealized gains from previous transactions, with the help of events like IPOs (Initial Public Offerings), M&A (Mergers & Acquisitions), and leveraged recapitalizations.
In field of media, J Curve is known to appear in the form of graphs. In the graph, the X-axis is known to analyze either one or two conditions that are treatable (like blood pressure or cholesterol levels). The Y-axis is known to represent the chances of the patient developing cardiovascular problems.
All efforts have been made to ensure the information provided here is accurate. However, no guarantees are made regarding correctness of data. Please verify with scheme information document before making any investment.


AMFI Registration No. 112358 | CIN: U74999MH2016PTC282153
Shepard Technologies Pvt. Ltd. (with ARN code 112358) makes no warranties or representations, express or implied, on products offered through the platform. It accepts no liability for any damages or losses, however caused, in connection with the use of, or on the reliance of its product or related services. Terms and conditions of the website are applicable.
©2026 Shepard Technologies Private Limited. All Rights Reserved