What is a Bell Curve in Finance?
A bell curve is a colloquial term for a graph showing a normal probability distribution. The bell-shaped curve of the normal probability distribution graph is where the phrase got its name. The phrase is not entirely accurate, though, as there are other probability distributions whose graphs display bell-shaped curves in addition to the normal distribution. Graphs of the Cauchy and logistic distributions, for instance, likewise show a bell-shaped curve.
Features of a Bell Curve
The bell curve is symmetrical. It is concentrated around the top and gradually decreases on either side. The bell curve peak represents the most likely occurrence in the dataset, and all other events are evenly dispersed around the peak. The curve's peak shows the dataset's average (note that the mean in a normal probability distribution also equals the median and the mode). The Standard Deviation quantifies the bell curve's data dispersion. Several significant connections exist between the bell curve probabilities and the standard deviation. These includes:
- The data is within 1 standard deviation for around 68% of the time
- The data is within 2 standard deviations for about 95% of the data
- The data is within 3 standard deviations for about 99.7% of the time
The 68-95-99.7 rule, often known as the empirical rule, refers to the abovementioned relationships. The empirical rule largely determines a normal probability distribution's confidence interval. The notion is crucial to statistics since the normal probability distribution has various uses. For instance, the distribution of Random Variables whose true distribution is unknown is represented by the normal probability distribution.
Talk to our investment specialist
Formula to Calculate Bell Curve
The bell curve, a normal probability distribution of variables represented on a graph, depicts the event most likely to occur out of all the data in the series.
The Bell Curve formula is as follows:
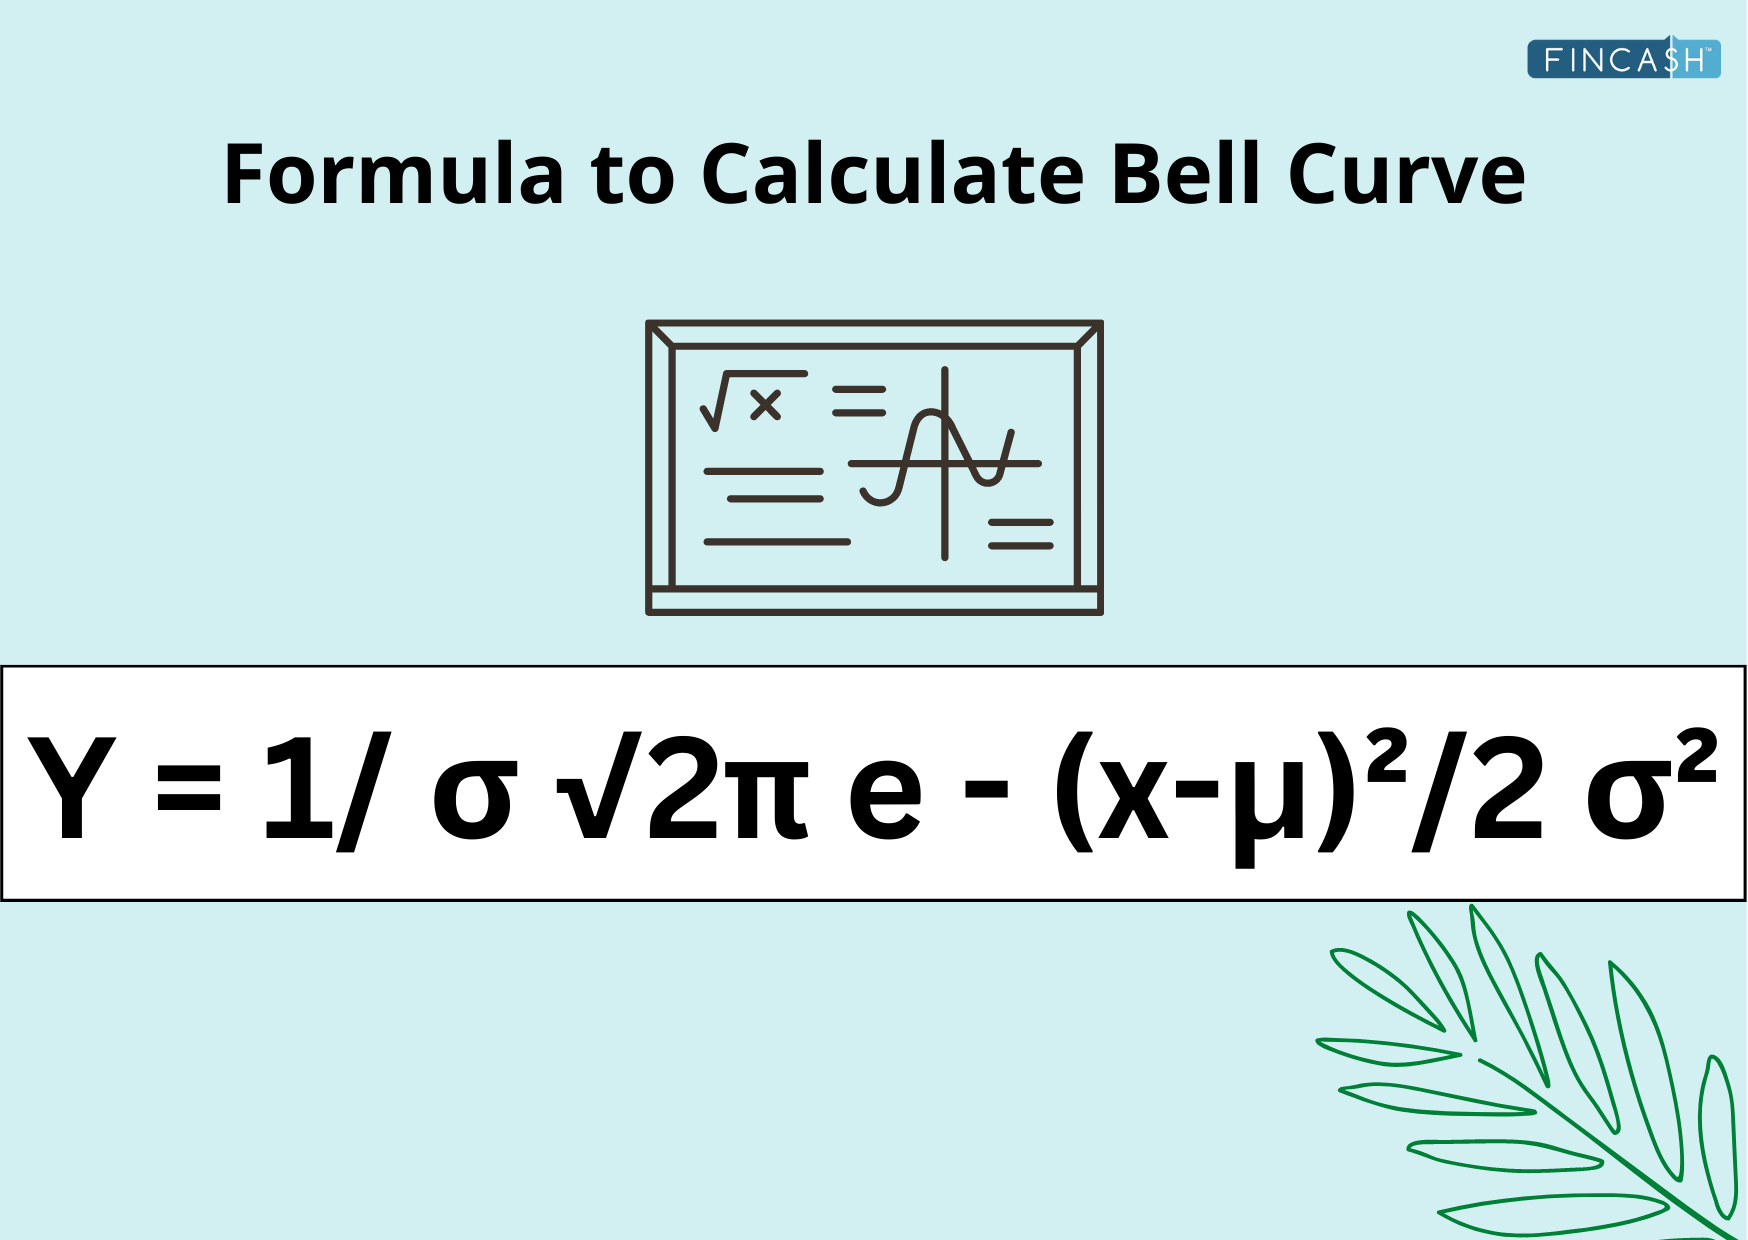
Y = 1/ σ √2π e - (x-μ)²/2 σ²
Where,
- μ is mean
- σ is a standard deviation
- π is 3.14159
- e is 2.71828
Properties of Bell Curve
Here is a list of some of the key properties of the bell curve one must know:
- The curve's entire area beneath the curve must equal one
- Precise half of the values should be to the right of the center, and the exact half should be to the left of the center
- The average, median, and mode are all equal in a normal distribution
- The curve expands further away from the mean and moves closer to the x-axis but never touches it
- The mean and standard deviation should be used to define the normal distribution
- There can be only one peak on the normal distribution curve, which is known as unimodal
- The center of the normally distributed curve needs to be symmetric
Application of Bell Curve in Finance
The bell curve and normal probability distribution are both important concepts in finance. The normal probability distribution is a useful tool for financial analysts when examining asset returns. Numerous pricing models that aim to forecast future returns start with the fundamental premise that data will be distributed normally. The normal probability distribution assumption in finance, however, must be used with caution. The returns on many assets really frequently exhibit a non-normal distribution. For instance, certain distributions have a kurtosis that differs from a normal distribution or is skewed.
Limitations of Bell Curve
Despite being a highly helpful statistical concept, the bell curve's uses in finance can be restricted since financial events, such as predicted stock Market returns, do not fit rightly inside a normal distribution. As a result, when generating forecasts regarding these occurrences, leaning too heavily on a bell curve might provide incorrect findings. Even though the majority of analysts are fully aware of this drawback, it might be challenging to find a solution since it is frequently ambiguous which statistical distribution to apply in its place.
Conclusion
A bell curve is an overall phrase for a graphical representation of a normal probability distribution. Financial analysts and investors use it to represent a normal probability distribution when examining the returns on an investment or the sensitivity of the market. All forms of securities are priced using bell curves, but the pricing of options requires it. Options traders use standard deviations to illustrate the price performance of an asset. Calls and puts are then priced using these calculations on a time continuum.
All efforts have been made to ensure the information provided here is accurate. However, no guarantees are made regarding correctness of data. Please verify with scheme information document before making any investment.


AMFI Registration No. 112358 | CIN: U74999MH2016PTC282153
Shepard Technologies Pvt. Ltd. (with ARN code 112358) makes no warranties or representations, express or implied, on products offered through the platform. It accepts no liability for any damages or losses, however caused, in connection with the use of, or on the reliance of its product or related services. Terms and conditions of the website are applicable.
©2026 Shepard Technologies Private Limited. All Rights Reserved