Fisher Transform Indicator
The Fisher Transform Indicator was invented by John F. Ehlers, and it is a technical indicator that transforms prices into a Gaussian normal distribution. It is an oscillator that assists traders in identifying big trend reversals. It detects trend reversals by allowing users to normalise prices over a predetermined number of periods.
This indicator aids in the visualisation of the signals on the chart due to the presence of clear and abrupt turning points that indicate the highest rate of change. Its operation is predicated on the notion that market prices do not appear to have a Gaussian probability density function.
Fisher Transform Indicator Formula
The mathematical formula for calculation of Fisher Transform is:
Fisher Transform = ½ * ln [(1 + T) / (1 – T)]
Where,
- ln = The shorthand form of the natural logarithm,
- X = The transformation of price to a level between -1 and 1 for ease of calculation.
Talk to our investment specialist
Fisher Transform Indicator Tradingview
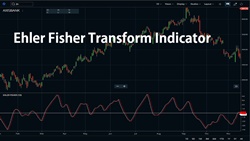
The Fisher Transform indicator generates a sine wave from prices. The goal of creating waves is to spot market extremes. Prices typically begin to revert to a more regular condition at these extremes. The closing, opening, high, low, and average prices may influence the wave formation. A fundamental signal is produced when the Fisher Transform Line (FTL) crosses the signal line. When it reaches extremes, it produces more advanced signals. The indicator also hits extremes after hitting extremes in comparison to recent market movement. As a result, traders anticipate a return to mean prices following the extremes.
Fisher Transform Example
Prices are transformed into a normal distribution using the Fisher Transform indicator. This normal distribution can be used for Technical Analysis by traders. When the Fisher Transform is above 0 and rising, the market is overbought. It is an oversold market when the Fisher Transform indicator is below 0 and falling. Both of these indicators point to a forthcoming trend reversal. When the Fisher Transform indicator approaches the extremes after a strong price gain, it suggests that the price will fall or has already begun to fall.
Legit Signals of Fisher Transform
Traders consider it a signal to sell a long position when the Fisher Transform Line falls below the Zero Line after hitting the extreme point. However, the Fisher Transform indicator's signal isn't necessarily a legitimate signal. It, like the rest of the indicators, may provide some false indications. As a result, technical analysts and specialists recommend combining the Fisher Transform indicator with other technical indicators.
Pros and Cons
Technical analysis tools are important tools that help traders forecast whether currencies, cryptocurrencies, stocks, and other assets will rise or fall in value. To avoid any tragedy, it's also critical to understand the pros and cons of this tool.
Pros
- Easily identifiable signals
- Expansive transfer response
- Identification of a trend
- Produces sharper and timely price reversal signals
- No time lag
- It makes turning points in prices more clear
Cons
- Quite confusing
- Short-lived price movements can hamper timely signals
- It may prove noisy sometimes
- Not always provide reliable signals
- Diverse financial data making tails of the curve fatte
The Bottom Line
The Fisher transform indicator is a user-friendly oscillator. By transforming price into a Gaussian normal distribution density function, it emphasises the market's potential for a price reversal. It clarifies price turning moments. The indicator's advantages are emphasised by the clarity of its indications. There is, however, always a negative aspect to everything. When financial data is subjected to a normal distribution, certain misleading signals may come up. To get the most out of the Fisher Transform, technical analysts and experts recommend utilising it in conjunction with other technical analysis tools and methodologies. Furthermore, before incorporating an indication, it is usually prudent to research and monitor it.
All efforts have been made to ensure the information provided here is accurate. However, no guarantees are made regarding correctness of data. Please verify with scheme information document before making any investment.


AMFI Registration No. 112358 | CIN: U74999MH2016PTC282153
Shepard Technologies Pvt. Ltd. (with ARN code 112358) makes no warranties or representations, express or implied, on products offered through the platform. It accepts no liability for any damages or losses, however caused, in connection with the use of, or on the reliance of its product or related services. Terms and conditions of the website are applicable.
©2026 Shepard Technologies Private Limited. All Rights Reserved