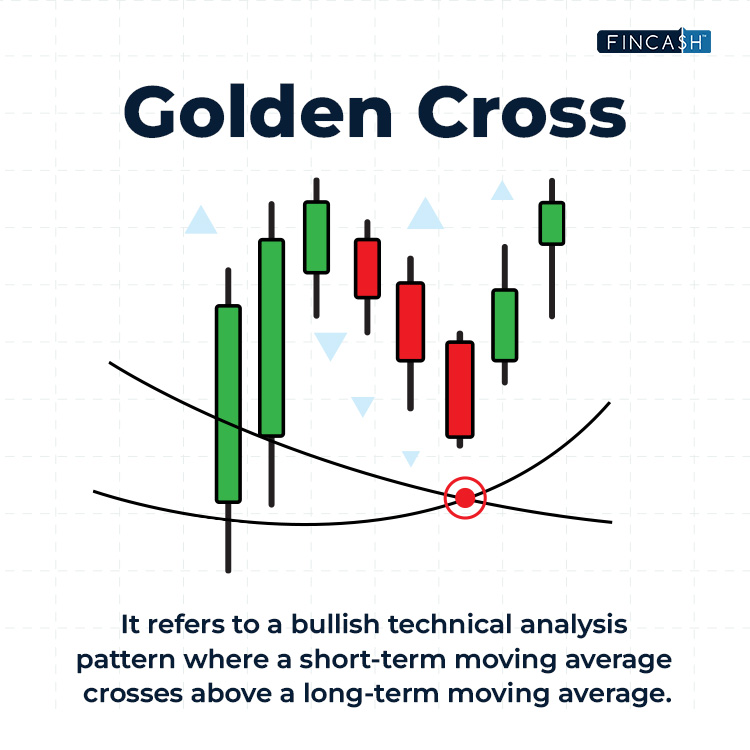
Golden Cross
A Golden Cross is a bullish chart pattern that crosses a faster, short-term Moving Average above a slower, longer-term moving average. The specific duration of the moving averages can vary among traders, but the commonly used configuration involves a 50-day moving average (faster MA) and a 200-day moving average (slower MA).
Golden Cross Trading Concept
Golden Cross Trading is centred around identifying and capitalising on upward movements in stock prices. It contrasts the adverse Market movements signalled by a death cross. In stock trading, the 50-day and 100-day moving averages are commonly employed. However, the choice of moving averages for foreign currencies may vary depending on the time horizons selected by individual forex traders, which can Range from hours to days. Some traders aiming to buy security may enter the market when the security's price surpasses the 200-day moving average instead of waiting for the crossover of the 50-day moving average. This approach is preferred due to the 50-day moving average often lagging as an indicator. Consequently, the crossover may only occur once the bearish market has transitioned into a bullish phase.
For traders engaged in short selling, the Golden Cross can signal them to exit their positions, suggesting that the Bear Market has concluded. Many investors hold the Golden Cross in high regard, considering it a highly reliable chart pattern often called the "holy grail." It is regarded as one of the most definitive signals of a bull market, thereby serving as a strong buy signal.
Is Golden Cross Bullish?
While a Golden Cross pattern cannot guarantee that the technical conditions of an asset's price are definitively bullish, it can suggest several potentialities that lean toward a more bullish outlook:
- Bottoming Out of a Downtrend: The Golden Cross may indicate that a downtrend has reached a temporary or significant bottom.
- Consistent Price Rise: Prices have experienced constant upward movement with sufficient momentum to cause the faster moving average to cross above the slower moving average.
- Increasing Buying Activity: Buying activity rises steadily, leading to a gradual price lift over time.
- Positive Market Sentiment: The price rise associated with the Golden Cross may reflect an overall increase in market sentiment toward bullishness.
Talk to our investment specialist
How do Traders Use the Golden Cross?
Traders can interpret a Golden Cross event in a few different ways, depending on their strategy and overall market approach:
- Confirmation Signal: The pattern can confirm that a bullish trend reversal or the end of a downtrend might be underway. Most traders would combine the Golden Cross with other technical and fundamental indicators to validate such a reading.
- Signal to Go "Long": A Golden Cross can identify opportunities for entering a long position as part of a trader's market entry strategy. Various nuanced methods exist for implementing this strategy.
- Stop-Loss Placement: Many investors utilise the 50-day moving average as a stop-loss level. They assume a close below the 50-day MA could indicate uncertainty regarding the asset's rising trend. The same assumption can be applied to the 200-day MA, depending on the investor's investment timeframe. It's important to note that this approach may not always be reliable, and it's advisable to incorporate other technical and fundamental indicators and methods for more accurate stop-loss placement.
Differentiating the Golden Cross from the Death Cross
Golden Cross and Death Cross are technical phrases that describe the interaction between two moving averages as one intersects the other from above or below. Conversely, another indicator, the Death Cross, opposes the Golden Cross. The Death Cross occurs when a security's 50-day moving average goes below its 200-day moving average. This event typically indicates a bear market ahead. Following the cross, the long-term moving average acts as a critical support level in the case of a Golden Cross or a resistance level in the case of a Death Cross. While either cross may suggest a shift in trend, they usually confirm an existing change in the market's direction. The Death Cross signifies a negative market movement, contrasting with the Golden Cross, which signals an upward price movement.
Conclusion
The Golden Cross is a technical indicator of a possible shift toward a bullish trend. This pattern emerges when the short-term moving average, previously positioned below the longer-term moving average, reverses its direction. The Golden Cross suggests the potential emergence of an uptrend, whether from a previous downtrend or a period of sideways trading. While the Golden Cross, particularly in its early stages, may not provide a definitive forecast of bullishness, it does offer an early signal that a more bullish market environment could be on the horizon. However, it is essential to consider a combination of technical and fundamental factors to validate and strengthen this indication.
All efforts have been made to ensure the information provided here is accurate. However, no guarantees are made regarding correctness of data. Please verify with scheme information document before making any investment.


AMFI Registration No. 112358 | CIN: U74999MH2016PTC282153
Shepard Technologies Pvt. Ltd. (with ARN code 112358) makes no warranties or representations, express or implied, on products offered through the platform. It accepts no liability for any damages or losses, however caused, in connection with the use of, or on the reliance of its product or related services. Terms and conditions of the website are applicable.
©2026 Shepard Technologies Private Limited. All Rights Reserved