Ichimoku Cloud
What is the Ichimoku Cloud?
Stock traders use Ichimoku cloud definition to get a clear picture of the current support and resistance levels, Market trends, and momentum in the stock market. It acts as the technical indicator that displays the stock-related data on a chart. The main purpose of the Ichimoku cloud is to estimate future stock price movements. The concept came into effect in the 1960s, when Ichimoku Sanjin (a journalist in Japan) released the graph to the public after conducting several experiments for nearly three decades.
The concept uses the moving-average strategy to find out the future movements of the stock prices. The chart is specifically used to enable investors to make accurate buying and selling decisions. It helps give the direction of stocks to the investor. The cloud is quite simple to use and collects several data points to find out future price movements.
Overview of the Ichimoku Cloud
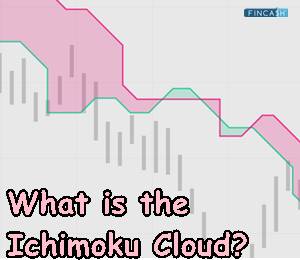
If the stock price goes above the Ichimoku cloud, then it indicates a positive trend in the market. If the price of the stock goes below the Ichimoku cloud, then it indicates a negative trend.
Now, if the price of the stock is neither above nor below the cloud, then that indicates a Flat trend. This happens when the stock prices are within the cloud. Even though it dates back to the 1960s, this Technical Analysis method is still popular. Thanks to its accurate forecasting potential. This technical indicator gathers various averages and uses them to provide the investors with accurate buy and sell signals.
It helps you know the right time for selling or buying stocks. It might seem quite complex to beginners since the chart consists of several data points that work together to produce effective and accurate signals. However, experienced traders who are familiar with the technical analysis methods and charts find it quite simple.
Talk to our investment specialist
How to Use Ichimoku Cloud?
Note that Ichimoku Cloud consists of a total of five formulas that are used to identify the momentum, direction, support and resistance levels, and the current trends. The formulas can be quite tricky, but you don’t have to do calculations manually. You can use the Ichimoku cloud indicator on the chart to get accurate predictions. This technical indicator uses multiple averages to display precise information about the price movements, buy and sell signals, market trends, and support and resistance levels of stocks.
You only need to read the graph to be able to identify the signals. In order to make it easier for traders, the indicator displays the uptrend in green color and the downtrend in red. One quality that sets the Ichimoku cloud apart from other technical indicators is that the method can be used to predict the future movements of the stock prices. Other technical analysis concepts can help you predict the current value of the stocks only. In order to get the best results, experts recommend the investors use the Ichimoku cloud with other effective technical indicators. It will help you manage the investment risk.
All efforts have been made to ensure the information provided here is accurate. However, no guarantees are made regarding correctness of data. Please verify with scheme information document before making any investment.


AMFI Registration No. 112358 | CIN: U74999MH2016PTC282153
Shepard Technologies Pvt. Ltd. (with ARN code 112358) makes no warranties or representations, express or implied, on products offered through the platform. It accepts no liability for any damages or losses, however caused, in connection with the use of, or on the reliance of its product or related services. Terms and conditions of the website are applicable.
©2026 Shepard Technologies Private Limited. All Rights Reserved