Ichimoku Kinko Hyo
What is Ichimoku Kinko Hyo?
Commonly known as Ichimoku, the Ichimoku Kinko Hyo term is one of the popular technical indicators that help investors figure out the stock price movements. The method works on Candlestick charting and is specifically used to predict price movements and trends around the stock Market.
It is important to note that Ichimoku Kinko Hyo is one of the complex indicators. What sets it apart from the standard analysis methods is the five lines that help you understand everything you need to know about the stock market. Initially, the beginners might find the chart quite complex. However, it doesn’t take long for even beginners to understand the chart and price movements by interpreting the five lines.
You only need to learn the roles of these five lines to get a clear understanding of the indicator. Even though Ichimoku Kinko Hyo is the all-inclusive indicator with all features being included in the method, you can make the best of this tool by combining it with other effective Technical Analysis indicators. The trends and price movements are highlighted by different colors, making it easier for you to understand the current trends.
History of Ichimoku Kinko Hyo
The method was introduced by Goichi Hosada, who is famous as Ichimoku Sanjin. He started to conduct research on this technical analysis in the 1930s and took approx 30 years to master the technique. This Japanese journalist launched Ichimoku Kinko Hyo in the 1960s. The chart helps experts find the latest trends around the stock market. As compared to the candlestick charting, Ichimoku Kinko Hyo is a better and effective technical analysis method.
That’s because the indicator uses a large number of data points and gathers historical data of this Industry to figure out the upcoming trends in the stock market. It gives you a better understanding of the stock market and the buy and sell signals. In this method, time is considered as a crucial Factor that has a great impact on the price movement and trends.
Talk to our investment specialist
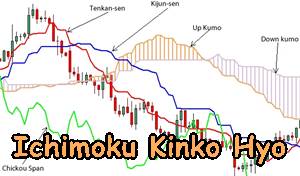
Ichimoku Kinko Hyo is quite famous in Asian countries. It has been embraced by many popular investors. However, western countries have not translated this technical analysis method in their regional languages. For example, the Ichimoku Kinko Hyo has not been translated into English, Spanish, Italian, and German languages. Many traders consider Ichimoku Kinko Hyo as the all-in-one technical analysis method. The method has five lines that include:
- Tenkan-sen
- Senkou Span A
- Senkou Span B
- Kijiun-sen
- Chikou Span
The main purpose of launching the Ichimoku Kinko Hyo was to merge different technical analysis tools into a single system. The Japanese journalist wanted to make investment super simple by launching a technical indicator that could help them ascertain the price movements, resistance and support levels, momentum, trends, and so on. Ichimoku refers to “one look”. It clearly indicates that the investors need only one glance at the chart to get a clear picture of the stock market trends, price movements, support and resistance levels, and more.
All efforts have been made to ensure the information provided here is accurate. However, no guarantees are made regarding correctness of data. Please verify with scheme information document before making any investment.

AMFI Registration No. 112358 | CIN: U74999MH2016PTC282153
Shepard Technologies Pvt. Ltd. (with ARN code 112358) makes no warranties or representations, express or implied, on products offered through the platform. It accepts no liability for any damages or losses, however caused, in connection with the use of, or on the reliance of its product or related services. Terms and conditions of the website are applicable.
©2026 Shepard Technologies Private Limited. All Rights Reserved