T Distribution
T distribution formula holds an important aspect in probability distribution. As per its definition, it also goes by the name as Student’s T Distribution. It is a type of probability distribution that remains quite the same as normal distribution and features a bell shape having heavier tails.
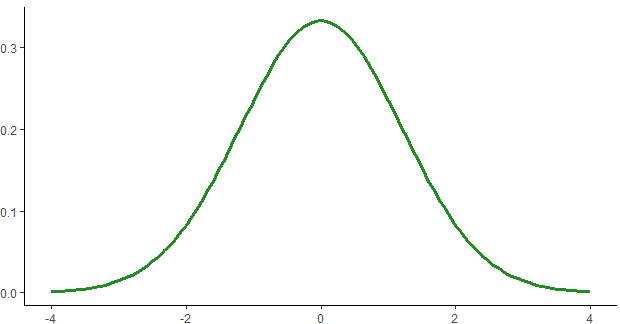
T distributions tend to feature an increased chance of representing extreme values in comparison to normal distributions. Therefore, this results in heavier tails.
What is the Meaning of T Distribution?
The overall heaviness of the term gets determined by Degrees of Freedom –a major parameter defining T Distribution having smaller values and heavier tails. The higher values are known to make T Distribution quite similar to normal distribution featuring the mean of 0. Moreover, there is the Standard Deviation of 1.
When you take up a sample of ‘n’ distributions from a population that has been normally distributed with D standard deviation and M mean, the sample mean ‘m’ and the sample standard deviation ‘d’ tend to differ from the values of M & D. This is because of the overall randomness of the given sample.
T Distribution Formula
You can calculate the z-core with the population-based standard deviation with the formula:
Z = (x-M)/D
The given value tends to feature normal distribution having 0 mean and 1 as the value for standard deviation. However, when you make use of estimated standard deviation, then you have to calculate the T-score using the formula:
T = (m-M)/{d/sqrt(n)}
The difference of the value of (d-D) will make the given distribution as T Distribution having (n-1) in the form of degree of freedom instead of normal distribution having 1 as the standard deviation and 0 as the mean value.
Talk to our investment specialist
Difference Between T Distribution & Normal Distribution
The concept of normal distribution is utilized when the overall population distribution is normal. The concept appears to be quite similar to normal distribution. The only difference is with respect to the tail as T Distribution depicts fatter or heavier tails. Both these distribution concepts are known to assume the population that is normally distributed. Still, T Distribution depicts higher kurtosis in comparison to normal distribution.
The overall probability of obtaining values further from the mean tends to be larger in case of T Distribution than with normal distribution.
Limitations of Utilizing T Distribution
The concept of T Distribution is capable of skewing exactness with respect to the normal distribution. The only drawback is known to arise when there is a requirement for achieving perfect normality. However, the overall difference between making use of T Distribution and normal distribution turns out to be quite minimal.
All efforts have been made to ensure the information provided here is accurate. However, no guarantees are made regarding correctness of data. Please verify with scheme information document before making any investment.
")


AMFI Registration No. 112358 | CIN: U74999MH2016PTC282153
Shepard Technologies Pvt. Ltd. (with ARN code 112358) makes no warranties or representations, express or implied, on products offered through the platform. It accepts no liability for any damages or losses, however caused, in connection with the use of, or on the reliance of its product or related services. Terms and conditions of the website are applicable.
©2026 Shepard Technologies Private Limited. All Rights Reserved