What is Fibonacci Retracement?
Traders and investors employ various tools and techniques to analyse price movements and make informed results. One such powerful tool is Fibonacci retracement, a widely used Technical Analysis tool that is based on the Fibonacci sequence and provides insights into potential price reversal levels. This sequence, discovered by the Italian mathematician Leonardo Fibonacci, dates back to ancient times. It is a series of numbers where each number is the sum of the two previous ones: 0, 1, 1, 2, 3, 5, 8, 13, 21, and so on. The ratio between these numbers, known as the golden ratio (approximately 1.618), has remarkable applications in various natural phenomena, art, and financial markets.
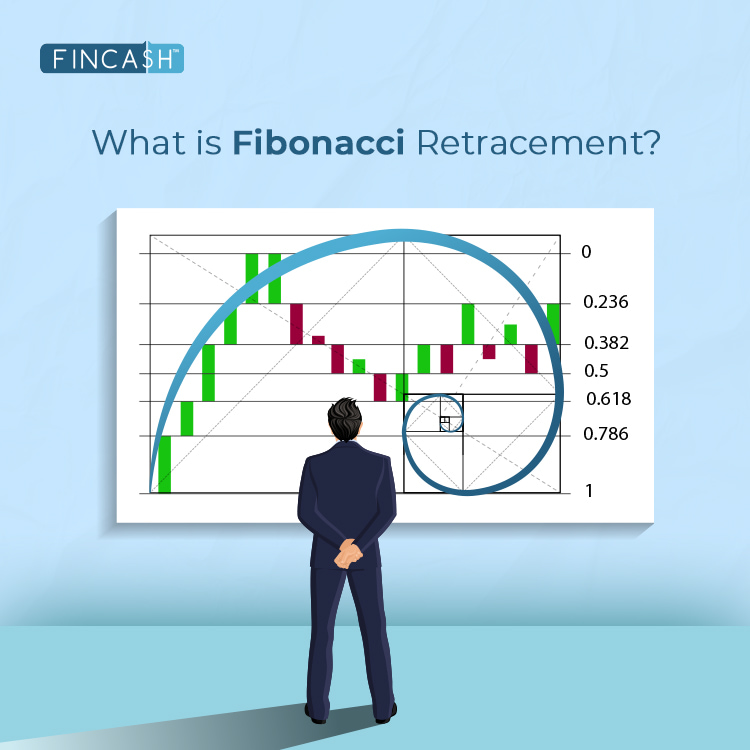
In financial markets, Fibonacci retracement is used to identify potential support and resistance levels. The critical levels generated by this tool are 23.6%, 38.2%, 50%, 61.8%, and 100%. These levels indicate the potential retracement of a Financial Instrument's price before it resumes its original trend.
How Does Fibonacci Retracement Work?
To apply Fibonacci retracement, a trader identifies a significant price move called the "swing high" and "swing low." The tool is then applied to this price movement. The retracement levels act as potential areas where the price might reverse or consolidate before continuing in the direction of the original trend.
23.6% Retracement Level: Considered the shallowest retracement level, prices often find support or resistance at this level during a trend
38.2% Retracement Level: This level represents a deeper retracement, and it is not uncommon for prices to bounce off or consolidate around this level before continuing the trend
50% Retracement Level: While not a Fibonacci number, the 50% level is included in Fibonacci retracement. Prices often exhibit significant retracement or consolidation at this level
61.8% Retracement Level: The "golden ratio" is a strong indicator of potential support or resistance
100% Retracement Level: Sometimes, the price retraces the entire initial move, indicating a potential trend reversal.
Check Here!
Importance of Fibonacci Retracements
Within technical analysis, Fibonacci retracement levels are crucial in identifying pivotal zones where a stock might experience a reversal or pause in its movement. Standard ratios, such as 23.6%, 38.2%, and 50%, are often employed. These retracement levels are typically drawn between a security's high and low points, aiding in forecasting its potential future price direction.
What do the Fibonacci Ratios Represent?
The Fibonacci ratios are based on the Fibonacci sequence: 0, 1, 1, 2, 3, 5, 8, 13, 21, 34, 55, 89, 144, 233, and so forth, where each number is the sum of the two preceding ones. These ratios, including 23.6%, 38.2%, 50%, 61.8%, 78.6%, 100%, 161.8%, 261.8%, and 423.6%, are derived from mathematical relationships inherent in the Fibonacci formula. While 50% is not strictly a Fibonacci ratio, it is commonly used to indicate support and resistance levels.
Fibonacci Retracement in Action
Let's explore a hypothetical scenario in the context of the stock Market. Assume that a particular stock, after a significant uptrend, experiences a pullback. A trader identifies this price movement's high and low swing and applies Fibonacci retracement. If the retracement levels align with other technical indicators or support/resistance zones, it can strengthen the trader's confidence in the potential reversal or continuation of the trend.
When Were the Numbers First Formulated?
Well before Leonardo Fibonacci introduced it to Western Europe, Indian mathematicians had developed and employed it. Specifically, the Indian mathematician Acarya Virahanka is credited with formulating the Fibonacci numbers and establishing their sequencing method around 600 A.D. Following Virahanka's pioneering work, subsequent generations of Indian mathematicians, including Gopala, Hemacandra, and Narayana Pandita, acknowledged and expanded upon the numbers and their methodology. Pandita, in particular, elevated its application by establishing a connection between the Fibonacci numbers and multinomial coefficients. Historical evidence suggests that Fibonacci numbers were present in Indian society as far back as 200 B.C.
How to Create a Fibonacci Retracement?
To construct a Fibonacci retracement, draw trend lines connecting two notable points, typically from absolute lows to absolute highs, marked on a chart. Horizontal lines intersecting at Fibonacci levels are then positioned accordingly.
How can Fibonacci retracement Levels be Utilised on a Chart?
A prevalent technical trading approach involves using Fibonacci retracement levels to identify potential entry points for a trade. For example, a trader observes a stock that has experienced a substantial decline of 38.2% after significant momentum. Recognising the stock's initiation of an upward trend, the trader opts to enter the trade. The decision to buy is influenced by the stock reaching a Fibonacci level, suggesting a favourable moment to speculate on the stock's anticipated retracement or recovery from recent losses.
Relevance in Markets
Fibonacci retracement is not confined to any specific market and is widely applicable in the financial landscape. Whether analysing stocks, commodities, or currency pairs, traders leverage Fibonacci retracement to enhance their technical analysis. Indian traders often use Fibonacci retracement with other technical tools and indicators to validate trading decisions. Given the Volatility of Indian markets, having additional confirmation from different sources can be crucial for risk management.
Fibonacci Extensions: Taking it Further
Beyond retracement levels, Fibonacci Extensions are another tool that traders use to classify potential future price levels. Extensions are applied to the same initial price move, projecting levels beyond 100%. Common extension levels include 161.8%, 261.8%, and 423.6%. These levels indicate where the price might head after completing a retracement.
Potential Pitfalls and Considerations
While Fibonacci retracement is a valuable tool, it is not foolproof, and traders should exercise caution. Here are some considerations:
Subjectivity: Identifying the most relevant swing high and swing low can be subjective, leading to different interpretations.
Not a Standalone Indicator: Using Fibonacci retracement with other technical analysis tools for all-inclusive decision-making is crucial.
Market Conditions: Like any tool, Fibonacci retracement's effectiveness can vary based on market conditions. It is advisable to contemplate the broader market context.
Conclusion
Fibonacci retracement is a versatile and widely used tool in the toolkit of technical analysts in the financial markets. By providing potential support and resistance levels, it aids traders in making more informed decisions. However, using Fibonacci retracement with other tools and considering market conditions for a holistic approach to technical analysis in the ever-evolving financial landscape is essential.
All efforts have been made to ensure the information provided here is accurate. However, no guarantees are made regarding correctness of data. Please verify with scheme information document before making any investment.


AMFI Registration No. 112358 | CIN: U74999MH2016PTC282153
Shepard Technologies Pvt. Ltd. (with ARN code 112358) makes no warranties or representations, express or implied, on products offered through the platform. It accepts no liability for any damages or losses, however caused, in connection with the use of, or on the reliance of its product or related services. Terms and conditions of the website are applicable.
©2026 Shepard Technologies Private Limited. All Rights Reserved