 +91-22-48913909
Table of Contents
- কেন ভারতে সূচক তহবিলে বিনিয়োগ করবেন?
- সূচক মিউচুয়াল ফান্ডের ধরন
- শীর্ষ 9টি সেরা পারফর্মিং ইনডেক্স ফান্ড FY 22 - 23৷
- প্যাসিভ ইনডেক্স ফান্ড ভালো কেন?
- প্যাসিভ ফান্ড - করোনাভাইরাস মহামারীর মধ্যে নিরাপদ স্বর্গ
- প্যাসিভ ফান্ড বনাম অ্যাক্টিভ ফান্ড
- ইনডেক্স ফান্ডে বিনিয়োগের ঝুঁকি
- কিভাবে ইনডেক্স মিউচুয়াল ফান্ড অনলাইনে বিনিয়োগ করবেন?
- FAQs
- 1. কেন আপনার সূচক মিউচুয়াল ফান্ডে বিনিয়োগ করা উচিত?
- 2. কিভাবে একটি নির্দিষ্ট সূচক MF নির্বাচন করবেন?
- 3. একটি সূচক তহবিলে বিনিয়োগের প্রধান সুবিধা কী?
- 4. SBI নিফটি ইনডেক্স ফান্ড থেকে কতটা আশা করা যায়?
- 5. আপনি যদি ICICI প্রুডেনশিয়াল নিফটি ইনডেক্স ফান্ডে বিনিয়োগ করেন তাহলে আপনি কী আশা করতে পারেন?
- 6. কিভাবে সূচক তহবিল বৈচিত্র্য যোগ করে?
- 7. কখন আপনার ইনডেক্স ফান্ডে বিনিয়োগ করার কথা বিবেচনা করা উচিত?
- 8. কোন উপায় আছে যে আমি সেরা সূচক তহবিল নির্বাচন করতে পারি?
- 9. সূচক তহবিলে বিনিয়োগের জন্য আদর্শভাবে কে উপযুক্ত?
Top 9 Others - Index Fund Funds
বিনিয়োগের জন্য সেরা সূচক মিউচুয়াল ফান্ড 2022
সূচক তহবিল মিউচুয়াল ফান্ড স্কিমগুলি পড়ুন যার পোর্টফোলিও একটি ব্যবহার করে তৈরি করা হয়বাজার একটি ভিত্তি হিসাবে সূচক। অন্য কথায়, একটি সূচক তহবিলের কর্মক্ষমতা একটি নির্দিষ্ট সূচকের কর্মক্ষমতার উপর নির্ভর করে। এই স্কিমগুলি নিষ্ক্রিয়ভাবে পরিচালিত হয়। এই তহবিলগুলি একটি নির্দিষ্ট সূচকে অনুরূপ অনুপাতে শেয়ার ধারণ করে।
ভারতে, অনেক স্কিম তাদের পোর্টফোলিও তৈরি করতে নিফটি বা সেনসেক্সকে ভিত্তি হিসাবে ব্যবহার করে। উদাহরণস্বরূপ, যদি নিফটি পোর্টফোলিওতে এসবিআই শেয়ার থাকে যার অনুপাত 12% হয়; নিফটি সূচক তহবিলে 12% ইক্যুইটি শেয়ারও থাকবে।
তারা নিষ্ক্রিয়ভাবে একটি নির্দিষ্ট সূচকের কর্মক্ষমতা ট্র্যাক করে। সক্রিয়ভাবে পরিচালিত তহবিলের বিপরীতে, সূচক তহবিলগুলি বাজারকে ছাড়িয়ে যাওয়ার জন্য নয়, তবে সূচকের কর্মক্ষমতা অনুকরণ করে। যখন একটিবিনিয়োগকারী সূচক তহবিলে বিনিয়োগ করার পরিকল্পনা করছে, তাদের তহবিলের ট্র্যাকিং ত্রুটির দিকে মনোযোগ দেওয়া উচিত। ট্র্যাকিং ত্রুটি এটি ট্র্যাক করা বেঞ্চমার্ক থেকে ফান্ড রিটার্নের বিচ্যুতি পরিমাপ করে। এটি ইনডেক্স ফান্ড রিটার্ন এবং এর বেঞ্চমার্ক রিটার্নের মধ্যে পার্থক্য। ট্র্যাকিং এরর যত কম হবে তহবিলের কর্মক্ষমতা তত ভালো।
কেন ভারতে সূচক তহবিলে বিনিয়োগ করবেন?
কিছুবিনিয়োগের সুবিধা সূচক তহবিলে হল:
1. বৈচিত্র্য
একটি সূচক হল বিভিন্ন স্টক এবং সিকিউরিটিজের একটি সংগ্রহ। তারা বিনিয়োগকারীকে বৈচিত্র্য প্রদান করে যার মূল উদ্দেশ্যসম্পদ বরাদ্দ. এটি নিশ্চিত করে যে বিনিয়োগকারীর একটি ঝুড়িতে তার সমস্ত ডিম নেই।
2. কম খরচ
অন্যান্য মিউচুয়াল ফান্ড স্কিমের তুলনায় ইনডেক্স ফান্ডের অপারেটিং খরচ কম। এখানে, তহবিল ব্যবস্থাপকদের গবেষণা বিশ্লেষকদের একটি পৃথক দলের প্রয়োজন নেই কোম্পানিগুলির একটি গভীর গবেষণা চালানোর জন্য, যার বিরুদ্ধে একটি উল্লেখযোগ্য পরিমাণ ব্যয় করা হয়। ইনডেক্স ফান্ডে, ম্যানেজারকে শুধু সূচকের প্রতিলিপি করতে হবে। তাই, সূচক তহবিলের ক্ষেত্রে ব্যয়ের অনুপাত কম।
3. কম ব্যবস্থাপনাগত প্রভাব
যেহেতু তহবিলটি কেবল নির্দিষ্ট সূচকের গতিবিধি অনুসরণ করে, তাই কোন স্টকে বিনিয়োগ করতে হবে তা পরিচালককে বেছে নিতে হবে না। এটি একটি প্লাস পয়েন্ট যেহেতু ম্যানেজারের নিজস্ব শৈলীবিনিয়োগ (যা মাঝে মাঝে বাজারের সাথে সিঙ্ক নাও হতে পারে) হামাগুড়ি দেয় না।
সূচক মিউচুয়াল ফান্ডের ধরন
সেনসেক্স বা নিফটিতে একটি কোম্পানির ওজন তার বিনামূল্যের উপর নির্ভর করেভাসা বাজার মূলধন. এটি সূচকের মোট বাজার মূলধনের একটি শতাংশ। সুতরাং, যদি একটি কোম্পানির বাজার মূলধন Rs১ কোটি টাকা, যেখানে সূচকের 200 কোটি টাকা হলে, এর স্টকের ওজন 0.5%।
1. সেনসেক্স সূচক তহবিল
এই সূচক তহবিলগুলি বিএসই সেনসেক্সকে বেচমার্ক সূচক হিসাবে ট্র্যাক করে এবং উপরে আলোচিত ওয়েটেজ লগইনের ভিত্তিতে বিএসই সেনসেক্সে 30টি কোম্পানিতে বিনিয়োগ করে। এইগুলোমিউচুয়াল ফান্ডের প্রকারভেদ ETF এর দ্বারা সমর্থিত (বিনিময় ব্যবসা তহবিল) বিনিময়ে লেনদেন হয়।
2. নিফটি ইনডেক্স ফান্ড
এই সূচক তহবিলগুলি NSE NIFTY 50 কে বেচমার্ক সূচক হিসাবে ট্র্যাক করে এবং উপরে আলোচিত হিসাবে ওয়েটেজ লগইনের ভিত্তিতে নিফটি 50-এ 50টি কোম্পানিতে বিনিয়োগ করে। এই ধরনেরযৌথ পুঁজি এক্সচেঞ্জে ট্রেড করা ইটিএফ (এক্সচেঞ্জ ট্রেডেড ফান্ড) দ্বারা সমর্থিত।
Talk to our investment specialist
3. নিফটি জুনিয়র ইনডেক্স ফান্ড
এই সূচক তহবিলগুলি NSE NIFTY Junior 50 কে বেচমার্ক সূচক হিসাবে ট্র্যাক করে এবং উপরে আলোচিত ওয়েটেজ লগইনের উপর ভিত্তি করে NSE NIFTY Junior 50-এ 50টি কোম্পানিতে বিনিয়োগ করে। এই ধরনের মিউচুয়াল ফান্ডগুলি এক্সচেঞ্জে ট্রেড করা ETF-এর (এক্সচেঞ্জ ট্রেডেড ফান্ড) দ্বারা সমর্থিত।
শীর্ষ 9টি সেরা পারফর্মিং ইনডেক্স ফান্ড FY 22 - 23৷
Fund NAV Net Assets (Cr) 3 MO (%) 6 MO (%) 1 YR (%) 3 YR (%) 5 YR (%) 2023 (%) Nippon India Index Fund - Sensex Plan Growth ₹40.4806
↓ -0.14 ₹712 9.6 14.9 21.4 15.6 16.8 19.5 LIC MF Index Fund Sensex Growth ₹149.855
↓ -0.53 ₹83 8.9 13.1 20.9 15 16.4 19 ICICI Prudential Nifty Index Fund Growth ₹243.443
↓ -0.65 ₹9,800 10 15.9 24.9 16.4 17.4 20.7 Franklin India Index Fund Nifty Plan Growth ₹195.294
↓ -0.53 ₹704 9.4 14.2 24.8 15.9 16.9 20.2 SBI Nifty Index Fund Growth ₹214.021
↓ -0.58 ₹7,941 9.5 14.3 24.9 16.2 17.2 20.7 IDBI Nifty Index Fund Growth ₹36.2111
↓ -0.02 ₹208 9.1 11.9 16.2 20.3 11.7 Nippon India Index Fund - Nifty Plan Growth ₹41.0789
↓ -0.11 ₹1,796 9.9 15.7 24.6 15.9 16.8 20.5 ICICI Prudential Nifty Next 50 Index Fund Growth ₹63.1804
↑ 0.19 ₹5,845 14.1 34.5 62 22.2 21.8 26.3 IDBI Nifty Junior Index Fund Growth ₹53.2891
↑ 0.16 ₹90 13.4 32.2 61.7 22.1 22 25.7 Note: Returns up to 1 year are on absolute basis & more than 1 year are on CAGR basis. as on 24 Jul 24
*নিচে অন্তত থাকা সূচক মিউচুয়াল ফান্ডের তালিকা রয়েছে15 কোটি নেট সম্পদে বা আরও বেশি।
The primary investment objective of the scheme is to replicate the composition of the Sensex, with a view to generate returns that are commensurate with the performance of the Sensex, subject to tracking errors. Nippon India Index Fund - Sensex Plan is a Others - Index Fund fund was launched on 28 Sep 10. It is a fund with Moderately High risk and has given a Below is the key information for Nippon India Index Fund - Sensex Plan Returns up to 1 year are on The main investment objective of the fund is to generate returns commensurate with the performance of the index either Nifty / Sensex based on the plans by investing in the respective index stocks subject to tracking errors. LIC MF Index Fund Sensex is a Others - Index Fund fund was launched on 14 Nov 02. It is a fund with Moderately High risk and has given a Below is the key information for LIC MF Index Fund Sensex Returns up to 1 year are on (Erstwhile ICICI Prudential Nifty Index Fund) An open-ended index linked growth scheme seeking to track the returns of the S&P CNX Nifty index through investment in a basket of stocks drawn from the constituents of the Nifty. ICICI Prudential Nifty Index Fund is a Others - Index Fund fund was launched on 26 Feb 02. It is a fund with Moderately High risk and has given a Below is the key information for ICICI Prudential Nifty Index Fund Returns up to 1 year are on The Investment Objective of the Scheme is to invest in companies whose securities are included in the Nifty and subject to tracking errors, endeavouring to attain results commensurate with the Nifty 50 under NSENifty Plan Franklin India Index Fund Nifty Plan is a Others - Index Fund fund was launched on 4 Aug 00. It is a fund with Moderately High risk and has given a Below is the key information for Franklin India Index Fund Nifty Plan Returns up to 1 year are on The scheme will adopt a passive investment strategy. The scheme will
invest in stocks comprising the Nifty 50 Index in the same proportion as in the
index with the objective of achieving returns equivalent to the Total Returns
Index of Nifty 50 Index by minimizing the performance difference between the
benchmark index and the scheme. The Total Returns Index is an index that
reflects the returns on the index from index gain/loss plus dividend payments
by the constituent stocks. SBI Nifty Index Fund is a Others - Index Fund fund was launched on 17 Jan 02. It is a fund with Moderately High risk and has given a Below is the key information for SBI Nifty Index Fund Returns up to 1 year are on The investment objective of the scheme is to invest in the stocks and equity related instruments comprising the S&P CNX Nifty Index in the same weights as these stocks represented in the Index with the intent to replicate the performance of the Total Returns Index of S&P CNX Nifty index. The scheme will adopt a passive investment strategy and will seek to achieve the investment objective by minimizing the tracking error between the S&P CNX Nifty index (Total Returns Index) and the scheme. IDBI Nifty Index Fund is a Others - Index Fund fund was launched on 25 Jun 10. It is a fund with Moderately High risk and has given a Below is the key information for IDBI Nifty Index Fund Returns up to 1 year are on The primary investment objective of the scheme is to replicate the composition of the Nifty 50, with a view to generate returns that are commensurate with the
performance of the Nifty 50, subject to tracking errors. Nippon India Index Fund - Nifty Plan is a Others - Index Fund fund was launched on 28 Sep 10. It is a fund with Moderately High risk and has given a Below is the key information for Nippon India Index Fund - Nifty Plan Returns up to 1 year are on The fund's objective is to invest in companies whose securities are included in Nifty Junior Index and to endeavor to achieve the returns of the above index as closely as possible, though subject to tracking error. The fund intends to track only 90-95% of the Index i.e. it will always keep cash balance between 5-10% of the Net Asset to meet the redemption and other liquidity requirements. However, as and when the liquidity in the Index improves the fund intends to track up to 100% of the Index. The fund will not seek to outperform the CNX Nifty Junior. The objective is that the performance of the NAV of the fund should closely track the performance of the CNX Nifty Junior over the same period subject to tracking error. ICICI Prudential Nifty Next 50 Index Fund is a Others - Index Fund fund was launched on 25 Jun 10. It is a fund with Moderately High risk and has given a Below is the key information for ICICI Prudential Nifty Next 50 Index Fund Returns up to 1 year are on The investment objective of the scheme is to invest in the stocks and equity related instruments comprising the CNX Nifty Junior Index in the same weights as these stocks represented in the Index with the intent to replicate the performance of the Total Returns Index of CNX Nifty Junior Index. The scheme will adopt a passive investment strategy and will seek to achieve the investment objective by minimizing the tracking error between the CNX Nifty Junior Index (Total Returns Index) and the scheme. IDBI Nifty Junior Index Fund is a Others - Index Fund fund was launched on 20 Sep 10. It is a fund with Moderately High risk and has given a Below is the key information for IDBI Nifty Junior Index Fund Returns up to 1 year are on 1. Nippon India Index Fund - Sensex Plan
CAGR/Annualized return of 10.7% since its launch. Ranked 74 in Index Fund category. Return for 2023 was 19.5% , 2022 was 5% and 2021 was 22.4% . Nippon India Index Fund - Sensex Plan
Growth Launch Date 28 Sep 10 NAV (24 Jul 24) ₹40.4806 ↓ -0.14 (-0.35 %) Net Assets (Cr) ₹712 on 30 Jun 24 Category Others - Index Fund AMC Nippon Life Asset Management Ltd. Rating ☆☆ Risk Moderately High Expense Ratio 0.74 Sharpe Ratio 1.25 Information Ratio -8.2 Alpha Ratio -0.56 Min Investment 5,000 Min SIP Investment 100 Exit Load 0-7 Days (0.25%),7 Days and above(NIL) Growth of 10,000 investment over the years.
Date Value 30 Jun 19 ₹10,000 30 Jun 20 ₹8,892 30 Jun 21 ₹13,436 30 Jun 22 ₹13,666 30 Jun 23 ₹16,746 30 Jun 24 ₹20,593 Returns for Nippon India Index Fund - Sensex Plan
absolute basis & more than 1 year are on CAGR (Compound Annual Growth Rate) basis. as on 24 Jul 24 Duration Returns 1 Month 4.2% 3 Month 9.6% 6 Month 14.9% 1 Year 21.4% 3 Year 15.6% 5 Year 16.8% 10 Year 15 Year Since launch 10.7% Historical performance (Yearly) on absolute basis
Year Returns 2023 19.5% 2022 5% 2021 22.4% 2020 16.6% 2019 14.2% 2018 6.2% 2017 27.9% 2016 2% 2015 -4.7% 2014 28.7% Fund Manager information for Nippon India Index Fund - Sensex Plan
Name Since Tenure Himanshu Mange 23 Dec 23 0.52 Yr. Data below for Nippon India Index Fund - Sensex Plan as on 30 Jun 24
Asset Allocation
Asset Class Value Cash 0.4% Equity 99.6% Top Securities Holdings / Portfolio
Name Holding Value Quantity HDFC Bank Ltd (Financial Services)
Equity, Since 31 Oct 10 | 50018014% ₹99 Cr 590,728
↑ 1,207 Reliance Industries Ltd (Energy)
Equity, Since 31 Oct 10 | 50032512% ₹83 Cr 265,486
↓ -2,321 ICICI Bank Ltd (Financial Services)
Equity, Since 31 Oct 10 | 5321749% ₹66 Cr 551,652
↑ 7,000 Infosys Ltd (Technology)
Equity, Since 31 Oct 10 | 5002096% ₹44 Cr 283,456
↑ 6,421 Larsen & Toubro Ltd (Industrials)
Equity, Since 29 Feb 12 | 5005105% ₹33 Cr 91,707
↓ -47 Tata Consultancy Services Ltd (Technology)
Equity, Since 31 Oct 10 | 5325404% ₹31 Cr 79,505
↓ -13 ITC Ltd (Consumer Defensive)
Equity, Since 29 Feb 12 | ITC4% ₹31 Cr 725,053
↓ -1,362 Bharti Airtel Ltd (Communication Services)
Equity, Since 31 Oct 10 | 5324544% ₹30 Cr 209,275
↑ 12,682 Axis Bank Ltd (Financial Services)
Equity, Since 31 Dec 13 | 5322154% ₹28 Cr 220,547
↑ 272 State Bank of India (Financial Services)
Equity, Since 31 Oct 10 | 5001124% ₹26 Cr 301,174
↑ 3,324 2. LIC MF Index Fund Sensex
CAGR/Annualized return of 13.8% since its launch. Ranked 79 in Index Fund category. Return for 2023 was 19% , 2022 was 4.6% and 2021 was 21.9% . LIC MF Index Fund Sensex
Growth Launch Date 14 Nov 02 NAV (24 Jul 24) ₹149.855 ↓ -0.53 (-0.35 %) Net Assets (Cr) ₹83 on 30 Jun 24 Category Others - Index Fund AMC LIC Mutual Fund Asset Mgmt Co Ltd Rating ☆ Risk Moderately High Expense Ratio 0.99 Sharpe Ratio 1.2 Information Ratio 0 Alpha Ratio 0 Min Investment 5,000 Min SIP Investment 1,000 Exit Load 0-1 Months (1%),1 Months and above(NIL) Growth of 10,000 investment over the years.
Date Value 30 Jun 19 ₹10,000 30 Jun 20 ₹8,900 30 Jun 21 ₹13,372 30 Jun 22 ₹13,528 30 Jun 23 ₹16,561 30 Jun 24 ₹20,260 Returns for LIC MF Index Fund Sensex
absolute basis & more than 1 year are on CAGR (Compound Annual Growth Rate) basis. as on 24 Jul 24 Duration Returns 1 Month 3.6% 3 Month 8.9% 6 Month 13.1% 1 Year 20.9% 3 Year 15% 5 Year 16.4% 10 Year 15 Year Since launch 13.8% Historical performance (Yearly) on absolute basis
Year Returns 2023 19% 2022 4.6% 2021 21.9% 2020 15.9% 2019 14.6% 2018 5.6% 2017 27.4% 2016 1.6% 2015 -5.4% 2014 29.3% Fund Manager information for LIC MF Index Fund Sensex
Name Since Tenure Sumit Bhatnagar 3 Oct 23 0.75 Yr. Data below for LIC MF Index Fund Sensex as on 30 Jun 24
Asset Allocation
Asset Class Value Cash 0.67% Equity 99.33% Top Securities Holdings / Portfolio
Name Holding Value Quantity HDFC Bank Ltd (Financial Services)
Equity, Since 31 Mar 09 | 50018014% ₹12 Cr 69,016
↓ -760 Reliance Industries Ltd (Energy)
Equity, Since 31 Mar 09 | 50032512% ₹10 Cr 31,095
↓ -613 ICICI Bank Ltd (Financial Services)
Equity, Since 30 Apr 09 | 5321749% ₹8 Cr 64,429
↓ -129 Infosys Ltd (Technology)
Equity, Since 31 Mar 09 | 5002096% ₹5 Cr 33,110
↑ 393 Larsen & Toubro Ltd (Industrials)
Equity, Since 31 Mar 09 | 5005105% ₹4 Cr 10,717
↓ -121 Tata Consultancy Services Ltd (Technology)
Equity, Since 31 Mar 09 | 5325404% ₹4 Cr 9,291
↓ -139 ITC Ltd (Consumer Defensive)
Equity, Since 30 Sep 11 | ITC4% ₹4 Cr 84,918
↓ -1,063 Bharti Airtel Ltd (Communication Services)
Equity, Since 30 Apr 09 | 5324544% ₹4 Cr 24,317
↑ 995 Axis Bank Ltd (Financial Services)
Equity, Since 31 Dec 13 | 5322154% ₹3 Cr 25,871
↓ -263 State Bank of India (Financial Services)
Equity, Since 31 Mar 09 | 5001124% ₹3 Cr 35,214
↑ 140 3. ICICI Prudential Nifty Index Fund
CAGR/Annualized return of 15.3% since its launch. Ranked 71 in Index Fund category. Return for 2023 was 20.7% , 2022 was 5.2% and 2021 was 24.9% . ICICI Prudential Nifty Index Fund
Growth Launch Date 26 Feb 02 NAV (24 Jul 24) ₹243.443 ↓ -0.65 (-0.27 %) Net Assets (Cr) ₹9,800 on 30 Jun 24 Category Others - Index Fund AMC ICICI Prudential Asset Management Company Limited Rating ☆☆ Risk Moderately High Expense Ratio 0.39 Sharpe Ratio 1.49 Information Ratio -8.58 Alpha Ratio -0.37 Min Investment 5,000 Min SIP Investment 100 Exit Load NIL Growth of 10,000 investment over the years.
Date Value 30 Jun 19 ₹10,000 30 Jun 20 ₹8,783 30 Jun 21 ₹13,480 30 Jun 22 ₹13,639 30 Jun 23 ₹16,683 30 Jun 24 ₹21,042 Returns for ICICI Prudential Nifty Index Fund
absolute basis & more than 1 year are on CAGR (Compound Annual Growth Rate) basis. as on 24 Jul 24 Duration Returns 1 Month 4.2% 3 Month 10% 6 Month 15.9% 1 Year 24.9% 3 Year 16.4% 5 Year 17.4% 10 Year 15 Year Since launch 15.3% Historical performance (Yearly) on absolute basis
Year Returns 2023 20.7% 2022 5.2% 2021 24.9% 2020 15.2% 2019 12.8% 2018 3.4% 2017 28.7% 2016 3.6% 2015 -3.6% 2014 32.5% Fund Manager information for ICICI Prudential Nifty Index Fund
Name Since Tenure Nishit Patel 18 Jan 21 3.45 Yr. Priya Sridhar 1 Feb 24 0.41 Yr. Ajaykumar Solanki 1 Feb 24 0.41 Yr. Data below for ICICI Prudential Nifty Index Fund as on 30 Jun 24
Asset Allocation
Asset Class Value Cash 0.35% Equity 99.65% Top Securities Holdings / Portfolio
Name Holding Value Quantity HDFC Bank Ltd (Financial Services)
Equity, Since 31 Mar 05 | HDFCBANK12% ₹1,167 Cr 6,930,442
↑ 195,079 Reliance Industries Ltd (Energy)
Equity, Since 31 Mar 05 | RELIANCE10% ₹975 Cr 3,112,706
↑ 83,096 ICICI Bank Ltd (Financial Services)
Equity, Since 31 Mar 05 | ICICIBANK8% ₹777 Cr 6,474,127
↑ 185,698 Infosys Ltd (Technology)
Equity, Since 31 Mar 05 | INFY5% ₹521 Cr 3,323,638
↑ 126,664 Larsen & Toubro Ltd (Industrials)
Equity, Since 29 Feb 12 | LT4% ₹382 Cr 1,075,279
↑ 16,548 Tata Consultancy Services Ltd (Technology)
Equity, Since 31 Mar 05 | TCS4% ₹364 Cr 932,148
↑ 24,844 ITC Ltd (Consumer Defensive)
Equity, Since 29 Feb 12 | ITC4% ₹361 Cr 8,500,782
↑ 564,036 Bharti Airtel Ltd (Communication Services)
Equity, Since 31 Aug 09 | BHARTIARTL4% ₹355 Cr 2,461,075
↑ 131,366 Axis Bank Ltd (Financial Services)
Equity, Since 31 Mar 09 | AXISBANK3% ₹331 Cr 2,615,777
↑ 73,124 State Bank of India (Financial Services)
Equity, Since 31 Mar 05 | SBIN3% ₹300 Cr 3,531,067
↑ 94,101 4. Franklin India Index Fund Nifty Plan
CAGR/Annualized return of 13.2% since its launch. Ranked 76 in Index Fund category. Return for 2023 was 20.2% , 2022 was 4.9% and 2021 was 24.3% . Franklin India Index Fund Nifty Plan
Growth Launch Date 4 Aug 00 NAV (24 Jul 24) ₹195.294 ↓ -0.53 (-0.27 %) Net Assets (Cr) ₹704 on 30 Jun 24 Category Others - Index Fund AMC Franklin Templeton Asst Mgmt(IND)Pvt Ltd Rating ☆ Risk Moderately High Expense Ratio 0.67 Sharpe Ratio 1.47 Information Ratio -4.36 Alpha Ratio -0.59 Min Investment 5,000 Min SIP Investment 500 Exit Load 0-30 Days (1%),30 Days and above(NIL) Growth of 10,000 investment over the years.
Date Value 30 Jun 19 ₹10,000 30 Jun 20 ₹8,719 30 Jun 21 ₹13,331 30 Jun 22 ₹13,454 30 Jun 23 ₹16,407 30 Jun 24 ₹20,606 Returns for Franklin India Index Fund Nifty Plan
absolute basis & more than 1 year are on CAGR (Compound Annual Growth Rate) basis. as on 24 Jul 24 Duration Returns 1 Month 3.7% 3 Month 9.4% 6 Month 14.2% 1 Year 24.8% 3 Year 15.9% 5 Year 16.9% 10 Year 15 Year Since launch 13.2% Historical performance (Yearly) on absolute basis
Year Returns 2023 20.2% 2022 4.9% 2021 24.3% 2020 14.7% 2019 12% 2018 3.2% 2017 28.3% 2016 3.3% 2015 -3.6% 2014 31.2% Fund Manager information for Franklin India Index Fund Nifty Plan
Name Since Tenure Varun Sharma 30 Nov 15 8.59 Yr. Sandeep Manam 18 Oct 21 2.7 Yr. Data below for Franklin India Index Fund Nifty Plan as on 30 Jun 24
Asset Allocation
Asset Class Value Cash 0.73% Equity 99.27% Top Securities Holdings / Portfolio
Name Holding Value Quantity HDFC Bank Ltd (Financial Services)
Equity, Since 31 Jan 03 | HDFCBANK12% ₹84 Cr 499,138
↑ 1,216 Reliance Industries Ltd (Energy)
Equity, Since 31 Jan 03 | RELIANCE10% ₹70 Cr 224,112
↑ 07 ICICI Bank Ltd (Financial Services)
Equity, Since 31 Jan 10 | ICICIBANK8% ₹55 Cr 461,126 Infosys Ltd (Technology)
Equity, Since 29 Feb 12 | INFY5% ₹37 Cr 236,621
↑ 240 Larsen & Toubro Ltd (Industrials)
Equity, Since 30 Jun 12 | LT4% ₹28 Cr 78,097
↓ -107 Tata Consultancy Services Ltd (Technology)
Equity, Since 28 Feb 05 | TCS4% ₹26 Cr 67,096
↓ -123 Bharti Airtel Ltd (Communication Services)
Equity, Since 31 Mar 04 | BHARTIARTL4% ₹25 Cr 172,998
↑ 1,134 ITC Ltd (Consumer Defensive)
Equity, Since 31 Mar 11 | ITC4% ₹25 Cr 586,607
↓ -1,809 Axis Bank Ltd (Financial Services)
Equity, Since 30 Jun 09 | AXISBANK3% ₹24 Cr 187,196
↓ -533 State Bank of India (Financial Services)
Equity, Since 31 Jan 03 | SBIN3% ₹22 Cr 254,707
↑ 1,436 5. SBI Nifty Index Fund
CAGR/Annualized return of 14.8% since its launch. Ranked 75 in Index Fund category. Return for 2023 was 20.7% , 2022 was 5.1% and 2021 was 24.7% . SBI Nifty Index Fund
Growth Launch Date 17 Jan 02 NAV (24 Jul 24) ₹214.021 ↓ -0.58 (-0.27 %) Net Assets (Cr) ₹7,941 on 30 Jun 24 Category Others - Index Fund AMC SBI Funds Management Private Limited Rating ☆ Risk Moderately High Expense Ratio 0.5 Sharpe Ratio 1.48 Information Ratio -20.85 Alpha Ratio -0.53 Min Investment 5,000 Min SIP Investment 500 Exit Load 0-15 Days (0.2%),15 Days and above(NIL) Growth of 10,000 investment over the years.
Date Value 30 Jun 19 ₹10,000 30 Jun 20 ₹8,710 30 Jun 21 ₹13,366 30 Jun 22 ₹13,507 30 Jun 23 ₹16,507 30 Jun 24 ₹20,796 Returns for SBI Nifty Index Fund
absolute basis & more than 1 year are on CAGR (Compound Annual Growth Rate) basis. as on 24 Jul 24 Duration Returns 1 Month 3.8% 3 Month 9.5% 6 Month 14.3% 1 Year 24.9% 3 Year 16.2% 5 Year 17.2% 10 Year 15 Year Since launch 14.8% Historical performance (Yearly) on absolute basis
Year Returns 2023 20.7% 2022 5.1% 2021 24.7% 2020 14.6% 2019 12.5% 2018 3.8% 2017 29.1% 2016 3.4% 2015 -4.2% 2014 30.5% Fund Manager information for SBI Nifty Index Fund
Name Since Tenure Raviprakash Sharma 1 Feb 11 13.42 Yr. Mohit Jain 30 Nov 17 6.59 Yr. Data below for SBI Nifty Index Fund as on 30 Jun 24
Asset Allocation
Asset Class Value Cash 0.41% Equity 99.59% Top Securities Holdings / Portfolio
Name Holding Value Quantity HDFC Bank Ltd (Financial Services)
Equity, Since 31 Mar 03 | HDFCBANK12% ₹945 Cr 5,611,832
↓ -4,109 Reliance Industries Ltd (Energy)
Equity, Since 31 Jan 03 | RELIANCE10% ₹789 Cr 2,520,473
↓ -5,656 ICICI Bank Ltd (Financial Services)
Equity, Since 31 Jan 03 | ICICIBANK8% ₹629 Cr 5,242,339
↓ -865 Infosys Ltd (Technology)
Equity, Since 31 Jan 03 | INFY5% ₹422 Cr 2,691,273
↑ 25,698 Larsen & Toubro Ltd (Industrials)
Equity, Since 31 Dec 04 | LT4% ₹309 Cr 870,695
↓ -12,079 Tata Consultancy Services Ltd (Technology)
Equity, Since 28 Feb 05 | TCS4% ₹295 Cr 754,795
↓ -1,698 ITC Ltd (Consumer Defensive)
Equity, Since 29 Feb 12 | ITC4% ₹292 Cr 6,883,395
↑ 265,841 Bharti Airtel Ltd (Communication Services)
Equity, Since 29 Feb 04 | BHARTIARTL4% ₹288 Cr 1,992,824
↑ 50,298 Axis Bank Ltd (Financial Services)
Equity, Since 28 Feb 10 | AXISBANK3% ₹268 Cr 2,118,092
↓ -2,007 State Bank of India (Financial Services)
Equity, Since 31 Jan 03 | SBIN3% ₹243 Cr 2,859,235
↓ -6,439 6. IDBI Nifty Index Fund
CAGR/Annualized return of 10.3% since its launch. Ranked 83 in Index Fund category. . IDBI Nifty Index Fund
Growth Launch Date 25 Jun 10 NAV (28 Jul 23) ₹36.2111 ↓ -0.02 (-0.06 %) Net Assets (Cr) ₹208 on 30 Jun 23 Category Others - Index Fund AMC IDBI Asset Management Limited Rating ☆ Risk Moderately High Expense Ratio 0.9 Sharpe Ratio 1.04 Information Ratio -3.93 Alpha Ratio -1.03 Min Investment 5,000 Min SIP Investment 500 Exit Load NIL Growth of 10,000 investment over the years.
Date Value 30 Jun 19 ₹10,000 30 Jun 20 ₹8,729 30 Jun 21 ₹13,256 30 Jun 22 ₹13,364 30 Jun 23 ₹16,257 Returns for IDBI Nifty Index Fund
absolute basis & more than 1 year are on CAGR (Compound Annual Growth Rate) basis. as on 24 Jul 24 Duration Returns 1 Month 3.7% 3 Month 9.1% 6 Month 11.9% 1 Year 16.2% 3 Year 20.3% 5 Year 11.7% 10 Year 15 Year Since launch 10.3% Historical performance (Yearly) on absolute basis
Year Returns 2023 2022 2021 2020 2019 2018 2017 2016 2015 2014 Fund Manager information for IDBI Nifty Index Fund
Name Since Tenure Data below for IDBI Nifty Index Fund as on 30 Jun 23
Asset Allocation
Asset Class Value Top Securities Holdings / Portfolio
Name Holding Value Quantity 7. Nippon India Index Fund - Nifty Plan
CAGR/Annualized return of 10.8% since its launch. Ranked 78 in Index Fund category. Return for 2023 was 20.5% , 2022 was 4.6% and 2021 was 24% . Nippon India Index Fund - Nifty Plan
Growth Launch Date 28 Sep 10 NAV (24 Jul 24) ₹41.0789 ↓ -0.11 (-0.27 %) Net Assets (Cr) ₹1,796 on 30 Jun 24 Category Others - Index Fund AMC Nippon Life Asset Management Ltd. Rating ☆ Risk Moderately High Expense Ratio 0.78 Sharpe Ratio 1.47 Information Ratio -11 Alpha Ratio -0.61 Min Investment 5,000 Min SIP Investment 100 Exit Load 0-7 Days (0.25%),7 Days and above(NIL) Growth of 10,000 investment over the years.
Date Value 30 Jun 19 ₹10,000 30 Jun 20 ₹8,715 30 Jun 21 ₹13,290 30 Jun 22 ₹13,351 30 Jun 23 ₹16,285 30 Jun 24 ₹20,494 Returns for Nippon India Index Fund - Nifty Plan
absolute basis & more than 1 year are on CAGR (Compound Annual Growth Rate) basis. as on 24 Jul 24 Duration Returns 1 Month 4.2% 3 Month 9.9% 6 Month 15.7% 1 Year 24.6% 3 Year 15.9% 5 Year 16.8% 10 Year 15 Year Since launch 10.8% Historical performance (Yearly) on absolute basis
Year Returns 2023 20.5% 2022 4.6% 2021 24% 2020 14.3% 2019 12.3% 2018 3.5% 2017 29% 2016 2.5% 2015 -3.9% 2014 31.9% Fund Manager information for Nippon India Index Fund - Nifty Plan
Name Since Tenure Himanshu Mange 23 Dec 23 0.52 Yr. Data below for Nippon India Index Fund - Nifty Plan as on 30 Jun 24
Asset Allocation
Asset Class Value Cash 0.38% Equity 99.62% Top Securities Holdings / Portfolio
Name Holding Value Quantity HDFC Bank Ltd (Financial Services)
Equity, Since 31 Oct 10 | HDFCBANK12% ₹214 Cr 1,269,640
↑ 24,288 Reliance Industries Ltd (Energy)
Equity, Since 31 Oct 10 | RELIANCE10% ₹179 Cr 570,240
↑ 10,072 ICICI Bank Ltd (Financial Services)
Equity, Since 31 Oct 10 | ICICIBANK8% ₹142 Cr 1,186,044
↑ 23,354 Infosys Ltd (Technology)
Equity, Since 31 Oct 10 | INFY5% ₹95 Cr 608,882
↑ 17,787 Larsen & Toubro Ltd (Industrials)
Equity, Since 29 Feb 12 | LT4% ₹70 Cr 196,989
↑ 1,231 Tata Consultancy Services Ltd (Technology)
Equity, Since 31 Oct 10 | TCS4% ₹67 Cr 170,767
↑ 3,013 ITC Ltd (Consumer Defensive)
Equity, Since 29 Feb 12 | ITC4% ₹66 Cr 1,557,322
↑ 89,882 Bharti Airtel Ltd (Communication Services)
Equity, Since 31 Oct 10 | BHARTIARTL4% ₹65 Cr 450,863
↑ 20,105 Axis Bank Ltd (Financial Services)
Equity, Since 31 Oct 10 | AXISBANK3% ₹61 Cr 479,204
↑ 9,073 State Bank of India (Financial Services)
Equity, Since 31 Oct 10 | SBIN3% ₹55 Cr 646,883
↑ 11,414 8. ICICI Prudential Nifty Next 50 Index Fund
CAGR/Annualized return of 14% since its launch. Ranked 5 in Index Fund category. Return for 2023 was 26.3% , 2022 was 0.1% and 2021 was 29.5% . ICICI Prudential Nifty Next 50 Index Fund
Growth Launch Date 25 Jun 10 NAV (24 Jul 24) ₹63.1804 ↑ 0.19 (0.30 %) Net Assets (Cr) ₹5,845 on 30 Jun 24 Category Others - Index Fund AMC ICICI Prudential Asset Management Company Limited Rating ☆☆☆☆☆ Risk Moderately High Expense Ratio 0.7 Sharpe Ratio 3.16 Information Ratio -12.51 Alpha Ratio -0.64 Min Investment 5,000 Min SIP Investment 100 Exit Load 0-7 Days (0.25%),7 Days and above(NIL) Growth of 10,000 investment over the years.
Date Value 30 Jun 19 ₹10,000 30 Jun 20 ₹9,399 30 Jun 21 ₹13,988 30 Jun 22 ₹13,302 30 Jun 23 ₹15,921 30 Jun 24 ₹26,024 Returns for ICICI Prudential Nifty Next 50 Index Fund
absolute basis & more than 1 year are on CAGR (Compound Annual Growth Rate) basis. as on 24 Jul 24 Duration Returns 1 Month 0.7% 3 Month 14.1% 6 Month 34.5% 1 Year 62% 3 Year 22.2% 5 Year 21.8% 10 Year 15 Year Since launch 14% Historical performance (Yearly) on absolute basis
Year Returns 2023 26.3% 2022 0.1% 2021 29.5% 2020 14.3% 2019 0.6% 2018 -8.8% 2017 45.7% 2016 7.6% 2015 6.2% 2014 43.6% Fund Manager information for ICICI Prudential Nifty Next 50 Index Fund
Name Since Tenure Nishit Patel 18 Jan 21 3.45 Yr. Priya Sridhar 1 Feb 24 0.41 Yr. Ajaykumar Solanki 1 Feb 24 0.41 Yr. Data below for ICICI Prudential Nifty Next 50 Index Fund as on 30 Jun 24
Asset Allocation
Asset Class Value Cash 0.39% Equity 99.61% Top Securities Holdings / Portfolio
Name Holding Value Quantity Trent Ltd (Consumer Cyclical)
Equity, Since 30 Sep 23 | TRENT6% ₹323 Cr 589,730
↑ 11,738 Bharat Electronics Ltd (Industrials)
Equity, Since 30 Sep 22 | BEL5% ₹293 Cr 9,583,801
↑ 190,341 Hindustan Aeronautics Ltd Ordinary Shares (Industrials)
Equity, Since 30 Sep 22 | HAL5% ₹264 Cr 501,043
↑ 9,969 Tata Power Co Ltd (Utilities)
Equity, Since 31 Aug 22 | TATAPOWER3% ₹200 Cr 4,531,379
↑ 90,009 Power Finance Corp Ltd (Financial Services)
Equity, Since 31 Mar 24 | PFC3% ₹188 Cr 3,885,235
↑ 77,180 InterGlobe Aviation Ltd (Industrials)
Equity, Since 30 Sep 16 | INDIGO3% ₹188 Cr 444,089
↑ 69,584 Siemens Ltd (Industrials)
Equity, Since 30 Apr 13 | SIEMENS3% ₹184 Cr 238,217
↑ 4,754 REC Ltd (Financial Services)
Equity, Since 31 Mar 24 | RECLTD3% ₹174 Cr 3,311,486
↑ 65,779 Vedanta Ltd (Basic Materials)
Equity, Since 31 Mar 21 | 5002953% ₹172 Cr 3,779,529
↑ 270,052 Indian Oil Corp Ltd (Energy)
Equity, Since 31 Mar 22 | IOC3% ₹163 Cr 9,823,892
↑ 195,108 9. IDBI Nifty Junior Index Fund
CAGR/Annualized return of 12.8% since its launch. Ranked 8 in Index Fund category. Return for 2023 was 25.7% , 2022 was 0.4% and 2021 was 29.6% . IDBI Nifty Junior Index Fund
Growth Launch Date 20 Sep 10 NAV (24 Jul 24) ₹53.2891 ↑ 0.16 (0.30 %) Net Assets (Cr) ₹90 on 30 Jun 24 Category Others - Index Fund AMC IDBI Asset Management Limited Rating ☆☆☆☆☆ Risk Moderately High Expense Ratio 0.73 Sharpe Ratio 3.13 Information Ratio -7.32 Alpha Ratio -1.08 Min Investment 5,000 Min SIP Investment 500 Exit Load NIL Growth of 10,000 investment over the years.
Date Value 30 Jun 19 ₹10,000 30 Jun 20 ₹9,439 30 Jun 21 ₹13,921 30 Jun 22 ₹13,254 30 Jun 23 ₹15,852 30 Jun 24 ₹25,768 Returns for IDBI Nifty Junior Index Fund
absolute basis & more than 1 year are on CAGR (Compound Annual Growth Rate) basis. as on 24 Jul 24 Duration Returns 1 Month 0.3% 3 Month 13.4% 6 Month 32.2% 1 Year 61.7% 3 Year 22.1% 5 Year 22% 10 Year 15 Year Since launch 12.8% Historical performance (Yearly) on absolute basis
Year Returns 2023 25.7% 2022 0.4% 2021 29.6% 2020 13.7% 2019 0.5% 2018 -9.3% 2017 43.6% 2016 6.9% 2015 5.8% 2014 42.8% Fund Manager information for IDBI Nifty Junior Index Fund
Name Since Tenure Sumit Bhatnagar 3 Oct 23 0.75 Yr. Data below for IDBI Nifty Junior Index Fund as on 30 Jun 24
Asset Allocation
Asset Class Value Cash 0.56% Equity 99.44% Top Securities Holdings / Portfolio
Name Holding Value Quantity Trent Ltd (Consumer Cyclical)
Equity, Since 30 Sep 23 | TRENT5% ₹5 Cr 8,861
↓ -275 Bharat Electronics Ltd (Industrials)
Equity, Since 30 Sep 22 | BEL5% ₹5 Cr 148,660
↑ 532 Hindustan Aeronautics Ltd Ordinary Shares (Industrials)
Equity, Since 30 Sep 22 | HAL5% ₹4 Cr 7,757
↓ -23 Tata Power Co Ltd (Utilities)
Equity, Since 31 Aug 22 | TATAPOWER3% ₹3 Cr 70,133
↓ -300 Power Finance Corp Ltd (Financial Services)
Equity, Since 31 Mar 24 | PFC3% ₹3 Cr 59,888
↓ -82 InterGlobe Aviation Ltd (Industrials)
Equity, Since 30 Sep 16 | INDIGO3% ₹3 Cr 6,840
↑ 940 Siemens Ltd (Industrials)
Equity, Since 30 Apr 13 | SIEMENS3% ₹3 Cr 3,744
↑ 60 REC Ltd (Financial Services)
Equity, Since 31 Mar 24 | RECLTD3% ₹3 Cr 51,037
↓ -186 Vedanta Ltd (Basic Materials)
Equity, Since 31 Mar 21 | 5002953% ₹3 Cr 56,843
↑ 1,201 Cholamandalam Investment and Finance Co Ltd (Financial Services)
Equity, Since 30 Sep 21 | CHOLAFIN3% ₹3 Cr 17,615
↑ 604
প্যাসিভ ইনডেক্স ফান্ড ভালো কেন?
দ্য অ্যাসোসিয়েশন অফ মিউচুয়াল ফান্ড ইন ইন্ডিয়া (AMFI) বলেছে যে সূচক তহবিল একটি AUM সংগ্রহ করেছেরুপি 7717 কোটি নভেম্বর 2019-এ প্যাসিভ লার্জ-ক্যাপ ইটিএফগুলি সক্রিয়ভাবে পরিচালিত হওয়ার তুলনায় 11.53% রিটার্ন অফার করেবড় ক্যাপ তহবিল যে প্রস্তাব 10.19%.
সোনার ইটিএফ দাঁড়িয়েরুপি 5,540.40 কোটি নভেম্বর 2019 হিসাবে। এটি Rs-এর তুলনায় আসে। ডিসেম্বর 2018-এ 4,571 কোটি। অন্যান্য ETF-এর AUM দাঁড়িয়েছে Rs. 1,63,923.66 কোটি টাকার তুলনায় 2018 সালের শেষে 1,07,363 কোটি টাকা।
লার্জ ক্যাপ ইটিএফ
2019 এর একটি বড় অংশ প্রত্যক্ষ করেছে যে লার্জ-ক্যাপ স্কিমগুলি রিটার্ন চার্টের শীর্ষে ছিল। এমনকি 2020 সালে, শীর্ষ 15টি বড়-ক্যাপ স্কিমগুলির মধ্যে নয়টি রয়েছে৷প্যাসিভ ফান্ড.
প্যাসিভ ফান্ড - করোনাভাইরাস মহামারীর মধ্যে নিরাপদ স্বর্গ
বিশ্বব্যাপী বর্তমান পরিস্থিতির সাথে, আর্থিক বাজারগুলি গভীর উদ্বেগের সমস্যাগুলির মুখোমুখি হচ্ছে। যদিও বিনিয়োগকারীরা অতীতে ঝুঁকি নিতে ইচ্ছুক ছিল, আজকের পরিস্থিতি বেশিরভাগ বিনিয়োগকারীকে একটি ঝুঁকি খুঁজতে বাধ্য করেছেনিরাপদ স্বর্গ. এর মানে তারা এমন একটি বিনিয়োগ খুঁজছেন যা উচ্চতর রিটার্ন বা অন্তত স্থিতিশীল রিটার্ন দেবে।
অনেক বিনিয়োগকারী এখন এক্সচেঞ্জ-ট্রেডেড ফান্ড বা ইনডেক্স ফান্ডের মতো প্যাসিভ মোডের মাধ্যমে বিনিয়োগ করতে চাইছেন। AMFI-এর মতে, সূচক তহবিলে ইনফ্লো সর্বকালের সর্বোচ্চের সম্মুখীন হয়েছে৷রুপি 2076.5 কোটি মার্চ 2020 এ।
প্যাসিভ ফান্ড বনাম অ্যাক্টিভ ফান্ড
তারা যেভাবে কাজ করে এবং বিনিয়োগকারীকে প্রভাবিত করে তাতে নির্দিষ্ট পার্থক্য রয়েছে।
ট্যাবুলার প্যাসিভ ফান্ড এবং অ্যাক্টিভ ফান্ডের মধ্যে পার্থক্য করে:
| প্যাসিভ ফান্ড | সক্রিয় তহবিল |
|---|---|
| তাদের ফান্ড ম্যানেজারদের সক্রিয় অংশগ্রহণ নেই | ফান্ড ম্যানেজাররা অনেক শিল্প গবেষণা করেন এবং বাজারের পারফরম্যান্সের উপর ভিত্তি করে বিভিন্ন সিকিউরিটিজে তহবিল নির্বাচন করতে সেই অনুযায়ী পদক্ষেপ নেন |
| কম দামী | যেহেতু বিনিয়োগের দিকে একটি কাজ করা আছে, এটি ব্যয়বহুল হতে পারে |
| কম খরচের অনুপাতের কারণে জনপ্রিয় | উচ্চ ব্যয় অনুপাতের কারণে কম জনপ্রিয় হতে পারে |
ইনডেক্স ফান্ডে বিনিয়োগের ঝুঁকি
সূচক মিউচুয়াল ফান্ডের নমনীয়তা নেই
একটি বড় অসুবিধা হল নমনীয়তার অভাব। যেহেতু তহবিলগুলি কেবলমাত্র সূচক ট্র্যাক করে, তাই তারা উচ্চতর রিটার্ন করার সুযোগটি হাতছাড়া করতে পারে যা বাজারের অসঙ্গতি এবং সূচকের সাথে সংযুক্ত নয় এমন বিস্ময়ের কারণে উদ্ভূত হতে পারে। সাধারণত, মূল্য স্টকগুলি একটি সূচকের অংশ হতে খুব কঠিন বলে মনে করে।
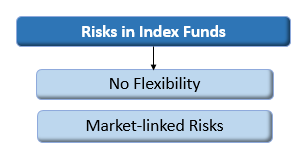
সূচক মিউচুয়াল ফান্ডে বাজারের ঝুঁকি
বাজারের সঙ্গে তাদের সরাসরি সম্পর্ক রয়েছে। সুতরাং, যখন স্টক মার্কেট সামগ্রিকভাবে পড়ে, তখন সূচক মিউচুয়াল ফান্ডের মানও পড়ে।
কিছু অসুবিধা থাকা সত্ত্বেও, শীর্ষ সূচক তহবিল বিনিয়োগকারীদের জন্য উপকারী হতে পারে যারা বিনিয়োগ করতে চানইক্যুইটি একটি ন্যূনতম ঝুঁকি সঙ্গেফ্যাক্টর. বিশেষজ্ঞদের মতে, বিনিয়োগকারীদের তাদের বিনিয়োগের পোর্টফোলিওতে ইনডেক্স ফান্ডের 5-6% অন্তর্ভুক্ত করার পরামর্শ দেওয়া হয় যাতে তারা তাদের বিনিয়োগ থেকে সেরাটা লাভ করতে পারে।
কিভাবে ইনডেক্স মিউচুয়াল ফান্ড অনলাইনে বিনিয়োগ করবেন?
Fincash.com এ আজীবনের জন্য বিনামূল্যে বিনিয়োগ অ্যাকাউন্ট খুলুন।
আপনার রেজিস্ট্রেশন এবং KYC প্রক্রিয়া সম্পূর্ণ করুন
নথি আপলোড করুন (প্যান, আধার, ইত্যাদি)।এবং, আপনি বিনিয়োগ করতে প্রস্তুত!
FAQs
1. কেন আপনার সূচক মিউচুয়াল ফান্ডে বিনিয়োগ করা উচিত?
ক: আপনি যদি দীর্ঘমেয়াদী বিনিয়োগ করতে চান, তাহলে আপনি সূচক তহবিল বিবেচনা করতে পারেন। এই তহবিলগুলির পোর্টফোলিওগুলি NSE এবং SENSEX-এর গঠন এবং আচরণ ট্র্যাক করে ডিজাইন করা হয়েছে। যেহেতু এই পোর্টফোলিওগুলি স্টকগুলির কার্যকারিতা এবং শেয়ারগুলিকে দীর্ঘ সময়ের জন্য মূল্যায়ন করে তৈরি করা হয়, তাই আপনার বিনিয়োগের কার্যকারিতা না হওয়ার সম্ভাবনা হ্রাস করা হয়। তাই, সূচক মিউচুয়াল ফান্ডে বিনিয়োগ করার পরামর্শ দেওয়া হয়, বিশেষ করে যদি আপনি ঝুঁকি কমাতে চান।
2. কিভাবে একটি নির্দিষ্ট সূচক MF নির্বাচন করবেন?
ক: সূচক মিউচুয়াল ফান্ডের দীর্ঘমেয়াদী কর্মক্ষমতার উপর ভিত্তি করে আপনার একটি পৃথক পোর্টফোলিও নির্বাচন করা উচিত। আরও কিছু নির্ভরযোগ্য তহবিল হল SBI, LICI, ICICI প্রুডেনশিয়াল UTI, এবং অন্যান্য অনুরূপ সূচক তহবিলগুলি বেঞ্চমার্কিংয়ের ভিত্তি হিসাবে ব্যবহৃত হয়।
3. একটি সূচক তহবিলে বিনিয়োগের প্রধান সুবিধা কী?
ক: সূচক তহবিল নিষ্ক্রিয়ভাবে পরিচালিত হয়। এইভাবে, সূচক তহবিলের মোট ব্যয় অনুপাত বা TER সক্রিয়ভাবে পরিচালিত তহবিলের তুলনায় কম। এর মানে আপনার বিনিয়োগ কম হবে, এবং আপনি যে খরচ আশা করতে পারেন তা কম হতে পারে0.2% থেকে 0.5% আপনার বিনিয়োগের। কম TER একটি সূচক তহবিলে বিনিয়োগের প্রধান সুবিধা।
4. SBI নিফটি ইনডেক্স ফান্ড থেকে কতটা আশা করা যায়?
ক: এসবিআই নিফটি সূচক তহবিল নিষ্ক্রিয়ভাবে পরিচালিত হয় এবং এর বৃদ্ধির হার দেখায়15.19% বনাম নিফটি 50, যার বৃদ্ধির হার রয়েছে15.5%. তাই আপনি যদি এসবিআই নিফটি ইনডেক্স ফান্ডে 10-বছরের বিনিয়োগ করেন, আপনি একটি আশা করতে পারেন85.77% আপনার বিনিয়োগ ফেরত.
5. আপনি যদি ICICI প্রুডেনশিয়াল নিফটি ইনডেক্স ফান্ডে বিনিয়োগ করেন তাহলে আপনি কী আশা করতে পারেন?
ক: আইসিআইসিআই প্রুডেনশিয়াল নিফটি সূচক তহবিলের একটি বিভাগ গড় রয়েছে16.78%. ধরুন, আপনি যদি 5 বছরের জন্য বিনিয়োগ করেন, তাহলে আপনি সম্পূর্ণ রিটার্ন আশা করতে পারেন45.88%.
6. কিভাবে সূচক তহবিল বৈচিত্র্য যোগ করে?
ক: সূচক তহবিল প্রাথমিকভাবে শীর্ষস্থানীয় কোম্পানিগুলির সমন্বয়ে গঠিত যাদের স্টকগুলি বেঞ্চমার্ক হিসাবে ব্যবহৃত হয়। উপরন্তু, একটি একক পোর্টফোলিওতে, আপনার একাধিক নেতৃস্থানীয় কোম্পানি থাকবে, যার মানে আপনার বিনিয়োগ হারানোর সম্ভাবনা কমে যাবে। এই স্বয়ংক্রিয় বৈচিত্র্য স্বয়ংক্রিয়ভাবে বিনিয়োগকারীর বিনিয়োগ হারানোর ঝুঁকি হ্রাস করে।
7. কখন আপনার ইনডেক্স ফান্ডে বিনিয়োগ করার কথা বিবেচনা করা উচিত?
ক: আপনি যখন কমপক্ষে 5 বছরের জন্য আপনার বিনিয়োগ ধরে রাখতে প্রস্তুত হন তখন আপনার ইনডেক্স ফান্ডে বিনিয়োগ করা উচিত।
8. কোন উপায় আছে যে আমি সেরা সূচক তহবিল নির্বাচন করতে পারি?
ক: আপনি যদি একজন নবাগত হন তবে আপনার ফান্ড ম্যানেজারের সাথে এটি নিয়ে আলোচনা করা উচিত। তারা আপনাকে উপযুক্ত তহবিল সম্পর্কে সিদ্ধান্ত নিতে সাহায্য করে। উপরন্তু, আপনি বিনিয়োগের সময়কাল বিবেচনা করা উচিত.
9. সূচক তহবিলে বিনিয়োগের জন্য আদর্শভাবে কে উপযুক্ত?
ক: যে ব্যক্তিরা যখন খুব বেশি ঝুঁকি নিতে চান নামিউচুয়াল ফান্ডে বিনিয়োগ ইনডেক্স ফান্ডে বিনিয়োগ বিবেচনা করতে পারেন। এই তহবিলগুলি কেবল বিনিয়োগকারীদের নিশ্চিত রিটার্নের আশ্বাস দেয় না, তবে বিনিয়োগকারীদের কাছ থেকে ব্যাপক বিনিয়োগেরও প্রয়োজন হয় না।
এখানে প্রদত্ত তথ্য সঠিক কিনা তা নিশ্চিত করার জন্য সমস্ত প্রচেষ্টা করা হয়েছে। যাইহোক, তথ্যের সঠিকতা সম্পর্কে কোন গ্যারান্টি দেওয়া হয় না। কোনো বিনিয়োগ করার আগে স্কিমের তথ্য নথির সাথে যাচাই করুন।
You Might Also Like


AMFI Registration No. 112358 | CIN: U74999MH2016PTC282153
Shepard Technologies Pvt. Ltd. (with ARN code 112358) makes no warranties or representations, express or implied, on products offered through the platform. It accepts no liability for any damages or losses, however caused, in connection with the use of, or on the reliance of its product or related services. Terms and conditions of the website are applicable.
©2024 Shepard Technologies Private Limited. All Rights Reserved
Quite detailed review which helps in deciding which is a better performing index fund