
 +91-22-48913909
ಮನಿ ಮಾರ್ಕೆಟ್ ಮ್ಯೂಚುಯಲ್ ಫಂಡ್ಗಳು
ಮನಿ ಮಾರ್ಕೆಟ್ ಫಂಡ್ಗಳು ಯಾವುವು?
ಒಂದು ಹಣಮಾರುಕಟ್ಟೆ ನಿಧಿ (MMF) ಒಂದು ರೀತಿಯ ಸ್ಥಿರವಾಗಿದೆಆದಾಯ ಸಾಲ ಭದ್ರತೆಗಳಲ್ಲಿ ಹೂಡಿಕೆ ಮಾಡುವ ಮ್ಯೂಚುಯಲ್ ಫಂಡ್. ಆದರೆ, ನಾವು ಹಣದ ಮಾರುಕಟ್ಟೆ ನಿಧಿಗಳೊಂದಿಗೆ ಪ್ರಾರಂಭಿಸುವ ಮೊದಲು, ಸ್ಥಿರ ಆದಾಯ ಸಾಧನ ಯಾವುದು ಎಂಬುದನ್ನು ಅರ್ಥಮಾಡಿಕೊಳ್ಳುವುದು ಮುಖ್ಯವಾಗಿದೆ? ಸರಿ, ಹೆಸರೇ ಸೂಚಿಸುವಂತೆ, ಸ್ಥಿರ ಆದಾಯ ಸಾಧನವು ಒಂದು ನಿರ್ದಿಷ್ಟ ಅವಧಿಯಲ್ಲಿ ನಿರ್ದಿಷ್ಟ ಪ್ರಮಾಣದ ಆದಾಯವನ್ನು ಉತ್ಪಾದಿಸುತ್ತದೆ. ದಿಹೂಡಿಕೆದಾರ ವಿತರಕರು ಹೊಂದಿರುವ ಆಸ್ತಿಗಳ ಮೇಲೆ ಸ್ಥಿರವಾದ ಕ್ಲೈಮ್ ಅನ್ನು ನೀಡಲಾಗುತ್ತದೆ, ಸ್ಥಿರ ಆದಾಯದ ಸಾಧನಗಳನ್ನು ಕಡಿಮೆ-ಅಪಾಯ ಮತ್ತು ಕಡಿಮೆ-ಇಳುವರಿ ಹೂಡಿಕೆ ಎಂದು ಪರಿಗಣಿಸಲಾಗುತ್ತದೆ.
ಮೂಲಭೂತವಾಗಿ, ಸ್ಥಿರ ಆದಾಯದ ಸಾಧನಗಳು ಏನೂ ಅಲ್ಲ, ಆದರೆ ಹಣವನ್ನು ಎರವಲು ಪಡೆಯುವ ಮಾರ್ಗವಾಗಿದೆ (ಅಲ್ಲಿ ಸಾಲವನ್ನು ನೀಡುವವರು ಮಾಡುತ್ತಾರೆ).
ಸ್ಥಿರ ಆದಾಯ Vs ಷೇರುಗಳು
ಆರಂಭಿಕರಿಗಾಗಿ ಸ್ಥಿರ ಆದಾಯವು ಹಿಡುವಳಿದಾರರಿಗೆ ಆರ್ಥಿಕ ಹಕ್ಕುಗಳನ್ನು ನೀಡುತ್ತದೆ, ಇದು ಬಡ್ಡಿ ಪಾವತಿಗಳನ್ನು ಪಡೆಯುವ ಹಕ್ಕನ್ನು ಮತ್ತು ಎಲ್ಲಾ ಅಥವಾ ಭಾಗವನ್ನು ಹಿಂದಿರುಗಿಸುತ್ತದೆಬಂಡವಾಳ ನಿರ್ದಿಷ್ಟ ದಿನಾಂಕದಲ್ಲಿ ಹೂಡಿಕೆ ಮಾಡಲಾಗಿದೆ. ಇದಕ್ಕೆ ವಿರುದ್ಧವಾಗಿ, ದಿಷೇರುದಾರ (ಸ್ಟಾಕ್ ಮಾಲೀಕರು) ವಿತರಕರಿಂದ ಲಾಭಾಂಶವನ್ನು ಪಡೆಯುತ್ತಾರೆ, ಆದರೆ ಕಂಪನಿಯು ಲಾಭಾಂಶವನ್ನು ಪಾವತಿಸಲು ಯಾವುದೇ ಕಾನೂನಿನಿಂದ ಬದ್ಧವಾಗಿಲ್ಲ. ಅಲ್ಲದೆ, ಮತ್ತೊಂದು ಪ್ರಮುಖ ವ್ಯತ್ಯಾಸವೆಂದರೆ ಸ್ಥಿರ ಆದಾಯ ಹೊಂದಿರುವವರು ಭದ್ರತೆಯನ್ನು ನೀಡುವ ಕಂಪನಿಯ ಸಾಲಗಾರರಾಗಿದ್ದಾರೆ, ಆದರೆ ಷೇರುದಾರರು ಪಾಲುದಾರರಾಗಿದ್ದು, ಬಂಡವಾಳದ ಷೇರುಗಳ ಒಂದು ಭಾಗವನ್ನು ಹೊಂದಿದ್ದಾರೆ. ಕಂಪನಿಯು ಸ್ಥಗಿತಗೊಂಡರೆ, ಸಾಲದಾತರು (ಬಾಂಡ್ ಹೋಲ್ಡರ್ಗಳು) ಷೇರುದಾರರ (ಇಕ್ವಿಟಿ ಹೊಂದಿರುವವರು) ಆದ್ಯತೆಯನ್ನು ಹೊಂದಿರುತ್ತಾರೆ ಎಂಬುದನ್ನು ಇಲ್ಲಿ ಅರ್ಥಮಾಡಿಕೊಳ್ಳುವುದು ಬಹಳ ಮುಖ್ಯ.
ಸ್ಥಿರ ಆದಾಯದ ಸಾಧನಗಳ ವಿಧಗಳು
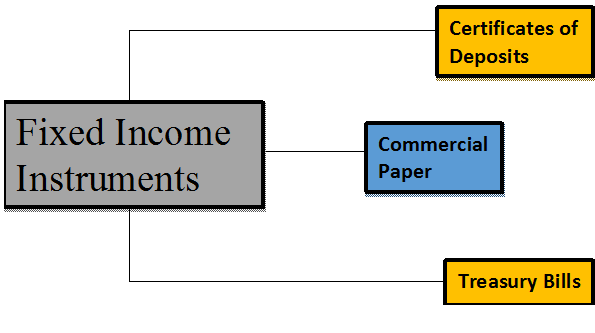
ಹಣದ ಮಾರುಕಟ್ಟೆ ಉಪಕರಣಗಳ ಅಡಿಯಲ್ಲಿ ಬರುವ ವಿವಿಧ ಸ್ಥಿರ ಆದಾಯ ಸಾಧನಗಳಿವೆ, ಅವುಗಳಲ್ಲಿ ಕೆಲವನ್ನು ಹೆಸರಿಸಲು:
ಠೇವಣಿಗಳ ಪ್ರಮಾಣಪತ್ರಗಳು (ಸಿಡಿಗಳು)
ಅವಧಿ ಠೇವಣಿಗಳಂತಹ ಸಮಯ ಠೇವಣಿಗಳನ್ನು ಸಾಮಾನ್ಯವಾಗಿ ಬ್ಯಾಂಕುಗಳು (ಶೆಡ್ಯೂಲ್ಡ್ ವಾಣಿಜ್ಯ ಬ್ಯಾಂಕುಗಳು) ಮತ್ತು ಅಖಿಲ ಭಾರತ ಹಣಕಾಸು ಸಂಸ್ಥೆಗಳು ಗ್ರಾಹಕರಿಗೆ ನೀಡಲಾಗುತ್ತದೆ. ಇದು ಮತ್ತು ಒಂದು ಅವಧಿಯ ಠೇವಣಿ ನಡುವಿನ ವ್ಯತ್ಯಾಸ aಬ್ಯಾಂಕ್ ಸಿಡಿಗಳನ್ನು ಹಿಂಪಡೆಯಲು ಸಾಧ್ಯವಿಲ್ಲ.
ಕಮರ್ಷಿಯಲ್ ಪೇಪರ್ (CPs)
ಕಮರ್ಷಿಯಲ್ ಪೇಪರ್ಗಳನ್ನು ಸಾಮಾನ್ಯವಾಗಿ ಪ್ರಾಮಿಸರಿ ನೋಟ್ಗಳು ಎಂದು ಕರೆಯಲಾಗುತ್ತದೆ, ಅವುಗಳು ಅಸುರಕ್ಷಿತವಾಗಿರುತ್ತವೆ ಮತ್ತು ಸಾಮಾನ್ಯವಾಗಿ ಕಂಪನಿಗಳು ಮತ್ತು ಹಣಕಾಸು ಸಂಸ್ಥೆಗಳಿಂದ ರಿಯಾಯಿತಿ ದರದಲ್ಲಿ ನೀಡಲಾಗುತ್ತದೆ.ಮುಖ ಬೆಲೆ. ವಾಣಿಜ್ಯ ಪತ್ರಿಕೆಗಳಿಗೆ ನಿಗದಿತ ಮುಕ್ತಾಯವು 1 ರಿಂದ 270 ದಿನಗಳು. ಅವುಗಳನ್ನು ನೀಡಲಾದ ಉದ್ದೇಶಗಳೆಂದರೆ - ದಾಸ್ತಾನು ಹಣಕಾಸು, ಖಾತೆಗಳಿಗಾಗಿಕರಾರುಗಳು, ಮತ್ತು ಅಲ್ಪಾವಧಿಯ ಹೊಣೆಗಾರಿಕೆಗಳು ಅಥವಾ ಸಾಲಗಳನ್ನು ಇತ್ಯರ್ಥಪಡಿಸುವುದು.
Talk to our investment specialist
ಖಜಾನೆ ಬಿಲ್ಗಳು (ಟಿ-ಬಿಲ್ಗಳು)
ಖಜಾನೆ ಬಿಲ್ಗಳನ್ನು ಮೊದಲು 1917 ರಲ್ಲಿ ಭಾರತ ಸರ್ಕಾರವು ನೀಡಿತು. ಖಜಾನೆ ಬಿಲ್ಗಳು ದೇಶದ ಸೆಂಟ್ರಲ್ ಬ್ಯಾಂಕ್ನಿಂದ ನೀಡಲಾದ ಅಲ್ಪಾವಧಿಯ ಹಣಕಾಸು ಸಾಧನಗಳಾಗಿವೆ. ಇದು ಸುರಕ್ಷಿತ ಹಣ ಮಾರುಕಟ್ಟೆ ಸಾಧನಗಳಲ್ಲಿ ಒಂದಾಗಿದೆ ಏಕೆಂದರೆ ಇದು ಮಾರುಕಟ್ಟೆಯ ಅಪಾಯಗಳಿಂದ ಅನೂರ್ಜಿತವಾಗಿದೆ (ಅಪಾಯವು ಸಾರ್ವಭೌಮ ಅಥವಾ ಈ ಸಂದರ್ಭದಲ್ಲಿ ಭಾರತ ಸರ್ಕಾರವಾಗಿದೆ), ಆದರೂ ಹೂಡಿಕೆಯ ಮೇಲಿನ ಲಾಭವು ದೊಡ್ಡದಲ್ಲ. ಖಜಾನೆ ಬಿಲ್ಗಳನ್ನು ಪ್ರಾಥಮಿಕ ಮತ್ತು ದ್ವಿತೀಯ ಮಾರುಕಟ್ಟೆಗಳಿಂದ ಚಲಾವಣೆ ಮಾಡಲಾಗುತ್ತದೆ. ಖಜಾನೆ ಬಿಲ್ಗಳ ಮುಕ್ತಾಯ ಅವಧಿಗಳು ಕ್ರಮವಾಗಿ 3-ತಿಂಗಳು, 6-ತಿಂಗಳು ಮತ್ತು 1-ವರ್ಷಗಳಾಗಿವೆ.
ಮರುಖರೀದಿ ಒಪ್ಪಂದಗಳು (ರೆಪೋಗಳು), ಆಸ್ತಿ-ಬೆಂಬಲಿತ ಭದ್ರತೆಗಳು ಇತ್ಯಾದಿಗಳಂತಹ ಸಾಕಷ್ಟು ಇತರ ಸ್ಥಿರ ಆದಾಯದ ಸಾಧನಗಳಿವೆ, ಅವು ಭಾರತೀಯ ಸ್ಥಿರ ಆದಾಯ ಮಾರುಕಟ್ಟೆಯಲ್ಲಿ ಅಸ್ತಿತ್ವದಲ್ಲಿವೆ, ಆದರೆ ಮೇಲಿನವುಗಳು ಹೆಚ್ಚು ಸಾಮಾನ್ಯವಾಗಿದೆ.
ಮನಿ ಮಾರ್ಕೆಟ್ ಮ್ಯೂಚುಯಲ್ ಫಂಡ್ಗಳಲ್ಲಿ ಏಕೆ ಹೂಡಿಕೆ ಮಾಡಬೇಕು?
- ಹಣದ ಮಾರುಕಟ್ಟೆಯಲ್ಲಿನ ಭದ್ರತೆಗಳು ತುಲನಾತ್ಮಕವಾಗಿ ಕಡಿಮೆ ಅಪಾಯವನ್ನು ಹೊಂದಿರುತ್ತವೆ.
- ಹಣದ ಮಾರುಕಟ್ಟೆ ನಿಧಿಗಳನ್ನು ಎಲ್ಲಾ ಮ್ಯೂಚುಯಲ್ ಫಂಡ್ ಹೂಡಿಕೆಗಳಲ್ಲಿ ಸುರಕ್ಷಿತ ಮತ್ತು ಸುರಕ್ಷಿತವೆಂದು ಪರಿಗಣಿಸಲಾಗುತ್ತದೆ.
- ಹಣದ ಮಾರುಕಟ್ಟೆ ನಿಧಿಗಳನ್ನು ಪರಿಗಣಿಸಿ, ಹಣದ ಮಾರುಕಟ್ಟೆ ಖಾತೆಯಲ್ಲಿ ಹೂಡಿಕೆ ಮಾಡುವುದು ಸುಲಭ.ಹೂಡಿಕೆ ಮೂಲಕಮ್ಯೂಚುಯಲ್ ಫಂಡ್ಗಳು ಹೂಡಿಕೆದಾರರು ತಮ್ಮ ಅನುಕೂಲಕ್ಕೆ ತಕ್ಕಂತೆ ಖಾತೆಯನ್ನು ತೆರೆಯಬಹುದು, ಠೇವಣಿ ಮತ್ತು ಹಿಂಪಡೆಯುವಿಕೆಗಳನ್ನು ಮಾಡಬಹುದು.
- ಹಣದ ಮಾರುಕಟ್ಟೆ ನಿಧಿಗಳನ್ನು ಎಲ್ಲಾ ಮ್ಯೂಚುಯಲ್ ಫಂಡ್ ಹೂಡಿಕೆಗಳಲ್ಲಿ ಕಡಿಮೆ ಬಾಷ್ಪಶೀಲ ವಿಧಗಳಲ್ಲಿ ಒಂದೆಂದು ಪರಿಗಣಿಸಲಾಗುತ್ತದೆ.
- ಹಣದ ಮಾರುಕಟ್ಟೆ ನಿಧಿಗಳ ಕಾರ್ಯಕ್ಷಮತೆಯು ಭಾರತೀಯ ರಿಸರ್ವ್ ಬ್ಯಾಂಕ್ ನಿಗದಿಪಡಿಸಿದ ಬಡ್ಡಿದರಗಳೊಂದಿಗೆ ನಿಕಟ ಸಂಬಂಧ ಹೊಂದಿದೆ.ಸೆಂಟ್ರಲ್ ಬ್ಯಾಂಕ್ ಆಫ್ ಇಂಡಿಯಾ. ಆದ್ದರಿಂದ, ಆರ್ಬಿಐ ಮಾರುಕಟ್ಟೆಯಲ್ಲಿ ದರಗಳನ್ನು ಹೆಚ್ಚಿಸಿದಾಗ, ಇಳುವರಿ ಹೆಚ್ಚಾಗುತ್ತದೆ ಮತ್ತು ಹಣದ ಮಾರುಕಟ್ಟೆ ನಿಧಿಗಳು ಉತ್ತಮ ಆದಾಯವನ್ನು ನೀಡಲು ಸಾಧ್ಯವಾಗುತ್ತದೆ.
ಹಣದ ಮಾರುಕಟ್ಟೆ ಉಪಕರಣಗಳು ಮತ್ತು ಬಾಂಡ್ಗಳು: ವ್ಯತ್ಯಾಸ
ಬಾಂಡ್ಗಳು ಒಂದು ವರ್ಷಕ್ಕಿಂತ ಹೆಚ್ಚು ಅವಧಿಯ ಮುಕ್ತಾಯದ ಅವಧಿಯನ್ನು ಹೊಂದಿದ್ದು, ಇದು ವಾಣಿಜ್ಯ ಪೇಪರ್ಗಳು, ಖಜಾನೆ ಬಿಲ್ಗಳು ಮತ್ತು ಇತರ ಹಣದ ಮಾರುಕಟ್ಟೆ ಸಾಧನಗಳಂತಹ ಇತರ ಸಾಲ ಭದ್ರತೆಗಳಿಂದ ಪ್ರತ್ಯೇಕಿಸುತ್ತದೆ, ಇದು ಸಾಮಾನ್ಯವಾಗಿ ಒಂದು ವರ್ಷಕ್ಕಿಂತ ಕಡಿಮೆ ಅವಧಿಯ ಮುಕ್ತಾಯ ಅವಧಿಯನ್ನು ಹೊಂದಿರುತ್ತದೆ.
ಮನಿ ಮಾರ್ಕೆಟ್ ಎಂದರೇನು?
ಹಣದ ಮಾರುಕಟ್ಟೆಯು ಸಾಮಾನ್ಯವಾಗಿ ಹಣಕಾಸಿನ ಮಾರುಕಟ್ಟೆಯ ಒಂದು ವಿಭಾಗವನ್ನು ಸೂಚಿಸುತ್ತದೆ, ಅಲ್ಲಿ ಸಣ್ಣ ಮೆಚುರಿಟಿಗಳೊಂದಿಗೆ (ಒಂದು ವರ್ಷಕ್ಕಿಂತ ಕಡಿಮೆ) ಮತ್ತು ಹೆಚ್ಚಿನ ಹಣಕಾಸು ಸಾಧನಗಳುದ್ರವ್ಯತೆ ವ್ಯಾಪಾರ ಮಾಡಲಾಗುತ್ತದೆ. ಭಾರತವು ಅತ್ಯಂತ ಸಕ್ರಿಯವಾದ ಹಣದ ಮಾರುಕಟ್ಟೆಯನ್ನು ಹೊಂದಿದೆ, ಅಲ್ಲಿ ಹಲವಾರು ಸಾಧನಗಳನ್ನು ವ್ಯಾಪಾರ ಮಾಡಲಾಗುತ್ತದೆ. ಇಲ್ಲಿ ನೀವು ಮ್ಯೂಚುಯಲ್ ಫಂಡ್ ಕಂಪನಿಗಳು, ಸರ್ಕಾರಿ ಬ್ಯಾಂಕ್ಗಳು ಮತ್ತು ಇತರ ದೊಡ್ಡ ದೇಶೀಯ ಸಂಸ್ಥೆಗಳು ಭಾಗವಹಿಸುತ್ತಿವೆ. ವಾಣಿಜ್ಯ ಪತ್ರಗಳು ಮತ್ತು ಖಜಾನೆ ಬಿಲ್ಗಳಂತಹ ಅಲ್ಪಾವಧಿಯ ಸೆಕ್ಯೂರಿಟಿಗಳ ಖರೀದಿ ಮತ್ತು ಮಾರಾಟಕ್ಕಾಗಿ ಹಣದ ಮಾರುಕಟ್ಟೆಯು ಹಣಕಾಸು ಮಾರುಕಟ್ಟೆಯ ಒಂದು ಅಂಶವಾಗಿದೆ.
ಹಣದ ಮಾರುಕಟ್ಟೆ ದರಗಳು
ಹಣದ ಮಾರುಕಟ್ಟೆ ದರಗಳು ಅಲ್ಪಾವಧಿಯ ಹಣದ ಮಾರುಕಟ್ಟೆ ಉಪಕರಣಗಳು ನೀಡುವ ಬಡ್ಡಿದರಗಳಾಗಿವೆ. ಈ ಉಪಕರಣಗಳು 1 ದಿನದಿಂದ ಒಂದು ವರ್ಷದವರೆಗೆ ಪರಿಪಕ್ವತೆಯನ್ನು ಹೊಂದಿವೆ. ಖಜಾನೆ ಬಿಲ್ಗಳಂತಹ ಅನೇಕ ಸಂಕೀರ್ಣ ಸಾಧನಗಳ ಮೇಲೆ ಹಣದ ಮಾರುಕಟ್ಟೆ ದರಗಳು ಬದಲಾಗುತ್ತವೆ,ಕರೆ ಮಾಡಿ ಹಣ,ವಾಣಿಜ್ಯ ಪತ್ರ (CP), ಠೇವಣಿಗಳ ಪ್ರಮಾಣಪತ್ರಗಳು (CD ಗಳು), ರೆಪೊಗಳು, ಇತ್ಯಾದಿ. ಭಾರತೀಯ ರಿಸರ್ವ್ ಬ್ಯಾಂಕ್ (RBI) ಹೆಚ್ಚಾಗಿ ಹಣದ ಮಾರುಕಟ್ಟೆಗಳ ಮೇಲೆ ಆಡಳಿತ ನಡೆಸುವ ಅಧಿಕಾರವಾಗಿದೆ.
28ನೇ ಫೆಬ್ರವರಿ 2017 ರಂತೆ RBI ಸೈಟ್ನಲ್ಲಿ ನೀಡಲಾದ ವಿವಿಧ ಸಾಧನಗಳ ಹಣದ ಮಾರುಕಟ್ಟೆ ದರಗಳ ಉದಾಹರಣೆಯನ್ನು ಉಲ್ಲೇಖಕ್ಕಾಗಿ ಕೆಳಗೆ ನೀಡಲಾಗಿದೆ.
| ಸಂಪುಟ (ಒಂದು ಕಾಲು) | ತೂಕದ ಸರಾಸರಿ ದರ | ಶ್ರೇಣಿ | |
|---|---|---|---|
| A. ರಾತ್ರಿಯ ವಿಭಾಗ (I+II+III+IV) | 4,00,659.36 | 3.25 | 0.01-5.30 |
| I. ಕಾಲ್ ಮನಿ | 12,671.70 | 3.23 | 1.90-3.50 |
| II. ಟ್ರಿಪಾರ್ಟಿ ರೆಪೋ | 2,79,349.70 | 3.26 | 2.00-3.45 |
| III. ಮಾರುಕಟ್ಟೆ ರೆಪೋ | 1,07,582.96 | 3.25 | 0.01-3.50 |
| IV. ಕಾರ್ಪೊರೇಟ್ ಬಾಂಡ್ನಲ್ಲಿ ರೆಪೊ | 1,055.00 | 3.56 | 3.40-5.30 |
| B. ಅವಧಿಯ ವಿಭಾಗ | |||
| I. ನೋಟಿಸ್ ಹಣ** | 45.00 | 2.97 | 2.65-3.50 |
| II. ಅವಧಿಯ ಹಣ@@ | 311.00 | - | 3.15-3.45 |
| III. ಟ್ರಿಪಾರ್ಟಿ ರೆಪೋ | 1,493.00 | 3.30 | 3.30-3.35 |
| IV. ಮಾರುಕಟ್ಟೆ ರೆಪೋ | 5,969.10 | 3.37 | 0.01-3.60 |
| ಕಾರ್ಪೊರೇಟ್ ಬಾಂಡ್ನಲ್ಲಿ ವಿ. ರೆಪೋ | 0.00 | - | - |
ಮೂಲ: ಮನಿ ಮಾರ್ಕೆಟ್ ಕಾರ್ಯಾಚರಣೆಗಳು, RBI ದಿನಾಂಕ- ದಿನಾಂಕ: 30 ಮಾರ್ಚ್ 2021
ಮ್ಯೂಚುಯಲ್ ಫಂಡ್ ಕಂಪನಿಗಳು ಮನಿ ಮಾರ್ಕೆಟ್ ಫಂಡ್ಗಳನ್ನು ನೀಡುತ್ತಿವೆ
ಮೇಲಿನ ವಿವಿಧ ರೀತಿಯ ಉಪಕರಣಗಳ ಬಗ್ಗೆ ನಾವು ಕಲಿತಂತೆ, ಹಣದ ಮಾರುಕಟ್ಟೆ ನಿಧಿಗಳಲ್ಲಿ ಹೂಡಿಕೆದಾರರು ಹೇಗೆ ಹೂಡಿಕೆ ಮಾಡಬಹುದು ಎಂಬುದನ್ನು ತಿಳಿದುಕೊಳ್ಳುವುದು ಅಷ್ಟೇ ಮುಖ್ಯ. 44 ಇವೆAMC ಗಳು (ಆಸ್ತಿ ಮ್ಯಾನೇಜ್ಮೆಂಟ್ ಕಂಪನಿಗಳು) ಭಾರತದಲ್ಲಿ, ಅವುಗಳಲ್ಲಿ ಹೆಚ್ಚಿನವುನೀಡುತ್ತಿದೆ ಹಣದ ಮಾರುಕಟ್ಟೆ ನಿಧಿಗಳು (ಮುಖ್ಯವಾಗಿದ್ರವ ನಿಧಿಗಳು ಮತ್ತು ಹೂಡಿಕೆದಾರರಿಗೆ ಅಲ್ಟ್ರಾ-ಶಾರ್ಟ್ ಫಂಡ್ಗಳು). ಹೂಡಿಕೆದಾರರು ಬ್ಯಾಂಕ್ಗಳು ಮತ್ತು ಬ್ರೋಕರ್ಗಳಂತಹ ವಿತರಕರ ಮೂಲಕವೂ ಹೂಡಿಕೆ ಮಾಡಬಹುದು. ಹಣದ ಮಾರುಕಟ್ಟೆ ನಿಧಿಗಳಲ್ಲಿ ಹೂಡಿಕೆ ಮಾಡಲು ಒಬ್ಬರು ಆಯಾ ಕಾರ್ಯವಿಧಾನ ಮತ್ತು ಸಂಬಂಧಿತ ಅಪ್ಲಿಕೇಶನ್ಗಳನ್ನು ಅನುಸರಿಸುವ ಅಗತ್ಯವಿದೆ. ಸಾಲದ ಮ್ಯೂಚುಯಲ್ ಫಂಡ್ಗಳ ನಿಯಮಗಳು ಮತ್ತು ಷರತ್ತುಗಳು ಬದಲಾಗಬಹುದು, ಆದ್ದರಿಂದ, ಒಟ್ಟಾರೆ ಜ್ಞಾನವನ್ನು ಪಡೆಯುವುದು ಮತ್ತು ನಂತರ ನಿಮ್ಮ ಅಗತ್ಯಗಳನ್ನು ಪೂರೈಸುವದನ್ನು ಆರಿಸುವುದು ಮುಖ್ಯವಾಗಿದೆ. ಇದಲ್ಲದೆ, ಯಾವುದೇ ಹಣದ ಮಾರುಕಟ್ಟೆ ಮ್ಯೂಚುವಲ್ ಫಂಡ್ಗಳಲ್ಲಿ ಹೂಡಿಕೆ ಮಾಡುವ ಮೊದಲು ಅದರ ಹೂಡಿಕೆಯ ಉದ್ದೇಶಗಳು, ಅಪಾಯಗಳು, ಆದಾಯಗಳು ಮತ್ತು ವೆಚ್ಚಗಳನ್ನು ಎಚ್ಚರಿಕೆಯಿಂದ ಪರಿಗಣಿಸಿ.
ಪರಿಗಣಿಸಬೇಕಾದ ಅಂಶಗಳು
ಭಾರತದಲ್ಲಿ ಹಣದ ಮಾರುಕಟ್ಟೆ ನಿಧಿಗಳಲ್ಲಿ ಹೂಡಿಕೆ ಮಾಡುವ ಮೊದಲು ನೀವು ಪರಿಗಣಿಸಬೇಕಾದ ಕೆಲವು ಪ್ರಮುಖ ಅಂಶಗಳು ಇಲ್ಲಿವೆ:
ಎ. ಅಪಾಯಗಳು ಮತ್ತು ಆದಾಯ
ಹಣದ ಮಾರುಕಟ್ಟೆ ನಿಧಿಗಳುಸಾಲ ನಿಧಿ ಮತ್ತು ಆದ್ದರಿಂದ ಬಡ್ಡಿ ದರದ ಅಪಾಯ ಮತ್ತು ಕ್ರೆಡಿಟ್ ಅಪಾಯದಂತಹ ಸಾಲ ನಿಧಿಗಳಿಗೆ ಅನ್ವಯಿಸುವ ಎಲ್ಲಾ ಅಪಾಯಗಳನ್ನು ಒಯ್ಯಿರಿ. ಹೆಚ್ಚುವರಿಯಾಗಿ, ಫಂಡ್ ಮ್ಯಾನೇಜರ್ ಆದಾಯವನ್ನು ಹೆಚ್ಚಿಸಲು ಸ್ವಲ್ಪ ಹೆಚ್ಚಿನ ಅಪಾಯದ ಅಂಶದೊಂದಿಗೆ ಉಪಕರಣಗಳಲ್ಲಿ ಹೂಡಿಕೆ ಮಾಡಬಹುದು. ಸಾಮಾನ್ಯವಾಗಿ, ಹಣದ ಮಾರುಕಟ್ಟೆ ನಿಧಿಗಳು ಸಾಮಾನ್ಯಕ್ಕಿಂತ ಉತ್ತಮ ಆದಾಯವನ್ನು ನೀಡುತ್ತವೆಉಳಿತಾಯ ಖಾತೆ. ನಿವ್ವಳ ಆಸ್ತಿ ಮೌಲ್ಯ ಅಥವಾಅವು ಅಲ್ಲ ಈ ನಿಧಿಗಳು ಬಡ್ಡಿದರದ ಆಡಳಿತದಲ್ಲಿನ ಬದಲಾವಣೆಯೊಂದಿಗೆ ಬದಲಾಗುತ್ತವೆ.
ಬಿ. ವೆಚ್ಚ ಅನುಪಾತ
ಆದಾಯವು ತುಂಬಾ ಹೆಚ್ಚಿಲ್ಲದ ಕಾರಣ, ವೆಚ್ಚದ ಅನುಪಾತವು ನಿಮ್ಮದನ್ನು ನಿರ್ಧರಿಸುವಲ್ಲಿ ಪ್ರಮುಖ ಪಾತ್ರವನ್ನು ವಹಿಸುತ್ತದೆಗಳಿಕೆ ಹಣದ ಮಾರುಕಟ್ಟೆ ನಿಧಿಯಿಂದ. ನಿಧಿ ನಿರ್ವಹಣಾ ಸೇವೆಗಳಿಗೆ ಫಂಡ್ ಹೌಸ್ ವಿಧಿಸುವ ನಿಧಿಯ ಒಟ್ಟು ಸ್ವತ್ತುಗಳ ಒಂದು ಸಣ್ಣ ಶೇಕಡಾವಾರು ವೆಚ್ಚ ಅನುಪಾತವಾಗಿದೆ.
ತಾತ್ತ್ವಿಕವಾಗಿ, ನಿಮ್ಮ ಆದಾಯವನ್ನು ಗರಿಷ್ಠಗೊಳಿಸಲು ಕಡಿಮೆ ವೆಚ್ಚದ ಅನುಪಾತದೊಂದಿಗೆ ನೀವು ಹಣವನ್ನು ಹುಡುಕಬೇಕು.
ಸಿ. ನಿಮ್ಮ ಹೂಡಿಕೆ ಯೋಜನೆಯ ಪ್ರಕಾರ ಹೂಡಿಕೆ ಮಾಡಿ
ಸಾಮಾನ್ಯವಾಗಿ, ಹಣದ ಮಾರುಕಟ್ಟೆ ನಿಧಿಗಳನ್ನು ಹೂಡಿಕೆದಾರರಿಗೆ 90-365 ದಿನಗಳ ಹೂಡಿಕೆಯ ಹಾರಿಜಾನ್ನೊಂದಿಗೆ ಶಿಫಾರಸು ಮಾಡಲಾಗುತ್ತದೆ. ಈ ಯೋಜನೆಗಳು ನಿಮ್ಮ ಪೋರ್ಟ್ಫೋಲಿಯೊವನ್ನು ವೈವಿಧ್ಯಗೊಳಿಸಲು ಸಹಾಯ ಮಾಡುತ್ತದೆ ಮತ್ತು ದ್ರವ್ಯತೆಯನ್ನು ಕಾಪಾಡಿಕೊಳ್ಳುವಾಗ ಹೆಚ್ಚುವರಿ ಹಣವನ್ನು ಹೂಡಿಕೆ ಮಾಡಲು ಸಹಾಯ ಮಾಡುತ್ತದೆ. ನಿಮ್ಮ ಪ್ರಕಾರ ಹೂಡಿಕೆ ಮಾಡುವುದನ್ನು ಖಚಿತಪಡಿಸಿಕೊಳ್ಳಿಹೂಡಿಕೆ ಯೋಜನೆ.
ಡಿ. ತೆರಿಗೆ
ಮನಿ ಮಾರ್ಕೆಟ್ ಫಂಡ್ಗಳ ಸಂದರ್ಭದಲ್ಲಿ, ತೆರಿಗೆ ನಿಯಮಗಳು ಈ ಕೆಳಗಿನಂತಿವೆ:
ಕ್ಯಾಪಿಟಲ್ ಗೇನ್ಸ್ ತೆರಿಗೆ
ನೀವು ಮೂರು ವರ್ಷಗಳ ಅವಧಿಯವರೆಗೆ ಯೋಜನೆಯ ಘಟಕಗಳನ್ನು ಹೊಂದಿದ್ದರೆ, ನಂತರ ದಿಬಂಡವಾಳದಲ್ಲಿ ಲಾಭ ನೀವು ಗಳಿಸಿದ ಅಲ್ಪಾವಧಿಯ ಬಂಡವಾಳ ಲಾಭಗಳು ಅಥವಾ STCG ಎಂದು ಕರೆಯಲಾಗುತ್ತದೆ. STCG ಅನ್ನು ನಿಮಗೆ ಸೇರಿಸಲಾಗಿದೆತೆರಿಗೆ ವಿಧಿಸಬಹುದಾದ ಆದಾಯ ಮತ್ತು ಅನ್ವಯವಾಗುವ ಪ್ರಕಾರ ತೆರಿಗೆ ವಿಧಿಸಲಾಗುತ್ತದೆಆದಾಯ ತೆರಿಗೆ ಚಪ್ಪಡಿ
ನೀವು ಮೂರು ವರ್ಷಗಳಿಗಿಂತ ಹೆಚ್ಚು ಕಾಲ ಯೋಜನೆಯ ಘಟಕಗಳನ್ನು ಹೊಂದಿದ್ದರೆ, ನಂತರ ನೀವು ಗಳಿಸಿದ ಬಂಡವಾಳ ಲಾಭವನ್ನು ದೀರ್ಘಾವಧಿಯ ಬಂಡವಾಳ ಲಾಭಗಳು ಅಥವಾ LTCG ಎಂದು ಕರೆಯಲಾಗುತ್ತದೆ. ಇದು ಸೂಚ್ಯಂಕ ಪ್ರಯೋಜನಗಳೊಂದಿಗೆ 20% ನಲ್ಲಿ ತೆರಿಗೆ ವಿಧಿಸಲಾಗುತ್ತದೆ.
FY 22 - 23 ರಲ್ಲಿ ಹೂಡಿಕೆ ಮಾಡಲು ಉತ್ತಮ ಹಣ ಮಾರುಕಟ್ಟೆ ನಿಧಿಗಳು
ಭಾರತದಲ್ಲಿನ ಕೆಲವು ಉತ್ತಮ ಹಣ ಮಾರುಕಟ್ಟೆ ನಿಧಿಗಳು ಈ ಕೆಳಗಿನಂತಿವೆ-Fund NAV Net Assets (Cr) 3 MO (%) 6 MO (%) 1 YR (%) 3 YR (%) 2025 (%) Debt Yield (YTM) Mod. Duration Eff. Maturity Franklin India Savings Fund Growth ₹54.4296
↑ 0.01 ₹3,887 1.5 3.1 6.2 7.2 7.4 6.95% 3M 4D 4M 10D UTI Money Market Fund Growth ₹3,345.7
↑ 0.64 ₹16,039 1.5 3.1 6.2 7.2 7.5 6.98% 4M 16D 4M 16D Aditya Birla Sun Life Money Manager Fund Growth ₹401.272
↑ 0.08 ₹26,943 1.5 3.1 6.2 7.2 7.4 7.07% 4M 17D 4M 17D Bandhan Money Manager Fund Growth ₹43.689
↑ 0.01 ₹13,129 1.4 3 6.2 6.9 7.3 6.79% 4M 10D 4M 10D ICICI Prudential Money Market Fund Growth ₹411.457
↑ 0.08 ₹31,010 1.5 3.1 6.2 7.2 7.4 6.93% 4M 1D 4M 10D Note: Returns up to 1 year are on absolute basis & more than 1 year are on CAGR basis. as on 23 Oct 26 Research Highlights & Commentary of 5 Funds showcased
Commentary Franklin India Savings Fund UTI Money Market Fund Aditya Birla Sun Life Money Manager Fund Bandhan Money Manager Fund ICICI Prudential Money Market Fund Point 1 Bottom quartile AUM (₹3,887 Cr). Lower mid AUM (₹16,039 Cr). Upper mid AUM (₹26,943 Cr). Bottom quartile AUM (₹13,129 Cr). Highest AUM (₹31,010 Cr). Point 2 Oldest track record among peers (24 yrs). Established history (17+ yrs). Established history (21+ yrs). Established history (23+ yrs). Established history (20+ yrs). Point 3 Rating: 3★ (bottom quartile). Rating: 4★ (upper mid). Top rated. Rating: 3★ (bottom quartile). Rating: 4★ (lower mid). Point 4 Risk profile: Moderately Low. Risk profile: Low. Risk profile: Low. Risk profile: Moderately Low. Risk profile: Low. Point 5 1Y return: 6.24% (top quartile). 1Y return: 6.20% (upper mid). 1Y return: 6.16% (lower mid). 1Y return: 6.15% (bottom quartile). 1Y return: 6.15% (bottom quartile). Point 6 1M return: 0.31% (top quartile). 1M return: 0.25% (bottom quartile). 1M return: 0.24% (bottom quartile). 1M return: 0.26% (lower mid). 1M return: 0.26% (upper mid). Point 7 Sharpe: 1.01 (top quartile). Sharpe: 1.00 (lower mid). Sharpe: 0.88 (bottom quartile). Sharpe: 1.01 (upper mid). Sharpe: 0.91 (bottom quartile). Point 8 Information ratio: 0.00 (top quartile). Information ratio: 0.00 (upper mid). Information ratio: 0.00 (lower mid). Information ratio: 0.00 (bottom quartile). Information ratio: 0.00 (bottom quartile). Point 9 Yield to maturity (debt): 6.95% (lower mid). Yield to maturity (debt): 6.98% (upper mid). Yield to maturity (debt): 7.07% (top quartile). Yield to maturity (debt): 6.79% (bottom quartile). Yield to maturity (debt): 6.93% (bottom quartile). Point 10 Modified duration: 0.26 yrs (top quartile). Modified duration: 0.38 yrs (bottom quartile). Modified duration: 0.38 yrs (bottom quartile). Modified duration: 0.36 yrs (lower mid). Modified duration: 0.34 yrs (upper mid). Franklin India Savings Fund
UTI Money Market Fund
Aditya Birla Sun Life Money Manager Fund
Bandhan Money Manager Fund
ICICI Prudential Money Market Fund
(Erstwhile Franklin India Savings Plus Fund Retail Option) Aims to provide income consistent with the prudent risk from a portfolio comprising substantially of floating rate debt instruments, fixed rate debt instruments swapped for floating rate returns, and also fixed rate instruments and money market instruments. Below is the key information for Franklin India Savings Fund Returns up to 1 year are on To provide highest possible current income consistent with preservation of capital and providing liquidity from investing in a diversified portfolio of short term money market securities. Research Highlights for UTI Money Market Fund Below is the key information for UTI Money Market Fund Returns up to 1 year are on (Erstwhile Aditya Birla Sun Life Floating Rate Fund - Short Term) The primary objective of the schemes is to generate regular income through investment in a portfolio comprising substantially of floating rate debt / money market instruments. The schemes may invest a portion of its net assets in fixed rate debt securities and money market instruments. Research Highlights for Aditya Birla Sun Life Money Manager Fund Below is the key information for Aditya Birla Sun Life Money Manager Fund Returns up to 1 year are on (Erstwhile IDFC Money Manager Fund - Treasury Plan) Seek to generate stable returns with a low risk strategy by creating a portfolio that is substantially invested in good quality floating rate debt or money market
instruments, fixed rate debt or money market instruments swapped for floating
returns and fixed rate debt and money market instruments. However, there can
be no assurance that the investment objectives of the scheme will be realized. Research Highlights for Bandhan Money Manager Fund Below is the key information for Bandhan Money Manager Fund Returns up to 1 year are on The objective of the Plan will be to seek to provide reasonable returns, commensurate with low risk while providing a high level of liquidity, through investments made primarily in money market and debt securities. Research Highlights for ICICI Prudential Money Market Fund Below is the key information for ICICI Prudential Money Market Fund Returns up to 1 year are on 1. Franklin India Savings Fund
Franklin India Savings Fund
Growth Launch Date 11 Feb 02 NAV (23 Oct 26) ₹54.4296 ↑ 0.01 (0.02 %) Net Assets (Cr) ₹3,887 on 30 Sep 26 Category Debt - Money Market AMC Franklin Templeton Asst Mgmt(IND)Pvt Ltd Rating ☆☆☆ Risk Moderately Low Expense Ratio 0.3 Sharpe Ratio 1.01 Information Ratio 0 Alpha Ratio 0 Min Investment 10,000 Min SIP Investment 500 Exit Load NIL Yield to Maturity 6.95% Effective Maturity 4 Months 10 Days Modified Duration 3 Months 4 Days Growth of 10,000 investment over the years.
Date Value 30 Sep 21 ₹10,000 30 Sep 22 ₹10,369 30 Sep 23 ₹11,106 30 Sep 24 ₹11,948 30 Sep 25 ₹12,874 30 Sep 26 ₹13,696 Returns for Franklin India Savings Fund
absolute basis & more than 1 year are on CAGR (Compound Annual Growth Rate) basis. as on 23 Oct 26 Duration Returns 1 Month 0.3% 3 Month 1.5% 6 Month 3.1% 1 Year 6.2% 3 Year 7.2% 5 Year 6.5% 10 Year 15 Year Since launch 7.1% Historical performance (Yearly) on absolute basis
Year Returns 2025 7.4% 2024 7.7% 2023 7.3% 2022 4.4% 2021 3.6% 2020 6% 2019 8.5% 2018 7.5% 2017 7.2% 2016 8.1% Fund Manager information for Franklin India Savings Fund
Name Since Tenure Rahul Goswami 6 Oct 23 2.91 Yr. Rohan Maru 10 Oct 24 1.89 Yr. Chandni Gupta 30 Apr 24 2.34 Yr. Data below for Franklin India Savings Fund as on 30 Sep 26
Asset Allocation
Asset Class Value Cash 87.6% Debt 12.12% Other 0.29% Debt Sector Allocation
Sector Value Cash Equivalent 45.49% Corporate 29.87% Government 24.35% Credit Quality
Rating Value AAA 100% Top Securities Holdings / Portfolio
Name Holding Value Quantity 7.67% Uttarpradesh Sdl 2027
Sovereign Bonds | -9% ₹360 Cr 34,500,000
↓ -3,000,000 Canara Bank
Domestic Bonds | -2% ₹97 Cr 2,000
↑ 2,000 Corporate Debt Market Development Fund Class A2
- | -0% ₹11 Cr 9,359 7.78% Telangana Sdl 2027
Sovereign Bonds | -0% ₹10 Cr 1,000,000 6.88% Westbengal Sdl 2026
Sovereign Bonds | -0% ₹5 Cr 500,000 7.14% Punjab SDL 2027
Sovereign Bonds | -0% ₹5 Cr 500,000 7.88% Punjab SDL 2027
Sovereign Bonds | -0% ₹5 Cr 500,000 Bajaj Housing Finance Limited
Commercial Paper | -7% ₹291 Cr 6,000 Piramal Finance Limited
Commercial Paper | -7% ₹263 Cr 5,300 HDFC Bank Ltd
Certificate of Deposit | -6% ₹243 Cr 5,000 2. UTI Money Market Fund
UTI Money Market Fund
Growth Launch Date 13 Jul 09 NAV (23 Oct 26) ₹3,345.7 ↑ 0.64 (0.02 %) Net Assets (Cr) ₹16,039 on 30 Sep 26 Category Debt - Money Market AMC UTI Asset Management Company Ltd Rating ☆☆☆☆ Risk Low Expense Ratio 0.25 Sharpe Ratio 1 Information Ratio 0 Alpha Ratio 0 Min Investment 10,000 Min SIP Investment 500 Exit Load NIL Yield to Maturity 6.98% Effective Maturity 4 Months 16 Days Modified Duration 4 Months 16 Days Growth of 10,000 investment over the years.
Date Value 30 Sep 21 ₹10,000 30 Sep 22 ₹10,414 30 Sep 23 ₹11,178 30 Sep 24 ₹12,035 30 Sep 25 ₹12,973 30 Sep 26 ₹13,806 Returns for UTI Money Market Fund
absolute basis & more than 1 year are on CAGR (Compound Annual Growth Rate) basis. as on 23 Oct 26 Duration Returns 1 Month 0.3% 3 Month 1.5% 6 Month 3.1% 1 Year 6.2% 3 Year 7.2% 5 Year 6.7% 10 Year 15 Year Since launch 7.2% Historical performance (Yearly) on absolute basis
Year Returns 2025 7.5% 2024 7.7% 2023 7.4% 2022 4.9% 2021 3.7% 2020 6% 2019 8% 2018 7.8% 2017 6.7% 2016 7.7% Fund Manager information for UTI Money Market Fund
Name Since Tenure Anurag Mittal 1 Dec 21 4.75 Yr. Amit Sharma 7 Jul 17 9.16 Yr. Data below for UTI Money Market Fund as on 30 Sep 26
Asset Allocation
Asset Class Value Cash 86.51% Debt 13.16% Other 0.33% Debt Sector Allocation
Sector Value Corporate 45.42% Cash Equivalent 36.67% Government 17.58% Credit Quality
Rating Value AAA 100% Top Securities Holdings / Portfolio
Name Holding Value Quantity India (Republic of)
- | -3% ₹489 Cr 5,000,000,000 India (Republic of)
- | -2% ₹342 Cr 3,500,000,000 UCO Bank
Domestic Bonds | -1% ₹237 Cr 2,500,000,000 Indian Overseas Bank
Debentures | -1% ₹194 Cr 2,000,000,000 Axis Bank Ltd.
Debentures | -1% ₹194 Cr 2,000,000,000 Punjab & Sind Bank
Debentures | -1% ₹169 Cr 1,750,000,000 AU Small Finance Bank Ltd.
Debentures | -1% ₹140 Cr 1,500,000,000 HDFC Bank Ltd.
Debentures | -1% ₹97 Cr 1,000,000,000 Ujjivan Small Finance Bank Limited
Debentures | -1% ₹97 Cr 1,000,000,000 Axis Bank Ltd.
Debentures | -1% ₹97 Cr 1,000,000,000 3. Aditya Birla Sun Life Money Manager Fund
Aditya Birla Sun Life Money Manager Fund
Growth Launch Date 13 Oct 05 NAV (23 Oct 26) ₹401.272 ↑ 0.08 (0.02 %) Net Assets (Cr) ₹26,943 on 30 Sep 26 Category Debt - Money Market AMC Birla Sun Life Asset Management Co Ltd Rating ☆☆☆☆☆ Risk Low Expense Ratio 0.36 Sharpe Ratio 0.88 Information Ratio 0 Alpha Ratio 0 Min Investment 1,000 Min SIP Investment 1,000 Exit Load NIL Yield to Maturity 7.07% Effective Maturity 4 Months 17 Days Modified Duration 4 Months 17 Days Growth of 10,000 investment over the years.
Date Value 30 Sep 21 ₹10,000 30 Sep 22 ₹10,406 30 Sep 23 ₹11,170 30 Sep 24 ₹12,033 30 Sep 25 ₹12,961 30 Sep 26 ₹13,790 Returns for Aditya Birla Sun Life Money Manager Fund
absolute basis & more than 1 year are on CAGR (Compound Annual Growth Rate) basis. as on 23 Oct 26 Duration Returns 1 Month 0.2% 3 Month 1.5% 6 Month 3.1% 1 Year 6.2% 3 Year 7.2% 5 Year 6.6% 10 Year 15 Year Since launch 6.8% Historical performance (Yearly) on absolute basis
Year Returns 2025 7.4% 2024 7.8% 2023 7.4% 2022 4.8% 2021 3.8% 2020 6.6% 2019 8% 2018 7.9% 2017 6.8% 2016 7.7% Fund Manager information for Aditya Birla Sun Life Money Manager Fund
Name Since Tenure Kaustubh Gupta 15 Jul 11 15.14 Yr. Anuj Jain 22 Mar 21 5.45 Yr. Mohit Sharma 1 Apr 17 9.42 Yr. Data below for Aditya Birla Sun Life Money Manager Fund as on 30 Sep 26
Asset Allocation
Asset Class Value Cash 70.3% Debt 29.7% Debt Sector Allocation
Sector Value Corporate 57.75% Cash Equivalent 27.38% Government 14.86% Credit Quality
Rating Value AAA 100% Top Securities Holdings / Portfolio
Name Holding Value Quantity Indusind Bank Ltd.
Debentures | -5% ₹1,414 Cr 29,000 The Jammu And Kashmir Bank Limited
Debentures | -3% ₹969 Cr 20,000 Axis Bank Ltd.
Debentures | -3% ₹935 Cr 19,000 Federal Bank Ltd.
Debentures | -3% ₹923 Cr 19,000 Gujarat State Development Loans
Sovereign Bonds | -3% ₹796 Cr 79,327,600 India (Republic of)
- | -2% ₹498 Cr 50,000,000 Karur Vysya Bank Ltd.
Debentures | -2% ₹485 Cr 10,000 The Jammu And Kashmir Bank Limited
Debentures | -2% ₹484 Cr 10,000 Tbill
Sovereign Bonds | -1% ₹399 Cr 40,000,000 India (Republic of)
- | -1% ₹347 Cr 35,000,000
↑ 35,000,000 4. Bandhan Money Manager Fund
Bandhan Money Manager Fund
Growth Launch Date 18 Feb 03 NAV (23 Oct 26) ₹43.689 ↑ 0.01 (0.02 %) Net Assets (Cr) ₹13,129 on 30 Sep 26 Category Debt - Money Market AMC IDFC Asset Management Company Limited Rating ☆☆☆ Risk Moderately Low Expense Ratio 0.35 Sharpe Ratio 1.01 Information Ratio 0 Alpha Ratio 0 Min Investment 100 Min SIP Investment 1,000 Exit Load NIL Yield to Maturity 6.79% Effective Maturity 4 Months 10 Days Modified Duration 4 Months 10 Days Growth of 10,000 investment over the years.
Date Value 30 Sep 21 ₹10,000 30 Sep 22 ₹10,330 30 Sep 23 ₹11,005 30 Sep 24 ₹11,773 30 Sep 25 ₹12,669 30 Sep 26 ₹13,475 Returns for Bandhan Money Manager Fund
absolute basis & more than 1 year are on CAGR (Compound Annual Growth Rate) basis. as on 23 Oct 26 Duration Returns 1 Month 0.3% 3 Month 1.4% 6 Month 3% 1 Year 6.2% 3 Year 6.9% 5 Year 6.1% 10 Year 15 Year Since launch 6.4% Historical performance (Yearly) on absolute basis
Year Returns 2025 7.3% 2024 7.2% 2023 6.7% 2022 4% 2021 2.9% 2020 5% 2019 6.7% 2018 6.2% 2017 6% 2016 8.1% Fund Manager information for Bandhan Money Manager Fund
Name Since Tenure Gautam Kaul 1 Dec 21 4.75 Yr. Brijesh Shah 12 Jul 21 5.14 Yr. Data below for Bandhan Money Manager Fund as on 30 Sep 26
Asset Allocation
Asset Class Value Cash 80.38% Debt 19.33% Other 0.29% Debt Sector Allocation
Sector Value Corporate 44.97% Cash Equivalent 34.68% Government 20.06% Credit Quality
Rating Value AAA 100% Top Securities Holdings / Portfolio
Name Holding Value Quantity India (Republic of)
- | -7% ₹903 Cr 91,500,000
↓ -2,500,000 HDFC Bank Ltd.
Debentures | -4% ₹535 Cr 55,000,000 National Bank for Agriculture and Rural Development
Domestic Bonds | -2% ₹217 Cr 22,500,000 ICICI Bank Ltd.
Debentures | -1% ₹193 Cr 20,000,000 Axis Bank Ltd.
Debentures | -1% ₹146 Cr 15,000,000 5.74% Govt Stock 2026
Sovereign Bonds | -1% ₹119 Cr 11,901,500 7.78% Bihar Sdl 2027
Sovereign Bonds | -1% ₹110 Cr 10,900,000 7.08% Karnataka Sdl 2026
Sovereign Bonds | -1% ₹105 Cr 10,500,000 Axis Bank Ltd.
Debentures | -1% ₹97 Cr 10,000,000 Gs12dec2026c
Sovereign Bonds | -1% ₹92 Cr 9,367,500
↑ 9,367,500 5. ICICI Prudential Money Market Fund
ICICI Prudential Money Market Fund
Growth Launch Date 9 Mar 06 NAV (23 Oct 26) ₹411.457 ↑ 0.08 (0.02 %) Net Assets (Cr) ₹31,010 on 30 Sep 26 Category Debt - Money Market AMC ICICI Prudential Asset Management Company Limited Rating ☆☆☆☆ Risk Low Expense Ratio 0.34 Sharpe Ratio 0.91 Information Ratio 0 Alpha Ratio 0 Min Investment 500 Min SIP Investment 100 Exit Load NIL Yield to Maturity 6.93% Effective Maturity 4 Months 10 Days Modified Duration 4 Months 1 Day Growth of 10,000 investment over the years.
Date Value 30 Sep 21 ₹10,000 30 Sep 22 ₹10,396 30 Sep 23 ₹11,152 30 Sep 24 ₹12,006 30 Sep 25 ₹12,935 30 Sep 26 ₹13,757 Returns for ICICI Prudential Money Market Fund
absolute basis & more than 1 year are on CAGR (Compound Annual Growth Rate) basis. as on 23 Oct 26 Duration Returns 1 Month 0.3% 3 Month 1.5% 6 Month 3.1% 1 Year 6.2% 3 Year 7.2% 5 Year 6.6% 10 Year 15 Year Since launch 7.1% Historical performance (Yearly) on absolute basis
Year Returns 2025 7.4% 2024 7.7% 2023 7.4% 2022 4.7% 2021 3.7% 2020 6.2% 2019 7.9% 2018 7.7% 2017 6.7% 2016 7.7% Fund Manager information for ICICI Prudential Money Market Fund
Name Since Tenure Manish Banthia 12 Jun 23 3.22 Yr. Nikhil Kabra 3 Aug 16 10.08 Yr. Data below for ICICI Prudential Money Market Fund as on 30 Sep 26
Asset Allocation
Asset Class Value Cash 88.15% Debt 11.57% Other 0.28% Debt Sector Allocation
Sector Value Corporate 48.08% Cash Equivalent 27.65% Government 23.99% Credit Quality
Rating Value AAA 100% Top Securities Holdings / Portfolio
Name Holding Value Quantity India (Republic of)
- | -4% ₹1,234 Cr 125,000,000 India (Republic of)
- | -2% ₹780 Cr 78,500,000
↓ -10,000,000 Bank of India Ltd.
Debentures | -1% ₹437 Cr 9,000 India (Republic of)
- | -1% ₹394 Cr 40,000,000 National Bank for Agriculture and Rural Development
Domestic Bonds | -1% ₹387 Cr 8,000
↓ -2,000 India (Republic of)
- | -1% ₹372 Cr 37,993,100 India (Republic of)
- | -1% ₹337 Cr 34,000,000 India (Republic of)
- | -1% ₹309 Cr 31,500,000
↓ -10,000,000 India (Republic of)
- | -1% ₹248 Cr 25,000,000 India (Republic of)
- | -1% ₹248 Cr 25,000,000
ತೀರ್ಮಾನ
ನಾವು ಹಣದ ಮಾರುಕಟ್ಟೆ ಸಾಧನಗಳ ಬಗ್ಗೆ ಕಲಿತಿರುವಾಗ ಸಾಲ ಮ್ಯೂಚುಯಲ್ ಫಂಡ್ಗಳು, ಅವುಗಳ ಪ್ರಕಾರಗಳು ಮತ್ತು ವರ್ಗೀಕರಣಗಳ ಬಗ್ಗೆ ತಿಳಿದುಕೊಳ್ಳುವುದು ಸಹ ಮುಖ್ಯವಾಗಿದೆ. ಒಳ್ಳೆಯದು, ಸಾಲ ಮ್ಯೂಚುಯಲ್ ಫಂಡ್ಗಳನ್ನು ಲಿಕ್ವಿಡ್ ಫಂಡ್ಗಳು, ಅಲ್ಟ್ರಾದಂತಹ ಸಾಮಾನ್ಯ ವಿಶಾಲ ವರ್ಗಗಳಾಗಿ ವರ್ಗೀಕರಿಸಲಾಗಿದೆಅಲ್ಪಾವಧಿ ನಿಧಿಗಳು, ಅಲ್ಪಾವಧಿಯ ನಿಧಿಗಳು, ದೀರ್ಘಾವಧಿಯ ಆದಾಯ ನಿಧಿಗಳು ಮತ್ತುಗಿಲ್ಟ್ ನಿಧಿಗಳು.
ಆದಾಗ್ಯೂ, ಹಣದ ಮಾರುಕಟ್ಟೆ ನಿಧಿಗಳಲ್ಲಿ ಹೂಡಿಕೆ ಮಾಡಲು, ಪರಿಸ್ಥಿತಿಯನ್ನು ಅರ್ಥಮಾಡಿಕೊಳ್ಳುವುದು ಬಹಳ ಮುಖ್ಯಆರ್ಥಿಕತೆ, ಬಡ್ಡಿದರಗಳ ನಿರ್ದೇಶನ, ಮತ್ತು ಕಾರ್ಪೊರೇಟ್ ಸಾಲದಲ್ಲಿನ ಇಳುವರಿಗಳ ಚಲನೆಯ ನಿರೀಕ್ಷಿತ ನಿರ್ದೇಶನ ಮತ್ತು ಹೂಡಿಕೆ ಮಾಡುವಾಗ ಸರ್ಕಾರಿ ಸಾಲ.
ಇಲ್ಲಿ ಒದಗಿಸಲಾದ ಮಾಹಿತಿಯು ನಿಖರವಾಗಿದೆ ಎಂದು ಖಚಿತಪಡಿಸಿಕೊಳ್ಳಲು ಎಲ್ಲಾ ಪ್ರಯತ್ನಗಳನ್ನು ಮಾಡಲಾಗಿದೆ. ಆದಾಗ್ಯೂ, ಡೇಟಾದ ನಿಖರತೆಯ ಬಗ್ಗೆ ಯಾವುದೇ ಗ್ಯಾರಂಟಿಗಳನ್ನು ನೀಡಲಾಗುವುದಿಲ್ಲ. ಯಾವುದೇ ಹೂಡಿಕೆ ಮಾಡುವ ಮೊದಲು ದಯವಿಟ್ಟು ಸ್ಕೀಮ್ ಮಾಹಿತಿ ದಾಖಲೆಯೊಂದಿಗೆ ಪರಿಶೀಲಿಸಿ.







AMFI Registration No. 112358 | CIN: U74999MH2016PTC282153
Shepard Technologies Pvt. Ltd. (with ARN code 112358) makes no warranties or representations, express or implied, on products offered through the platform. It accepts no liability for any damages or losses, however caused, in connection with the use of, or on the reliance of its product or related services. Terms and conditions of the website are applicable.
©2026 Shepard Technologies Private Limited. All Rights Reserved
Research Highlights for Franklin India Savings Fund