FD കാൽക്കുലേറ്റർ - ഫിക്സഡ് ഡെപ്പോസിറ്റ് കാൽക്കുലേറ്റർ
നിക്ഷേപകരെ സഹായിക്കുന്ന ദീർഘകാല നിക്ഷേപ ഉപകരണമാണ് ഫിക്സഡ് ഡിപ്പോസിറ്റുകൾപണം ലാഭിക്കുക ദീർഘകാലത്തേക്ക്. നിക്ഷേപകർക്ക് ഒരു നിശ്ചിത കാലാവധി തിരഞ്ഞെടുക്കാം, അതിനായി നിക്ഷേപം സൂക്ഷിക്കുംബാങ്ക്. പൊതുവായി,FD സേവിംഗ്സ് അക്കൗണ്ടുകളെ അപേക്ഷിച്ച് ഉയർന്ന പലിശനിരക്ക് വാഗ്ദാനം ചെയ്യുന്നതിനാൽ ദീർഘകാല സമ്പത്ത് സൃഷ്ടിക്കാൻ ആഗ്രഹിക്കുന്നവർക്ക് നിക്ഷേപം നല്ലതാണ്.
എങ്ങനെയാണ് FD പലിശ കണക്കാക്കുന്നത്?
മിക്ക ബാങ്കുകളിലും FD യുടെ പലിശ ത്രൈമാസികമായി കൂട്ടുന്നു. ഇതിനുള്ള ഫോർമുല ഇതാണ്:
A = P * (1+ r/n) ^ n*t , എവിടെ

- ഐ = എ - പി
- എ = മെച്യൂരിറ്റി മൂല്യം
- പി = പ്രധാന തുക
- ആർ = പലിശ നിരക്ക്
- ടി = വർഷങ്ങളുടെ എണ്ണം
- എൻ = സംയുക്ത പലിശ ആവൃത്തി
- ഐ = പലിശ സമ്പാദിച്ച തുക
FD യുടെ പ്രയോജനങ്ങൾ
- FD ആയി ഉപയോഗിക്കാംകൊളാറ്ററൽ വായ്പ എടുക്കുന്നതിന്. നിങ്ങളുടെ FD തുകയിൽ നിങ്ങൾക്ക് 80-90% വരെ ലോണുകൾ എടുക്കാം
- കൂടുതൽ സ്ഥിര നിക്ഷേപത്തിനായി കാലാവധി പൂർത്തിയാകുമ്പോൾ തുക കൈമാറാൻ നിക്ഷേപകന് തിരഞ്ഞെടുക്കാം.
- ഒരു തവണ മാത്രമേ പണം നിക്ഷേപിക്കാൻ കഴിയൂ. നിക്ഷേപിച്ചുകഴിഞ്ഞാൽ, അക്കൗണ്ടിൽ നിന്ന് പണം പിൻവലിച്ചാൽ പിഴ ഈടാക്കും.
- FD സ്കീമുകൾ മിച്ച ഫണ്ടുള്ളവർക്കും അതിൽ നിന്ന് പണം സമ്പാദിക്കാൻ ആഗ്രഹിക്കുന്നവർക്കും നല്ലൊരു നിക്ഷേപ ടൂളാണ്.
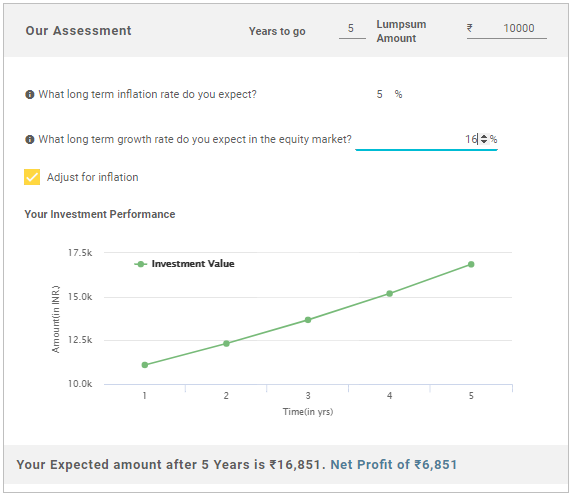
Investment Amount:₹100,000 Interest Earned:₹28,930.22 Maturity Amount: ₹128,930.22ഫിക്സഡ് ഡിപ്പോസിറ്റ് (എഫ്ഡി) കാൽക്കുലേറ്റർ
Talk to our investment specialist
FD-യിലെ നികുതി ആനുകൂല്യങ്ങൾ
മറ്റ് വ്യക്തിഗത നികുതി ലാഭിക്കൽ, നിക്ഷേപ ഉപകരണങ്ങൾ എന്നിവയ്ക്ക് സമാനമായി, സ്ഥിര നിക്ഷേപ പദ്ധതികളും ആകർഷിക്കുന്നുനികുതികൾ. മൊത്തം പലിശ 1000 രൂപയിൽ കൂടുതലാണെങ്കിൽ, FD-യിൽ നിന്ന് ലഭിക്കുന്ന റിട്ടേണുകളിൽ 10% TDS കുറയ്ക്കും. 10,000 ഒരു സാമ്പത്തിക വർഷത്തിൽ.
ഇതുമായി താരതമ്യം ചെയ്യാംഎസ്.ഐ.പി സ്കീമും SIP-കൾ ദീർഘകാലത്തേക്ക് കൂടുതൽ പ്രയോജനകരമാണെന്ന് നിങ്ങൾക്ക് കാണാൻ കഴിയും. ഇക്വിറ്റിയിൽ നിന്നുള്ള ദീർഘകാല നേട്ടങ്ങൾ നികുതി രഹിതമായതിനാൽ, നിക്ഷേപിക്കുന്ന ഏതൊരു എസ്ഐപിയുംELSS (ഇക്വിറ്റി ലിങ്ക്ഡ്മ്യൂച്വൽ ഫണ്ടുകൾ) ഒരു വർഷത്തിനു ശേഷം നികുതി രഹിതവുമാണ്.
*കഴിഞ്ഞ 1 വർഷത്തെ പ്രകടനത്തെയും ഫണ്ടിന്റെ പ്രായം > 1 വർഷത്തെയും അടിസ്ഥാനമാക്കിയുള്ള ഫണ്ടിന്റെ ലിസ്റ്റ് ചുവടെയുണ്ട്.
Fund NAV Net Assets (Cr) Min SIP Investment 3 MO (%) 6 MO (%) 1 YR (%) 3 YR (%) 5 YR (%) 2024 (%) DSP World Gold Fund Growth ₹62.6234
↑ 2.23 ₹1,975 500 39.2 84.2 156.2 58.2 29.3 167.1 DSP World Mining Fund Growth ₹32.0424
↑ 1.32 ₹181 500 40.2 69.1 93.9 23.5 19 79 DSP World Energy Fund Growth ₹27.0917
↑ 0.40 ₹103 500 22.1 29.7 55.4 15.7 12.8 39.2 Edelweiss Emerging Markets Opportunities Equity Off-shore Fund Growth ₹23.9895
↓ -0.33 ₹191 1,000 14 31.3 51.7 18.6 4.6 41.1 Kotak Global Emerging Market Fund Growth ₹34.511
↑ 0.03 ₹539 1,000 17.9 28.3 46.2 20.1 6.7 39.1 Note: Returns up to 1 year are on absolute basis & more than 1 year are on CAGR basis. as on 18 Feb 26 Research Highlights & Commentary of 5 Funds showcased
Commentary DSP World Gold Fund DSP World Mining Fund DSP World Energy Fund Edelweiss Emerging Markets Opportunities Equity Off-shore Fund Kotak Global Emerging Market Fund Point 1 Highest AUM (₹1,975 Cr). Bottom quartile AUM (₹181 Cr). Bottom quartile AUM (₹103 Cr). Lower mid AUM (₹191 Cr). Upper mid AUM (₹539 Cr). Point 2 Oldest track record among peers (18 yrs). Established history (16+ yrs). Established history (16+ yrs). Established history (11+ yrs). Established history (18+ yrs). Point 3 Top rated. Rating: 3★ (upper mid). Rating: 2★ (bottom quartile). Rating: 3★ (lower mid). Rating: 3★ (bottom quartile). Point 4 Risk profile: High. Risk profile: High. Risk profile: High. Risk profile: High. Risk profile: High. Point 5 5Y return: 29.25% (top quartile). 5Y return: 19.05% (upper mid). 5Y return: 12.77% (lower mid). 5Y return: 4.60% (bottom quartile). 5Y return: 6.71% (bottom quartile). Point 6 3Y return: 58.17% (top quartile). 3Y return: 23.48% (upper mid). 3Y return: 15.68% (bottom quartile). 3Y return: 18.65% (bottom quartile). 3Y return: 20.08% (lower mid). Point 7 1Y return: 156.17% (top quartile). 1Y return: 93.87% (upper mid). 1Y return: 55.41% (lower mid). 1Y return: 51.73% (bottom quartile). 1Y return: 46.15% (bottom quartile). Point 8 Alpha: 2.12 (top quartile). Alpha: 0.00 (upper mid). Alpha: 0.00 (lower mid). Alpha: -0.75 (bottom quartile). Alpha: -1.44 (bottom quartile). Point 9 Sharpe: 3.41 (top quartile). Sharpe: 3.17 (upper mid). Sharpe: 1.88 (bottom quartile). Sharpe: 2.68 (lower mid). Sharpe: 2.63 (bottom quartile). Point 10 Information ratio: -0.47 (lower mid). Information ratio: 0.00 (top quartile). Information ratio: 0.00 (upper mid). Information ratio: -0.84 (bottom quartile). Information ratio: -0.59 (bottom quartile). DSP World Gold Fund
DSP World Mining Fund
DSP World Energy Fund
Edelweiss Emerging Markets Opportunities Equity Off-shore Fund
Kotak Global Emerging Market Fund
2022-ലെ മികച്ച ഫണ്ടുകൾ
*1 വർഷത്തെ പ്രകടനത്തെ അടിസ്ഥാനമാക്കിയുള്ള മികച്ച ഫണ്ടുകൾ.
"The primary investment objective of the Scheme is to seek capital appreciation by investing predominantly in units of MLIIF - WGF. The Scheme may, at the discretion of the Investment Manager, also invest in the units of other similar overseas mutual fund schemes, which may constitute a significant part of its corpus. The Scheme may also invest a certain portion of its corpus in money market securities and/or units of money market/liquid schemes of DSP Merrill Lynch Mutual Fund, in order to meet liquidity requirements from time to time. However, there is no assurance that the investment objective of the Scheme will be realized." Below is the key information for DSP World Gold Fund Returns up to 1 year are on The primary investment objective of the Scheme is to seek capital appreciation by investing predominantly in the units of BlackRock Global Funds – World Mining Fund. The Scheme may, at the discretion of the Investment Manager, also invest in the units of other similar overseas mutual fund schemes, which may
constitute a significant part of its corpus. The Scheme may also invest a certain portion of its corpus in money market securities and/or money market/liquid schemes of DSP BlackRock Mutual Fund, in order to meet liquidity requirements from time to time. Research Highlights for DSP World Mining Fund Below is the key information for DSP World Mining Fund Returns up to 1 year are on 1. DSP World Gold Fund
DSP World Gold Fund
Growth Launch Date 14 Sep 07 NAV (18 Feb 26) ₹62.6234 ↑ 2.23 (3.69 %) Net Assets (Cr) ₹1,975 on 31 Jan 26 Category Equity - Global AMC DSP BlackRock Invmt Managers Pvt. Ltd. Rating ☆☆☆ Risk High Expense Ratio 1.41 Sharpe Ratio 3.41 Information Ratio -0.47 Alpha Ratio 2.12 Min Investment 1,000 Min SIP Investment 500 Exit Load 0-12 Months (1%),12 Months and above(NIL) Growth of 10,000 investment over the years.
Date Value 31 Jan 21 ₹10,000 31 Jan 22 ₹8,807 31 Jan 23 ₹9,422 31 Jan 24 ₹8,517 31 Jan 25 ₹12,548 31 Jan 26 ₹33,170 Returns for DSP World Gold Fund
absolute basis & more than 1 year are on CAGR (Compound Annual Growth Rate) basis. as on 18 Feb 26 Duration Returns 1 Month 6.2% 3 Month 39.2% 6 Month 84.2% 1 Year 156.2% 3 Year 58.2% 5 Year 29.3% 10 Year 15 Year Since launch 10.5% Historical performance (Yearly) on absolute basis
Year Returns 2024 167.1% 2023 15.9% 2022 7% 2021 -7.7% 2020 -9% 2019 31.4% 2018 35.1% 2017 -10.7% 2016 -4% 2015 52.7% Fund Manager information for DSP World Gold Fund
Name Since Tenure Jay Kothari 1 Mar 13 12.93 Yr. Data below for DSP World Gold Fund as on 31 Jan 26
Equity Sector Allocation
Sector Value Basic Materials 95.89% Asset Allocation
Asset Class Value Cash 1.55% Equity 95.89% Debt 0.01% Other 2.56% Top Securities Holdings / Portfolio
Name Holding Value Quantity BGF World Gold I2
Investment Fund | -74% ₹1,458 Cr 1,177,658
↓ -41,596 VanEck Gold Miners ETF
- | GDX25% ₹497 Cr 573,719 Treps / Reverse Repo Investments
CBLO/Reverse Repo | -2% ₹35 Cr Net Receivables/Payables
Net Current Assets | -1% -₹15 Cr 2. DSP World Mining Fund
DSP World Mining Fund
Growth Launch Date 29 Dec 09 NAV (18 Feb 26) ₹32.0424 ↑ 1.32 (4.30 %) Net Assets (Cr) ₹181 on 31 Jan 26 Category Equity - Global AMC DSP BlackRock Invmt Managers Pvt. Ltd. Rating ☆☆☆ Risk High Expense Ratio 1.14 Sharpe Ratio 3.17 Information Ratio 0 Alpha Ratio 0 Min Investment 1,000 Min SIP Investment 500 Exit Load 0-12 Months (1%),12 Months and above(NIL) Growth of 10,000 investment over the years.
Date Value 31 Jan 21 ₹10,000 31 Jan 22 ₹11,733 31 Jan 23 ₹14,422 31 Jan 24 ₹12,454 31 Jan 25 ₹12,799 31 Jan 26 ₹25,833 Returns for DSP World Mining Fund
absolute basis & more than 1 year are on CAGR (Compound Annual Growth Rate) basis. as on 18 Feb 26 Duration Returns 1 Month 7.3% 3 Month 40.2% 6 Month 69.1% 1 Year 93.9% 3 Year 23.5% 5 Year 19% 10 Year 15 Year Since launch 7.5% Historical performance (Yearly) on absolute basis
Year Returns 2024 79% 2023 -8.1% 2022 0% 2021 12.2% 2020 18% 2019 34.9% 2018 21.5% 2017 -9.4% 2016 21.1% 2015 49.7% Fund Manager information for DSP World Mining Fund
Name Since Tenure Jay Kothari 1 Mar 13 12.93 Yr. Data below for DSP World Mining Fund as on 31 Jan 26
Equity Sector Allocation
Sector Value Basic Materials 95.77% Energy 1.05% Asset Allocation
Asset Class Value Cash 3.15% Equity 96.82% Debt 0.02% Top Securities Holdings / Portfolio
Name Holding Value Quantity BGF World Mining I2
Investment Fund | -99% ₹180 Cr 149,227
↓ -1,163 Treps / Reverse Repo Investments
CBLO/Reverse Repo | -1% ₹2 Cr Net Receivables/Payables
Net Current Assets | -0% ₹0 Cr
ഇവിടെ നൽകിയിരിക്കുന്ന വിവരങ്ങൾ കൃത്യമാണെന്ന് ഉറപ്പാക്കാൻ എല്ലാ ശ്രമങ്ങളും നടത്തിയിട്ടുണ്ട്. എന്നിരുന്നാലും, ഡാറ്റയുടെ കൃത്യത സംബന്ധിച്ച് യാതൊരു ഉറപ്പും നൽകുന്നില്ല. എന്തെങ്കിലും നിക്ഷേപം നടത്തുന്നതിന് മുമ്പ് സ്കീം വിവര രേഖ ഉപയോഗിച്ച് പരിശോധിക്കുക.


Research Highlights for DSP World Gold Fund