पंजाब नॅशनल बँकेत एसआयपी व्यवहारांसाठी बिलर कसे जोडायचे?
मध्येSIP किंवा पद्धतशीरगुंतवणूक योजना व्यक्ती लहान रक्कम जमा करतातम्युच्युअल फंड ठराविक अंतराने योजना. पैसे नियमित अंतराने कापले जात असल्याने, व्यक्ती बिलर्स जोडून पेमेंट प्रक्रिया सुलभ करू शकतातबँक खाते SIP व्यवहारांसाठी बिलर जोडण्यासाठी, व्यक्तीकडे SIP व्यवहाराचा अद्वितीय नोंदणी क्रमांक किंवा URN असणे आवश्यक आहे. व्यक्तींनी प्रथम SIP पेमेंट केल्यावर त्यांना हा नंबर मिळतो. बिलर जोडण्याची प्रक्रिया प्रत्येक बँकेसाठी वेगळी असते. तर, पंजाबमधील SIP व्यवहारांसाठी बिलर जोडण्याची प्रक्रिया समजून घेऊनॅशनल बँक. मोबाइल बँकिंगच्या मदतीने या पायऱ्या खाली स्पष्ट केल्या आहेत.
तुमचा PNB मोबाईल ऍप्लिकेशन उघडा
लॉगिन प्रक्रियेतील पहिली पायरी म्हणजे तुमच्या मोबाईलवर PNB मोबाईल ऍप्लिकेशन टाकणे. या चरणाची प्रतिमा खाली दिलेली आहे जिथे PNB मोबाईल ऍप्लिकेशनचे चिन्ह हिरव्या रंगात हायलाइट केले आहे.

युजर आयडी आणि एमपीआयएन टाकून तुमच्या खात्यात लॉग इन करा
एकदा तुम्ही PNB ऍप्लिकेशनवर क्लिक केल्यानंतर, एक नवीन स्क्रीन उघडेल. या स्क्रीनमध्ये, तुम्हाला तुमचा वापरकर्ता आयडी आणि एमपीआयएन प्रविष्ट करणे आवश्यक आहे. या चरणाची प्रतिमा खाली दिली आहे जिथे वापरकर्ता आयडी आणि एमपीआयएन ब्लॉक्स हिरव्या रंगात हायलाइट केले आहेत.

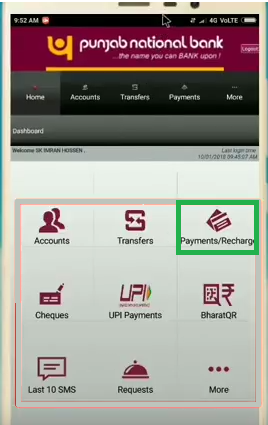
होम स्क्रीनमध्ये पेमेंट रिचार्ज निवडा
एकदा तुम्ही तुमच्या यूजर आयडी आणि एमपीआयएनने लॉग इन केल्यानंतर, होम स्क्रीनवर, तुम्हाला वर क्लिक करावे लागेलपेमेंट/रिचार्ज पर्याय. पेमेंट/रिचार्ज टॅबच्या खाली या चरणाची प्रतिमा हिरव्या रंगात हायलाइट केली आहे.
Register Biller वर क्लिक करा
बिलर जोडण्याच्या प्रक्रियेतील ही चौथी पायरी आहे. एकदा तुम्ही पेमेंट्स/रिचार्ज वर क्लिक केल्यानंतर, एक नवीन टॅब उघडेल ज्यामध्ये नोंदणी बिलर, बिल पहा आणि पैसे द्या, बिलर पहा आणि असे बरेच पर्याय आहेत. या चरणात, आपल्याला वर क्लिक करणे आवश्यक आहेबिलरची नोंदणी करा पर्याय. या चरणाची प्रतिमा खालीलप्रमाणे आहे जिथे नोंदणी बिलर पर्याय हिरव्या रंगात हायलाइट केला आहे.

म्युच्युअल फंड पर्यायावर क्लिक करा
एकदा तुम्ही रजिस्टर बिलरवर क्लिक केल्यानंतर, एक नवीन स्क्रीन उघडेल जी जोडले जाऊ शकणारे विविध बिलर दर्शवेल. काही पर्यायांचा समावेश आहेविमा, सबस्क्रिप्शन, टेलिकॉम इ. येथे, आपल्याला निवडण्याची आवश्यकता आहेम्युच्युअल फंड पर्याय. या चरणाची प्रतिमा खालीलप्रमाणे आहे जिथे म्युच्युअल फंड पर्याय हिरव्या रंगात हायलाइट केला आहे.

BSE Limited निवडा
एकदा तुम्ही मागील चरणात म्युच्युअल फंडावर क्लिक केल्यानंतर, तुम्हाला एका नवीन स्क्रीनवर रीडायरेक्ट केले जाईल जिथे बरेच पर्याय आहेत; आपण निवडणे आवश्यक आहेबीएसई लिमिटेड. या चरणाची प्रतिमा खालीलप्रमाणे आहे जिथे BSE Limited हिरव्या रंगात हायलाइट केले आहे.

URN आणि टोपणनाव प्रविष्ट करा
या चरणात, तुम्हाला टोपणनावासह SIP व्यवहाराचा अद्वितीय नोंदणी क्रमांक किंवा URN प्रविष्ट करणे आवश्यक आहे. हा URN क्रमांक तुम्हाला Fincash कडून तुमच्या ईमेलमध्ये प्राप्त झालेला आहे. तुम्हाला URN न मिळाल्यास; मग तुम्ही लॉग ऑन करून ते मिळवू शकता *तुमचे फिनकॅश खाते* आणि माझ्या SIPs विभागाला भेट देत आहे. एकदा तुम्ही तपशील एंटर केल्यावर तुम्हाला Continue वर क्लिक करावे लागेल. या चरणासाठी प्रतिमा खालीलप्रमाणे आहे जिथे URN क्रमांक बॉक्स हिरव्या रंगात हायलाइट केला आहे.

एकदा तुम्ही सुरू ठेवा वर क्लिक केल्यानंतर, नवीन स्क्रीनमध्ये तुम्हाला ऑटो पे पर्यायांशी संबंधित तपशील जोडणे आवश्यक आहे; तुम्हाला ऑटो पेसाठी निवडण्याची आवश्यकता आहे. त्यानंतर तुम्हाला तुमच्या नोंदणीकृत मोबाईल नंबरवर प्राप्त झालेला OTP टाकावा लागेल. एकदा तुम्ही OTP एंटर केल्यानंतर, बिलर जोडण्याची प्रक्रिया पुष्टी होते.
अशा प्रकारे, वरील चरणांवरून, आम्ही असे म्हणू शकतो की पंजाब नॅशनल बँकेत बिलर जोडण्याची प्रक्रिया सोपी आहे.
उत्तम परतावा मिळविण्यासाठी गुंतवणूक करण्यासाठी सर्वोत्तम SIP
नुसार येथे काही शिफारस केलेल्या SIP आहेत5 वर्ष पेक्षा जास्त परतावा आणि AUMINR 500 Cr:
Fund NAV Net Assets (Cr) Min SIP Investment 3 MO (%) 6 MO (%) 1 YR (%) 3 YR (%) 5 YR (%) 2025 (%) ICICI Prudential Infrastructure Fund Growth ₹205.3
↑ 2.56 ₹8,351 100 6.4 5.8 3.2 21.5 23.9 6.7 LIC MF Infrastructure Fund Growth ₹54.9742
↑ 0.53 ₹1,099 1,000 11 13.3 8.7 26.6 23.5 -3.7 SBI PSU Fund Growth ₹34.5645
↑ 0.53 ₹6,594 500 -1.8 2.5 6.9 26 23.2 11.3 SBI Gold Fund Growth ₹41.6271
↓ -0.09 ₹16,533 500 -4.4 4.1 46.1 32.9 23 71.5 ICICI Prudential Regular Gold Savings Fund Growth ₹44.01
↓ -0.14 ₹6,856 100 -4.4 3.9 45.9 32.8 23 72 Note: Returns up to 1 year are on absolute basis & more than 1 year are on CAGR basis. as on 10 Jul 26 Research Highlights & Commentary of 5 Funds showcased
Commentary ICICI Prudential Infrastructure Fund LIC MF Infrastructure Fund SBI PSU Fund SBI Gold Fund ICICI Prudential Regular Gold Savings Fund Point 1 Upper mid AUM (₹8,351 Cr). Bottom quartile AUM (₹1,099 Cr). Bottom quartile AUM (₹6,594 Cr). Highest AUM (₹16,533 Cr). Lower mid AUM (₹6,856 Cr). Point 2 Oldest track record among peers (20 yrs). Established history (18+ yrs). Established history (16+ yrs). Established history (14+ yrs). Established history (14+ yrs). Point 3 Top rated. Not Rated. Rating: 2★ (upper mid). Rating: 2★ (lower mid). Rating: 1★ (bottom quartile). Point 4 Risk profile: High. Risk profile: High. Risk profile: High. Risk profile: Moderately High. Risk profile: Moderately High. Point 5 5Y return: 23.93% (top quartile). 5Y return: 23.52% (upper mid). 5Y return: 23.23% (lower mid). 5Y return: 23.02% (bottom quartile). 5Y return: 22.98% (bottom quartile). Point 6 3Y return: 21.48% (bottom quartile). 3Y return: 26.59% (lower mid). 3Y return: 26.03% (bottom quartile). 3Y return: 32.95% (top quartile). 3Y return: 32.85% (upper mid). Point 7 1Y return: 3.16% (bottom quartile). 1Y return: 8.69% (lower mid). 1Y return: 6.95% (bottom quartile). 1Y return: 46.05% (top quartile). 1Y return: 45.86% (upper mid). Point 8 Alpha: 0.00 (lower mid). Alpha: 4.51 (top quartile). Alpha: 0.16 (upper mid). 1M return: -2.55% (bottom quartile). 1M return: -2.46% (bottom quartile). Point 9 Sharpe: 0.00 (bottom quartile). Sharpe: 0.26 (lower mid). Sharpe: 0.26 (bottom quartile). Alpha: 0.00 (bottom quartile). Alpha: 0.00 (bottom quartile). Point 10 Information ratio: 0.00 (upper mid). Information ratio: 0.55 (top quartile). Information ratio: -0.02 (bottom quartile). Sharpe: 1.93 (top quartile). Sharpe: 1.79 (upper mid). ICICI Prudential Infrastructure Fund
LIC MF Infrastructure Fund
SBI PSU Fund
SBI Gold Fund
ICICI Prudential Regular Gold Savings Fund
To generate capital appreciation and income distribution to unit holders by investing predominantly in equity/equity related securities of the companies belonging to the infrastructure development and balance in debt securities and money market instruments. Below is the key information for ICICI Prudential Infrastructure Fund Returns up to 1 year are on The investment objective of the scheme is to provide long term growth from a portfolio of equity / equity related instruments of companies engaged either directly or indirectly in the infrastructure sector. Research Highlights for LIC MF Infrastructure Fund Below is the key information for LIC MF Infrastructure Fund Returns up to 1 year are on The objective of the scheme would be to provide investors with opportunities for long-term growth in capital along with the liquidity of an open-ended scheme through an active management of investments in a diversified basket of equity stocks of domestic Public Sector Undertakings and in debt and money market instruments issued by PSUs AND others. Research Highlights for SBI PSU Fund Below is the key information for SBI PSU Fund Returns up to 1 year are on The scheme seeks to provide returns that closely correspond to returns provided by SBI - ETF Gold (Previously known as SBI GETS). Research Highlights for SBI Gold Fund Below is the key information for SBI Gold Fund Returns up to 1 year are on ICICI Prudential Regular Gold Savings Fund (the Scheme) is a fund of funds scheme with the primary objective to generate returns by investing in units of ICICI Prudential Gold Exchange Traded Fund (IPru Gold ETF).
However, there can be no assurance that the investment objectives of the Scheme will be realized. Research Highlights for ICICI Prudential Regular Gold Savings Fund Below is the key information for ICICI Prudential Regular Gold Savings Fund Returns up to 1 year are on 1. ICICI Prudential Infrastructure Fund
ICICI Prudential Infrastructure Fund
Growth Launch Date 31 Aug 05 NAV (10 Jul 26) ₹205.3 ↑ 2.56 (1.26 %) Net Assets (Cr) ₹8,351 on 31 May 26 Category Equity - Sectoral AMC ICICI Prudential Asset Management Company Limited Rating ☆☆☆ Risk High Expense Ratio 1.89 Sharpe Ratio 0 Information Ratio 0 Alpha Ratio 0 Min Investment 5,000 Min SIP Investment 100 Exit Load 0-1 Years (1%),1 Years and above(NIL) Growth of 10,000 investment over the years.
Date Value 30 Jun 21 ₹10,000 30 Jun 22 ₹11,534 30 Jun 23 ₹16,346 30 Jun 24 ₹27,296 30 Jun 25 ₹28,743 30 Jun 26 ₹29,425 Returns for ICICI Prudential Infrastructure Fund
absolute basis & more than 1 year are on CAGR (Compound Annual Growth Rate) basis. as on 10 Jul 26 Duration Returns 1 Month 5.5% 3 Month 6.4% 6 Month 5.8% 1 Year 3.2% 3 Year 21.5% 5 Year 23.9% 10 Year 15 Year Since launch 15.6% Historical performance (Yearly) on absolute basis
Year Returns 2025 6.7% 2024 27.4% 2023 44.6% 2022 28.8% 2021 50.1% 2020 3.6% 2019 2.6% 2018 -14% 2017 40.8% 2016 2% Fund Manager information for ICICI Prudential Infrastructure Fund
Name Since Tenure Ihab Dalwai 3 Jun 17 9.08 Yr. Sharmila D’mello 30 Jun 22 4.01 Yr. Data below for ICICI Prudential Infrastructure Fund as on 31 May 26
Equity Sector Allocation
Sector Value Industrials 47.57% Financial Services 10.57% Utility 10.32% Basic Materials 9.74% Real Estate 8.09% Energy 5.04% Consumer Cyclical 1.98% Communication Services 0.09% Asset Allocation
Asset Class Value Cash 5.83% Equity 94.17% Top Securities Holdings / Portfolio
Name Holding Value Quantity InterGlobe Aviation Ltd (Industrials)
Equity, Since 28 Feb 23 | INDIGO9% ₹745 Cr 1,691,985
↑ 50,000 Larsen & Toubro Ltd (Industrials)
Equity, Since 30 Nov 09 | LT7% ₹614 Cr 1,505,704 Oberoi Realty Ltd (Real Estate)
Equity, Since 31 May 23 | OBEROIRLTY4% ₹365 Cr 2,139,426 Gujarat Energy Ltd (Utilities)
Equity, Since 31 Jan 23 | GUJGASLTD4% ₹340 Cr 8,482,024
↑ 156,557 NTPC Ltd (Utilities)
Equity, Since 29 Feb 16 | NTPC4% ₹334 Cr 8,626,448 Shree Cement Ltd (Basic Materials)
Equity, Since 30 Apr 24 | SHREECEM3% ₹270 Cr 106,892
↑ 3,387 Kalpataru Projects International Ltd (Industrials)
Equity, Since 30 Sep 06 | KPIL3% ₹262 Cr 2,005,608 AIA Engineering Ltd (Industrials)
Equity, Since 28 Feb 21 | AIAENG3% ₹258 Cr 572,697 HDFC Bank Ltd (Financial Services)
Equity, Since 31 Jan 22 | HDFCBANK3% ₹250 Cr 3,357,506
↑ 1,057,506 Container Corporation of India Ltd (Industrials)
Equity, Since 31 Jan 16 | CONCOR3% ₹227 Cr 4,885,153 2. LIC MF Infrastructure Fund
LIC MF Infrastructure Fund
Growth Launch Date 29 Feb 08 NAV (10 Jul 26) ₹54.9742 ↑ 0.53 (0.97 %) Net Assets (Cr) ₹1,099 on 31 May 26 Category Equity - Sectoral AMC LIC Mutual Fund Asset Mgmt Co Ltd Rating Risk High Expense Ratio 2.21 Sharpe Ratio 0.26 Information Ratio 0.55 Alpha Ratio 4.51 Min Investment 5,000 Min SIP Investment 1,000 Exit Load 0-1 Years (1%),1 Years and above(NIL) Growth of 10,000 investment over the years.
Date Value 30 Jun 21 ₹10,000 30 Jun 22 ₹11,137 30 Jun 23 ₹14,179 30 Jun 24 ₹26,268 30 Jun 25 ₹26,896 30 Jun 26 ₹29,151 Returns for LIC MF Infrastructure Fund
absolute basis & more than 1 year are on CAGR (Compound Annual Growth Rate) basis. as on 10 Jul 26 Duration Returns 1 Month 5.4% 3 Month 11% 6 Month 13.3% 1 Year 8.7% 3 Year 26.6% 5 Year 23.5% 10 Year 15 Year Since launch 9.7% Historical performance (Yearly) on absolute basis
Year Returns 2025 -3.7% 2024 47.8% 2023 44.4% 2022 7.9% 2021 46.6% 2020 -0.1% 2019 13.3% 2018 -14.6% 2017 42.2% 2016 -2.2% Fund Manager information for LIC MF Infrastructure Fund
Name Since Tenure Sumit Bhatnagar 7 Apr 26 0.23 Yr. Mahesh Bendre 1 Jul 24 2 Yr. Data below for LIC MF Infrastructure Fund as on 31 May 26
Equity Sector Allocation
Sector Value Industrials 37.05% Consumer Cyclical 20.88% Basic Materials 12.42% Utility 11.88% Communication Services 5.02% Financial Services 3.98% Real Estate 1.97% Health Care 1.89% Technology 1.08% Asset Allocation
Asset Class Value Cash 3.82% Equity 96.18% Top Securities Holdings / Portfolio
Name Holding Value Quantity Larsen & Toubro Ltd (Industrials)
Equity, Since 30 Apr 09 | LT4% ₹44 Cr 106,968
↓ -10,884 Garware Hi-Tech Films Ltd (Basic Materials)
Equity, Since 31 Aug 23 | 5006554% ₹40 Cr 65,325
↓ -7,684 Tata Motors Passenger Vehicles Ltd (Consumer Cyclical)
Equity, Since 28 Feb 26 | TMPV4% ₹39 Cr 982,891
↓ -332,760 Tata Motors Ltd (Consumer Cyclical)
Equity, Since 31 Oct 25 | TMCV4% ₹39 Cr 1,015,933
↑ 26,983 Tata Power Co Ltd (Utilities)
Equity, Since 29 Feb 24 | TATAPOWER3% ₹36 Cr 861,040
↑ 524,312 KSH International Ltd (Industrials)
Equity, Since 31 Dec 25 | KSHINTL3% ₹34 Cr 432,816
↑ 6,280 Siemens Energy India Ltd (Utilities)
Equity, Since 31 Aug 25 | ENRIN3% ₹34 Cr 87,106
↑ 24,800 JSW Infrastructure Ltd (Industrials)
Equity, Since 30 Apr 26 | JSWINFRA3% ₹31 Cr 1,133,858
↑ 745,681 Carraro India Ltd (Consumer Cyclical)
Equity, Since 31 Dec 24 | CARRARO3% ₹31 Cr 572,991 Bharat Dynamics Ltd Ordinary Shares (Industrials)
Equity, Since 31 Jan 26 | BDL3% ₹29 Cr 242,954
↑ 157,744 3. SBI PSU Fund
SBI PSU Fund
Growth Launch Date 7 Jul 10 NAV (10 Jul 26) ₹34.5645 ↑ 0.53 (1.57 %) Net Assets (Cr) ₹6,594 on 31 May 26 Category Equity - Sectoral AMC SBI Funds Management Private Limited Rating ☆☆ Risk High Expense Ratio 1.89 Sharpe Ratio 0.26 Information Ratio -0.02 Alpha Ratio 0.16 Min Investment 5,000 Min SIP Investment 500 Exit Load 0-1 Years (1%),1 Years and above(NIL) Growth of 10,000 investment over the years.
Date Value 30 Jun 21 ₹10,000 30 Jun 22 ₹9,973 30 Jun 23 ₹13,609 30 Jun 24 ₹26,792 30 Jun 25 ₹26,602 30 Jun 26 ₹28,255 Returns for SBI PSU Fund
absolute basis & more than 1 year are on CAGR (Compound Annual Growth Rate) basis. as on 10 Jul 26 Duration Returns 1 Month 0.7% 3 Month -1.8% 6 Month 2.5% 1 Year 6.9% 3 Year 26% 5 Year 23.2% 10 Year 15 Year Since launch 8.1% Historical performance (Yearly) on absolute basis
Year Returns 2025 11.3% 2024 23.5% 2023 54% 2022 29% 2021 32.4% 2020 -10% 2019 6% 2018 -23.8% 2017 21.9% 2016 16.2% Fund Manager information for SBI PSU Fund
Name Since Tenure Rohit Shimpi 1 Jun 24 2.08 Yr. Data below for SBI PSU Fund as on 31 May 26
Equity Sector Allocation
Sector Value Financial Services 32.54% Utility 31.22% Industrials 14.07% Energy 11.97% Basic Materials 6.94% Asset Allocation
Asset Class Value Cash 3.18% Equity 96.74% Debt 0.07% Top Securities Holdings / Portfolio
Name Holding Value Quantity State Bank of India (Financial Services)
Equity, Since 31 Jul 10 | SBIN17% ₹1,112 Cr 11,527,500
↑ 1,000,000 GAIL (India) Ltd (Utilities)
Equity, Since 31 May 24 | GAIL10% ₹628 Cr 38,150,000 NTPC Ltd (Utilities)
Equity, Since 31 Jul 10 | NTPC9% ₹597 Cr 15,443,244 Bharat Electronics Ltd (Industrials)
Equity, Since 30 Jun 24 | BEL9% ₹583 Cr 14,185,000
↑ 800,000 Power Grid Corp Of India Ltd (Utilities)
Equity, Since 31 Jul 10 | POWERGRID9% ₹579 Cr 19,935,554 Oil & Natural Gas Corp Ltd (Energy)
Equity, Since 31 May 20 | ONGC6% ₹389 Cr 14,655,000 Bank of Baroda (Financial Services)
Equity, Since 31 Aug 24 | BANKBARODA5% ₹352 Cr 13,100,000 Bharat Petroleum Corp Ltd (Energy)
Equity, Since 31 Aug 24 | BPCL4% ₹289 Cr 9,700,000 Bharat Heavy Electricals Ltd (Industrials)
Equity, Since 30 Jun 25 | BHEL4% ₹271 Cr 6,500,000 NMDC Ltd (Basic Materials)
Equity, Since 31 Oct 23 | NMDC4% ₹245 Cr 27,900,000 4. SBI Gold Fund
SBI Gold Fund
Growth Launch Date 12 Sep 11 NAV (10 Jul 26) ₹41.6271 ↓ -0.09 (-0.21 %) Net Assets (Cr) ₹16,533 on 31 May 26 Category Gold - Gold AMC SBI Funds Management Private Limited Rating ☆☆ Risk Moderately High Expense Ratio 0.3 Sharpe Ratio 1.93 Information Ratio 0 Alpha Ratio 0 Min Investment 5,000 Min SIP Investment 500 Exit Load 0-1 Years (1%),1 Years and above(NIL) Growth of 10,000 investment over the years.
Date Value 30 Jun 21 ₹10,000 30 Jun 22 ₹10,828 30 Jun 23 ₹12,154 30 Jun 24 ₹14,949 30 Jun 25 ₹19,644 30 Jun 26 ₹28,455 Returns for SBI Gold Fund
absolute basis & more than 1 year are on CAGR (Compound Annual Growth Rate) basis. as on 10 Jul 26 Duration Returns 1 Month -2.5% 3 Month -4.4% 6 Month 4.1% 1 Year 46.1% 3 Year 32.9% 5 Year 23% 10 Year 15 Year Since launch 10.1% Historical performance (Yearly) on absolute basis
Year Returns 2025 71.5% 2024 19.6% 2023 14.1% 2022 12.6% 2021 -5.7% 2020 27.4% 2019 22.8% 2018 6.4% 2017 3.5% 2016 10% Fund Manager information for SBI Gold Fund
Name Since Tenure Viral Chhadva 1 Mar 26 0.33 Yr. Data below for SBI Gold Fund as on 31 May 26
Asset Allocation
Asset Class Value Cash 1.64% Other 98.36% Top Securities Holdings / Portfolio
Name Holding Value Quantity SBI Gold ETF
- | -100% ₹16,542 Cr 1,246,686,194
↑ 13,950,000 Net Receivable / Payable
CBLO | -0% -₹55 Cr Treps
CBLO/Reverse Repo | -0% ₹45 Cr 5. ICICI Prudential Regular Gold Savings Fund
ICICI Prudential Regular Gold Savings Fund
Growth Launch Date 11 Oct 11 NAV (10 Jul 26) ₹44.01 ↓ -0.14 (-0.33 %) Net Assets (Cr) ₹6,856 on 31 May 26 Category Gold - Gold AMC ICICI Prudential Asset Management Company Limited Rating ☆ Risk Moderately High Expense Ratio 0.38 Sharpe Ratio 1.79 Information Ratio 0 Alpha Ratio 0 Min Investment 5,000 Min SIP Investment 100 Exit Load 0-15 Months (2%),15 Months and above(NIL) Growth of 10,000 investment over the years.
Date Value 30 Jun 21 ₹10,000 30 Jun 22 ₹10,811 30 Jun 23 ₹12,106 30 Jun 24 ₹14,939 30 Jun 25 ₹19,567 30 Jun 26 ₹28,290 Returns for ICICI Prudential Regular Gold Savings Fund
absolute basis & more than 1 year are on CAGR (Compound Annual Growth Rate) basis. as on 10 Jul 26 Duration Returns 1 Month -2.5% 3 Month -4.4% 6 Month 3.9% 1 Year 45.9% 3 Year 32.8% 5 Year 23% 10 Year 15 Year Since launch 10.6% Historical performance (Yearly) on absolute basis
Year Returns 2025 72% 2024 19.5% 2023 13.5% 2022 12.7% 2021 -5.4% 2020 26.6% 2019 22.7% 2018 7.4% 2017 0.8% 2016 8.9% Fund Manager information for ICICI Prudential Regular Gold Savings Fund
Name Since Tenure Manish Banthia 27 Sep 12 13.77 Yr. Nishit Patel 29 Dec 20 5.51 Yr. Ashwini Bharucha 1 Nov 25 0.66 Yr. Venus Ahuja 1 Nov 25 0.66 Yr. Data below for ICICI Prudential Regular Gold Savings Fund as on 31 May 26
Asset Allocation
Asset Class Value Cash 1.86% Other 98.14% Top Securities Holdings / Portfolio
Name Holding Value Quantity ICICI Pru Gold ETF
- | -100% ₹6,851 Cr 514,675,516
↑ 10,666,563 Treps
CBLO/Reverse Repo | -0% ₹22 Cr Net Current Assets
Net Current Assets | -0% -₹18 Cr
आणखी काही शंका असल्यास, तुम्ही आमच्याशी 8451864111 वर कोणत्याही कामाच्या दिवशी सकाळी 9.30 ते संध्याकाळी 6.30 दरम्यान संपर्क साधू शकता किंवा आम्हाला कधीही मेल लिहू शकता.support@fincash.com किंवा आमच्या वेबसाइटवर लॉग इन करून आमच्याशी गप्पा माराwww.fincash.com.
येथे प्रदान केलेली माहिती अचूक असल्याची खात्री करण्यासाठी सर्व प्रयत्न केले गेले आहेत. तथापि, डेटाच्या अचूकतेबद्दल कोणतीही हमी दिली जात नाही. कृपया कोणतीही गुंतवणूक करण्यापूर्वी योजना माहिती दस्तऐवजासह सत्यापित करा.
")


AMFI Registration No. 112358 | CIN: U74999MH2016PTC282153
Shepard Technologies Pvt. Ltd. (with ARN code 112358) makes no warranties or representations, express or implied, on products offered through the platform. It accepts no liability for any damages or losses, however caused, in connection with the use of, or on the reliance of its product or related services. Terms and conditions of the website are applicable.
©2026 Shepard Technologies Private Limited. All Rights Reserved
Research Highlights for ICICI Prudential Infrastructure Fund