What is the Parabolic SAR Indicator?
Developed by J. Wells Wilder, the parabolic SAR indicator is used by traders to comprehend trend direction as well as possible reversals in price. This indicator makes use of a trailing stop along with a reverse method, known as SAR, or stop and reverse, to recognize adequate entry and exit points.
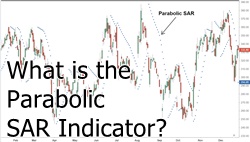
Traders also consider this indicator as the parabolic stop and reverse, parabolic SAR – or PSAR. On a chart, this indicator appears as a series of dots, either below the price of an asset or above, based on the direction whereat the price is moving. Generally, a dot is placed below the price when it is going upward and vice versa.
Parabolic SAR Indicators’ Formula
In comparison to a falling PSAR, the rising one has a slightly varying formula.
Rising PSAR = Prior PSAR + [Prior AF (Prior EP – Prior PSAR)] Falling PSAR = Prior PSAR – [Prior AF (Prior PSAR – Prior EP)] Here; AF = Acceleration Factor EP = Extreme Point
Calculating the Parabolic SAR Indicator
While using the parabolic stop and reverse indicator, there is a variety of things that should be tracked. One of the things to be constantly kept in mind is that if the SAR is rising initially and that the price is closing little near the rising SAR value, the trend is down and the falling SAR formula will be applied.
And, if the price is going above the falling SAR value, on the contrary, rising SAR formula will be used. Some of the other factors to be kept in mind include:
- You must keep a track on the price for at least five or more periods while recording the lows and the highs
- In case the price is increasing, use the lowest of those five periods; if the price is falling, use the highest of those five periods
- Initially, use 0.02 AF and keep increasing it by 0.02 for every new extreme high or low; the maximum AF value is 0.2
- Preferably, use a spreadsheet where you can track low and high price, EP, SAR and AF on a period-to-period Basis
Talk to our investment specialist
There is a variety of charting software available out there that can help with calculating the PSAR. This means that traders will only have to know how the signals of the indicators can easily be interpreted.
All efforts have been made to ensure the information provided here is accurate. However, no guarantees are made regarding correctness of data. Please verify with scheme information document before making any investment.


AMFI Registration No. 112358 | CIN: U74999MH2016PTC282153
Shepard Technologies Pvt. Ltd. (with ARN code 112358) makes no warranties or representations, express or implied, on products offered through the platform. It accepts no liability for any damages or losses, however caused, in connection with the use of, or on the reliance of its product or related services. Terms and conditions of the website are applicable.
©2026 Shepard Technologies Private Limited. All Rights Reserved