Hammer Candlestick
What is a Hammer Candlestick?
A hammer is known as the price pattern in the candlestick charting that takes place when a security is traded significantly lower in comparison to the opening, however, stays within the period closer to the opening price.
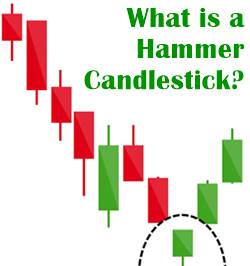
This pattern creates a hammer-like a candlestick wherein the lower shadow is twice the real body’s size. The candlestick’s body signifies the difference between the opening price and the closing price while the shadow demonstrates the low and high prices for that period.
What do you Learn from the Hammer Candlestick?
A hammer appears once the security declines, demonstrating the attempts of the market in determining a bottom. Hammers may signify a possible capitulation by sellers to create a bottom, along with the price increase to signal a potential reversal in the direction of the price.
This happens during that period where the price decreases after the open; however, regroups thereafter to close near the opening price. Also, hammers are extremely effective when they come by a minimum of three or more decreasing candles.
A decreasing candle is the one that closes lower than the close of the candle that was before it. A hammer must look the same as the letter “T”. This signifies the possibility for the appearance of a hammer candle.
However, the hammer candlestick doesn’t indicate the reversal of price to the upside until confirmed. Confirmation takes place in case the candle, following the hammer, closes at a price which is more than the hammer’s closing price.
Generally, this confirmation candle showcases significant purchase. Candlestick traders generally look for long positions to enter and short positions to exit during and after the confirmation. Moreover, hammers can occur on all of the time frames, including weekly charts, daily charts, and one-minute charts.
Talk to our investment specialist
Example of Hammer Candlestick Uses
The chart would show a decline in the price, followed by a pattern of a hammer. This pattern will have a long lower shadow, much longer than the original body. The hammer would also signal the possible price reversal toward the upside.
Confirmation will come on the next candle, which will gap higher and will see the price get bid closer and above the hammer’s closing price. During this confirmation candle, traders generally come up to purchase.
A stop-loss gets placed below the lower side of the hammer or potentially just below the real body of the hammer in case the price is going higher aggressively during the confirmation candle.
All efforts have been made to ensure the information provided here is accurate. However, no guarantees are made regarding correctness of data. Please verify with scheme information document before making any investment.


AMFI Registration No. 112358 | CIN: U74999MH2016PTC282153
Shepard Technologies Pvt. Ltd. (with ARN code 112358) makes no warranties or representations, express or implied, on products offered through the platform. It accepts no liability for any damages or losses, however caused, in connection with the use of, or on the reliance of its product or related services. Terms and conditions of the website are applicable.
©2026 Shepard Technologies Private Limited. All Rights Reserved