Hanging Man Candlestick
What is a Hanging Man Candlestick?
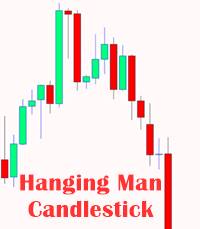
A hanging man Candlestick takes place when there is an uptrend. This gives a warning that prices might begin to fall. The candle has a small real body, no or little upper shadow, and a long lower shadow.
However, the hanging man demonstrates that selling interest is beginning to increase. For the pattern to be viable, the candle, following the hanging man, must look at the decline of the asset’s price.
Explaining Hanging Man Candlestick
A hanging man demonstrates a massive sell-off after the open that sends the price to decline, but then the buyer pushes the price up to near about the opening price. Traders see the hanging man as a representation of the bulls that are starting to lose their control and that the asset may enter into a downtrend soon.
The pattern of hanging man occurs once the price has been moving toward the higher side for a few candlesticks now. This doesn’t necessarily have to be a significant advance. It could be; however, the pattern can also appear within the short-term rise amid a large downtrend.
A hanging man looks like the shape of a T; however, the candle’s appearance is only a warning and not a signal to act quickly. The hanging man pattern will not be confirmed until the price has fallen shortly after.
Talk to our investment specialist
Once the hanging man has appeared, the price must not close higher than the high price of the hanging man candle as this will signal the potential advance of another price. In case the price decreases after the hanging man, this confirms the pattern.
And then, the candlestick traders would use it as a signal to exit their long positions and step into short positions. If, after the hanging man, entering the new short position is confirmed, a stop loss can get placed above the hanging man candle’s high.
Often, the general candlesticks and the hanging man are not used in isolation. Instead, they get used in conjunction with other types of analysis, like technical indicators or trend or price analysis. Moreover, hanging man can occur on all of the time frames, including one-minute charts up to weekly as well as monthly charts.
Example of a Hanging Man Candlestick
Let’s suppose there is a chart that showcases the decline of price after a short-term increase in prices where the hanging man candle appears. Following the hanging man, the price declines on the next candle, giving the needed confirmation to complete this pattern. After or during the confirmation candle, traders can enter the short trades.
All efforts have been made to ensure the information provided here is accurate. However, no guarantees are made regarding correctness of data. Please verify with scheme information document before making any investment.


AMFI Registration No. 112358 | CIN: U74999MH2016PTC282153
Shepard Technologies Pvt. Ltd. (with ARN code 112358) makes no warranties or representations, express or implied, on products offered through the platform. It accepts no liability for any damages or losses, however caused, in connection with the use of, or on the reliance of its product or related services. Terms and conditions of the website are applicable.
©2026 Shepard Technologies Private Limited. All Rights Reserved