How Can the Fibonacci Sequence Affect Trading Behaviour?
The world of trading is about numbers and charts and understanding the psychological aspects that drive Market trends. One intriguing element that has captured traders' attention is the Fibonacci sequence and its impact on trading behaviour. The Fibonacci sequence is a mathematical pattern where every number is the sum of the two preceding ones, starting from 0 and 1.
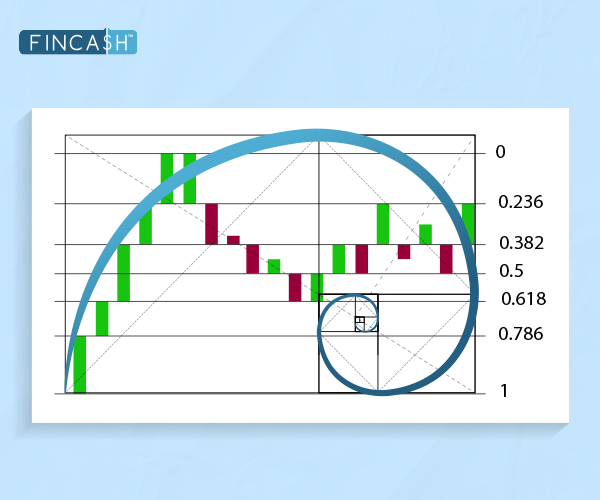
This sequence produces ratios widely used in various fields, including trading. The key Fibonacci ratios include 23.6%, 38.2%, 50%, 61.8%, and 78.6%, each derived from the sequence. In this article, let's explore the fascinating connection between the Fibonacci sequence and Market Dynamics.
Impact of Fibonacci Sequence on Trading Behaviour
Humans naturally identify patterns, and traders often draw connections between patterns in charts using the Fibonacci sequence. While the direct correlation between Fibonacci numbers and fundamental market forces remains unproven, the structure of markets inherently responds to the beliefs of their participants. Some financial analysts also assert that they discern the influence of these numbers, even in the context of the current economic crisis.
Consequently, when investors buy or sell based on Fibonacci analysis, they inadvertently contribute to a self-fulfilling prophecy that influences market trends. Investigation experts, referred to as "technical analysts", examine the historical patterns of charts to assess whether an ongoing trend in buying or selling will persist or reverse. Some analysts base their predictions on "Fibonacci retracement levels," derived from the renowned sequence.
Technical analysts may assess various numbers linked to ratios within the Fibonacci sequence, but two significant ones are 61.8% and 38.2%. The division of any given Fibonacci number by its successor yields an approximation of 1/phi, or 0.618. Similarly, dividing a Fibonacci number by the number two places higher in the sequence comes to an approximation of 0.382.
Talk to our investment specialist
Reasons to Incorporate Fibonacci in Trading
Below mentioned are some of the reasons that justify the application of the Fibonacci sequence in trading:
Identifying Sturdy Support and Resistance Levels: Fibonacci levels are highly effective in identifying robust resistance (ceiling levels) and support (floor levels) in high-liquidity markets.
Efficient Entry and Exit Points: After selecting a market for trading, Fibonacci levels prove valuable in devising a Trading Strategy by identifying entry, stop-loss, and take-profit levels.
Signalling Possible Pull-Backs: Once the Fibonacci indicator is plotted on the chart, it becomes a tool to foresee potential pull-backs or retracements in the market. When a price breaches a Fibonacci level, it provides insights into where the next pull-back in the market's price might occur.
The Use of Fibonacci Indicators in Stocks
Fibonacci indicators are widely employed in the stock market. For instance, if you buy a share at Rs. 100 and multiply it by the ratio, you obtain a level of Rs. 61.8, which can serve as a viable stop loss. Multiplying this ratio by the stock price provides valuable information on target ranges, stop losses, and entry points for stock trading. Fibonacci indicators in stock trading typically display various ratios, such as 61.8%, 38.2%, and 23.6%, aiding traders in assessing potential retracement levels. These thresholds act as markers for traders to position themselves in a transaction.
Application in Trading
Here is how the Fibonacci sequence gets applied in trading:
Identification of Support and Resistance Levels: Traders often use Fibonacci retracement levels to identify potential support and resistance levels in a price trend. These levels are drawn between significant highs and lows on a chart, helping traders anticipate where a reversal or stall might occur.
Entry and Exit Points: Fibonacci retracement levels are crucial indicators for traders looking to enter or exit positions. For instance, a trader may notice that a stock has declined by 38.2% after a significant upward movement. This Fibonacci level can signal a potential entry point, anticipating a reversal and subsequent price increase.
Psychological Impact: The influence of the Fibonacci sequence on trading is not solely based on mathematical precision but also psychology. Traders follow these levels because many others in the market do, creating a self-fulfilling prophecy. The collective actions of traders adhering to Fibonacci levels shape market trends.
Market Sentiment: The Fibonacci sequence reflects natural patterns and proportions found in various aspects of life, creating a sense of harmony. Traders incorporate these ratios into their strategies, affecting overall market sentiment. When many traders react to Fibonacci levels, it can influence the direction of price movements.
Wave Analysis: Elliott Wave Theory, a popular method of Technical Analysis, incorporates Fibonacci ratios. According to this theory, price movements in financial markets follow a pattern of five waves going towards the main trend, followed by three corrective waves. Fibonacci ratios help identify the potential end of these waves, aiding traders in making informed decisions.
Optimal Fibonacci Trading Strategies
In trend-trading strategies, Fibonacci retracement lines play a pivotal role. When a retracement occurs within a trend, traders leverage Fibonacci levels to initiate trades aligned with the Underlying trend. The rationale is based on the likelihood that a security's price will rebound from the Fibonacci level, resuming its trajectory in the initial trend's direction. Fibonacci levels become valuable for traders aiming to buy a specific security but missing out on a recent uptrend. Waiting for a pull-back, traders can plot Fibonacci ratios like 61.8%, 38.2%, and 23.6% on a chart to identify potential retracement levels and strategically enter trades.
Fibonacci levels seamlessly integrate into various trading strategies, including:
MACD Indicator Combination: Integrating Fibonacci retracement lines with the MACD indicator involves seeking crossovers of the MACD indicator coinciding with a security's price touching a significant Fibonacci level. This alignment prompts the opening of a position in the direction of the prevailing trend.
Stochastic Indicator Pairing: Another strategy involves combining Fibonacci levels with the stochastic indicator, a two-line tool that identifies overbought and oversold levels. This approach looks for key signals from the stochastic indicator when the price intersects with a crucial Fibonacci level, signalling an opportune moment to initiate a position.
Fibonacci retracement levels exhibit efficacy across multiple timeframes, with their accuracy peaking in longer durations. For instance, a 38% retracement on a weekly chart holds more technical significance than the same retracement on a five-minute chart. Choosing the right chart timeframe is crucial for leveraging Fibonacci retracement levels effectively.
While Fibonacci retracement levels enhance technical analysis, their optimal use lies within a comprehensive strategy. Employing a mix of indicators enhances trend identification, elevating the potential for profitable trades. As a guiding principle, a confluence of confirming factors strengthens the reliability of trade signals in the dynamic landscape of financial markets.
Conclusion
The Fibonacci sequence's influence on trading behaviour goes beyond mere mathematical patterns; it taps into the psychology of market participants. Traders across the globe use Fibonacci retracement levels to identify potential reversal points, make entry and exit decisions, and gauge overall market sentiment. The self-fulfilling nature of Fibonacci analysis highlights the intricate relationship between mathematical principles and human behaviour in the dynamic world of trading. Understanding this connection can empower traders to navigate the markets with a deeper insight into the forces that drive price movements.
All efforts have been made to ensure the information provided here is accurate. However, no guarantees are made regarding correctness of data. Please verify with scheme information document before making any investment.


AMFI Registration No. 112358 | CIN: U74999MH2016PTC282153
Shepard Technologies Pvt. Ltd. (with ARN code 112358) makes no warranties or representations, express or implied, on products offered through the platform. It accepts no liability for any damages or losses, however caused, in connection with the use of, or on the reliance of its product or related services. Terms and conditions of the website are applicable.
©2026 Shepard Technologies Private Limited. All Rights Reserved