8 ಅತ್ಯುತ್ತಮ ಅಂತರಾಷ್ಟ್ರೀಯ ಮ್ಯೂಚುಯಲ್ ಫಂಡ್ಗಳು 2022
ಅಂತಾರಾಷ್ಟ್ರೀಯಮ್ಯೂಚುಯಲ್ ಫಂಡ್ಗಳು ಹೊರತುಪಡಿಸಿ ವಿದೇಶಿ ಮಾರುಕಟ್ಟೆಗಳಲ್ಲಿ ಹೂಡಿಕೆ ಮಾಡುವ ನಿಧಿಗಳಾಗಿವೆಹೂಡಿಕೆದಾರವಾಸಿಸುವ ದೇಶ. ಮತ್ತೊಂದೆಡೆ,ಜಾಗತಿಕ ನಿಧಿ ವಿದೇಶಿ ಮಾರುಕಟ್ಟೆಗಳಲ್ಲಿ ಮತ್ತು ಹೂಡಿಕೆದಾರರ ವಾಸಸ್ಥಳದಲ್ಲಿ ಹೂಡಿಕೆ ಮಾಡಿ. ಅಂತರಾಷ್ಟ್ರೀಯ ಮ್ಯೂಚುಯಲ್ ಫಂಡ್ಗಳನ್ನು "ವಿದೇಶಿ ನಿಧಿ" ಎಂದೂ ಕರೆಯಲಾಗುತ್ತದೆ ಮತ್ತು ಇವುಗಳ ಒಂದು ರೂಪನಿಧಿಯ ನಿಧಿ'ತಂತ್ರ.
ಬಾಷ್ಪಶೀಲ ಸ್ಥಳೀಯ ಮಾರುಕಟ್ಟೆಗಳಿಂದಾಗಿ ಕಳೆದ ಕೆಲವು ವರ್ಷಗಳಲ್ಲಿ ಹೂಡಿಕೆದಾರರಿಗೆ ಅಂತರರಾಷ್ಟ್ರೀಯ ಮ್ಯೂಚುವಲ್ ಫಂಡ್ಗಳು ಆಕರ್ಷಕ ಹೂಡಿಕೆಯ ಆಯ್ಕೆಯಾಗಿ ಮಾರ್ಪಟ್ಟಿವೆ.ಆರ್ಥಿಕತೆ ಅದರ ಏರಿಳಿತಗಳ ಮೂಲಕ ಹೋಗುತ್ತಿದೆ.
ಭಾರತದಲ್ಲಿನ ಅಂತಾರಾಷ್ಟ್ರೀಯ ಮ್ಯೂಚುಯಲ್ ಫಂಡ್ಗಳ ಹಿನ್ನೆಲೆ
ಮೀಸಲು ಅನುಮತಿಯೊಂದಿಗೆಬ್ಯಾಂಕ್ ಭಾರತದ (RBI), ಇಂಟರ್ನ್ಯಾಷನಲ್ ಮ್ಯೂಚುಯಲ್ ಫಂಡ್ಗಳು 2007 ರಲ್ಲಿ ಭಾರತದಲ್ಲಿ ಪ್ರಾರಂಭವಾಯಿತು. ಪ್ರತಿ ನಿಧಿಗೆ USD 500 ಮಿಲಿಯನ್ ಕಾರ್ಪಸ್ ಪಡೆಯಲು ಅನುಮತಿಸಲಾಗಿದೆ.
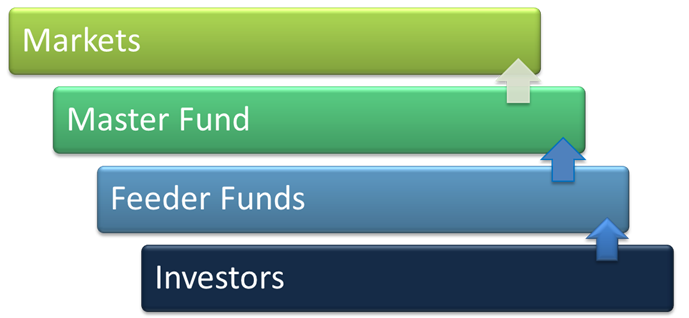
ಅಂತರರಾಷ್ಟ್ರೀಯ ಮ್ಯೂಚುಯಲ್ ಫಂಡ್ಗಳ ಮಾಸ್ಟರ್-ಫೀಡರ್ ರಚನೆ
ಅಂತರರಾಷ್ಟ್ರೀಯ ಮ್ಯೂಚುಯಲ್ ಫಂಡ್ಗಳು ಮಾಸ್ಟರ್-ಫೀಡರ್ ರಚನೆಯನ್ನು ಅನುಸರಿಸುತ್ತವೆ. ಮಾಸ್ಟರ್-ಫೀಡರ್ ರಚನೆಯು ಮೂರು ಹಂತದ ರಚನೆಯಾಗಿದ್ದು, ಹೂಡಿಕೆದಾರರು ತಮ್ಮ ಹಣವನ್ನು ಫೀಡರ್ ಫಂಡ್ನಲ್ಲಿ ಇರಿಸುತ್ತಾರೆ, ಅದು ನಂತರ ಮಾಸ್ಟರ್ ಫಂಡ್ನಲ್ಲಿ ಹೂಡಿಕೆ ಮಾಡುತ್ತದೆ. ಮಾಸ್ಟರ್ ಫಂಡ್ ನಂತರ ಹಣವನ್ನು ಹೂಡಿಕೆ ಮಾಡುತ್ತದೆಮಾರುಕಟ್ಟೆ. ಫೀಡರ್ ಫಂಡ್ ಆನ್-ಶೋರ್ ಅನ್ನು ಆಧರಿಸಿದೆ, ಅಂದರೆ ಭಾರತದಲ್ಲಿ, ಮಾಸ್ಟರ್ ಫಂಡ್ ಆಫ್-ಶೋರ್ ಅನ್ನು ಆಧರಿಸಿದೆ (ಲಕ್ಸೆಂಬರ್ಗ್ ಮುಂತಾದ ವಿದೇಶಿ ಭೂಗೋಳದಲ್ಲಿ).
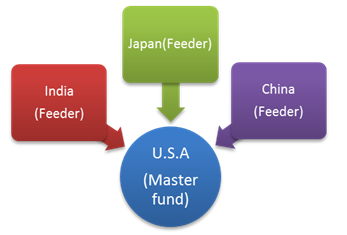
ಒಂದು ಮಾಸ್ಟರ್ ಫಂಡ್ ಬಹು ಫೀಡರ್ ಫಂಡ್ಗಳನ್ನು ಹೊಂದಬಹುದು. ಉದಾಹರಣೆಗೆ,
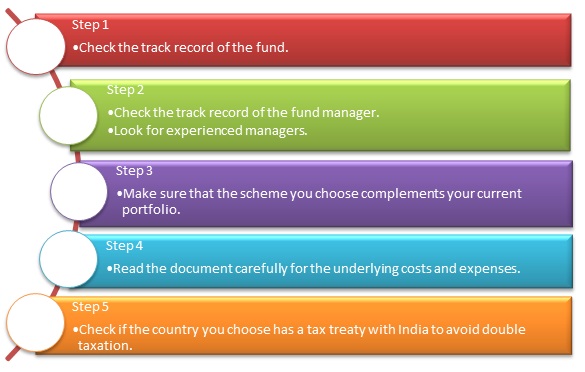
ಅಂತರರಾಷ್ಟ್ರೀಯ ಮ್ಯೂಚುಯಲ್ ಫಂಡ್ ಅನ್ನು ಹೇಗೆ ಆರಿಸುವುದು?
ಸೂಕ್ತವಾದ ನಿಧಿಯನ್ನು ಆಯ್ಕೆಮಾಡುವಾಗ ಕೆಲವು ವಿಷಯಗಳನ್ನು ನೆನಪಿನಲ್ಲಿಟ್ಟುಕೊಳ್ಳಬೇಕು.
FY 22 - 23 ರಲ್ಲಿ ಹೂಡಿಕೆ ಮಾಡಲು ಅತ್ಯುತ್ತಮ ಅಂತರಾಷ್ಟ್ರೀಯ ಮ್ಯೂಚುಯಲ್ ಫಂಡ್ಗಳು
The primary investment objective of the Scheme is to seek capital appreciation by investing predominantly in the units of BlackRock Global Funds – World Mining Fund. The Scheme may, at the discretion of the Investment Manager, also invest in the units of other similar overseas mutual fund schemes, which may
constitute a significant part of its corpus. The Scheme may also invest a certain portion of its corpus in money market securities and/or money market/liquid schemes of DSP BlackRock Mutual Fund, in order to meet liquidity requirements from time to time. Research Highlights for DSP World Mining Fund Below is the key information for DSP World Mining Fund Returns up to 1 year are on "The primary investment objective of the Scheme is to seek capital appreciation by investing predominantly in units of MLIIF - WGF. The Scheme may, at the discretion of the Investment Manager, also invest in the units of other similar overseas mutual fund schemes, which may constitute a significant part of its corpus. The Scheme may also invest a certain portion of its corpus in money market securities and/or units of money market/liquid schemes of DSP Merrill Lynch Mutual Fund, in order to meet liquidity requirements from time to time. However, there is no assurance that the investment objective of the Scheme will be realized." Research Highlights for DSP World Gold Fund Below is the key information for DSP World Gold Fund Returns up to 1 year are on The primary investment objective of the Scheme is to seek to provide long term capital growth by investing predominantly in the JPMorgan Funds - Emerging Markets Opportunities Fund, an equity fund which invests primarily in an aggressively managed portfolio of emerging market companies Research Highlights for Edelweiss Emerging Markets Opportunities Equity Off-shore Fund Below is the key information for Edelweiss Emerging Markets Opportunities Equity Off-shore Fund Returns up to 1 year are on An open-end diversified equity fund that seeks to provide medium to long term appreciation through investments primarily in Asian Companies / sectors (excluding Japan) with long term potential across market capitalisation. Research Highlights for Franklin Asian Equity Fund Below is the key information for Franklin Asian Equity Fund Returns up to 1 year are on The primary investment objective of the Scheme is to seek capital appreciation by investing predominantly in the units of BlackRock Global Funds – World Energy Fund and BlackRock Global Funds – New Energy Fund. The Scheme may, at the discretion of the Investment Manager, also invest in the units of other similar overseas mutual fund schemes, which may constitute a significant part of its corpus. The Scheme may also invest a certain portion of its corpus in money market securities
and/or money market/liquid schemes of DSP BlackRock Mutual Fund, in order to meet liquidity
requirements from time to time. Research Highlights for DSP World Energy Fund Below is the key information for DSP World Energy Fund Returns up to 1 year are on The investment objective of the scheme is to provide long-term capital appreciation by investing in an overseas mutual fund scheme that invests in a diversified portfolio of securities as prescribed by SEBI from time to time in global emerging markets. Research Highlights for Kotak Global Emerging Market Fund Below is the key information for Kotak Global Emerging Market Fund Returns up to 1 year are on The primary investment objective of the Scheme is to seek capital appreciation by investing predominantly in units of BGF – USFEF. The Scheme may, at the discretion of the Investment Manager also invest in the units of other similar overseas mutual fund schemes, which may constitute a significant part of its corpus. The Scheme may also invest a certain portion of its corpus in money market securities and/or money market/liquid schemes of DSP BlackRock Mutual Fund, in order to meet liquidity requirements from time to time. However, there is no assurance that the investment objective of the Scheme will be realized. It shall be noted ‘similar overseas mutual fund schemes’ shall have investment objective, investment strategy and risk profile/consideration similar to those of BGF – USFEF. Research Highlights for DSP US Flexible Equity Fund Below is the key information for DSP US Flexible Equity Fund Returns up to 1 year are on (Erstwhile Invesco India Pan European Equity Fund) To generate capital appreciation by investing predominantly in units of Invesco Pan European Equity Fund, an overseas equity fund which invests primarily in equity securities of European companies with an emphasis on larger companies.
The Scheme may, at the discretion of Fund Manager, also invest in units of
other similar Overseas Mutual Funds with similar objectives, strategy and
attributes which may constitute a significant portion of its net assets. Research Highlights for Invesco India Feeder- Invesco Pan European Equity Fund Below is the key information for Invesco India Feeder- Invesco Pan European Equity Fund Returns up to 1 year are on Fund NAV Net Assets (Cr) Min SIP Investment 3 MO (%) 6 MO (%) 1 YR (%) 3 YR (%) 5 YR (%) 2024 (%) DSP World Mining Fund Growth ₹30.7162
↑ 0.88 ₹164 500 -3.7 -3.6 69.4 23.2 15.1 79 DSP World Gold Fund Growth ₹50.4247
↑ 1.63 ₹1,433 500 -12.7 -17.8 62.8 43.6 22.1 167.1 Edelweiss Emerging Markets Opportunities Equity Off-shore Fund Growth ₹26.7341
↑ 0.45 ₹259 1,000 0.6 12 50.9 22.8 9.7 41.1 Franklin Asian Equity Fund Growth ₹44.1026
↑ 2.12 ₹979 500 9.3 14.1 39.7 18.4 8.1 23.7 DSP World Energy Fund Growth ₹28.3086
↑ 0.67 ₹117 500 -4.6 8.2 39.5 15.2 11.9 39.2 Kotak Global Emerging Market Fund Growth ₹36.475
↑ 0.10 ₹1,767 1,000 -3 6.2 38.8 20.6 10.2 39.1 DSP US Flexible Equity Fund Growth ₹90.0193
↑ 0.77 ₹1,291 500 1.5 11.7 36.9 24.6 17.2 33.8 Invesco India Feeder- Invesco Pan European Equity Fund Growth ₹26.678
↑ 0.31 ₹219 500 8.1 9.8 36.1 19 14.9 42.5 Note: Returns up to 1 year are on absolute basis & more than 1 year are on CAGR basis. as on 30 Jul 26 Research Highlights & Commentary of 8 Funds showcased
Commentary DSP World Mining Fund DSP World Gold Fund Edelweiss Emerging Markets Opportunities Equity Off-shore Fund Franklin Asian Equity Fund DSP World Energy Fund Kotak Global Emerging Market Fund DSP US Flexible Equity Fund Invesco India Feeder- Invesco Pan European Equity Fund Point 1 Bottom quartile AUM (₹164 Cr). Top quartile AUM (₹1,433 Cr). Lower mid AUM (₹259 Cr). Upper mid AUM (₹979 Cr). Bottom quartile AUM (₹117 Cr). Highest AUM (₹1,767 Cr). Upper mid AUM (₹1,291 Cr). Lower mid AUM (₹219 Cr). Point 2 Established history (16+ yrs). Oldest track record among peers (18 yrs). Established history (12+ yrs). Established history (18+ yrs). Established history (16+ yrs). Established history (18+ yrs). Established history (14+ yrs). Established history (12+ yrs). Point 3 Rating: 3★ (upper mid). Rating: 3★ (upper mid). Rating: 3★ (lower mid). Top rated. Rating: 2★ (bottom quartile). Rating: 3★ (lower mid). Rating: 5★ (top quartile). Rating: 3★ (bottom quartile). Point 4 Risk profile: High. Risk profile: High. Risk profile: High. Risk profile: High. Risk profile: High. Risk profile: High. Risk profile: High. Risk profile: High. Point 5 5Y return: 15.08% (upper mid). 5Y return: 22.15% (top quartile). 5Y return: 9.67% (bottom quartile). 5Y return: 8.09% (bottom quartile). 5Y return: 11.88% (lower mid). 5Y return: 10.16% (lower mid). 5Y return: 17.19% (top quartile). 5Y return: 14.91% (upper mid). Point 6 3Y return: 23.16% (upper mid). 3Y return: 43.62% (top quartile). 3Y return: 22.75% (upper mid). 3Y return: 18.41% (bottom quartile). 3Y return: 15.16% (bottom quartile). 3Y return: 20.57% (lower mid). 3Y return: 24.61% (top quartile). 3Y return: 19.05% (lower mid). Point 7 1Y return: 69.45% (top quartile). 1Y return: 62.77% (top quartile). 1Y return: 50.92% (upper mid). 1Y return: 39.67% (upper mid). 1Y return: 39.47% (lower mid). 1Y return: 38.84% (lower mid). 1Y return: 36.94% (bottom quartile). 1Y return: 36.11% (bottom quartile). Point 8 Alpha: 0.00 (upper mid). Alpha: 2.12 (top quartile). Alpha: 6.30 (top quartile). Alpha: 0.00 (upper mid). Alpha: 0.00 (lower mid). Alpha: -1.76 (bottom quartile). Alpha: -4.10 (bottom quartile). Alpha: 0.00 (lower mid). Point 9 Sharpe: 1.74 (lower mid). Sharpe: 1.22 (bottom quartile). Sharpe: 2.20 (top quartile). Sharpe: 1.54 (bottom quartile). Sharpe: 2.76 (top quartile). Sharpe: 1.88 (upper mid). Sharpe: 1.93 (upper mid). Sharpe: 1.61 (lower mid). Point 10 Information ratio: 0.00 (top quartile). Information ratio: -0.50 (bottom quartile). Information ratio: -0.41 (bottom quartile). Information ratio: 0.00 (upper mid). Information ratio: 0.00 (upper mid). Information ratio: -0.25 (lower mid). Information ratio: 0.15 (top quartile). Information ratio: 0.00 (lower mid). DSP World Mining Fund
DSP World Gold Fund
Edelweiss Emerging Markets Opportunities Equity Off-shore Fund
Franklin Asian Equity Fund
DSP World Energy Fund
Kotak Global Emerging Market Fund
DSP US Flexible Equity Fund
Invesco India Feeder- Invesco Pan European Equity Fund
10 ಕೋಟಿ ಹೆಚ್ಚು ಮತ್ತು ಕಳೆದ ಒಂದು ವರ್ಷದ ರಿಟರ್ನ್ ಮೇಲೆ ವಿಂಗಡಿಸಲಾಗಿದೆ.1. DSP World Mining Fund
DSP World Mining Fund
Growth Launch Date 29 Dec 09 NAV (30 Jul 26) ₹30.7162 ↑ 0.88 (2.94 %) Net Assets (Cr) ₹164 on 30 Jun 26 Category Equity - Global AMC DSP BlackRock Invmt Managers Pvt. Ltd. Rating ☆☆☆ Risk High Expense Ratio 1.14 Sharpe Ratio 1.74 Information Ratio 0 Alpha Ratio 0 Min Investment 1,000 Min SIP Investment 500 Exit Load 0-12 Months (1%),12 Months and above(NIL) Growth of 10,000 investment over the years.
Date Value 31 Jul 21 ₹10,000 31 Jul 22 ₹8,812 31 Jul 23 ₹11,045 31 Jul 24 ₹10,685 31 Jul 25 ₹11,685 31 Jul 26 ₹19,837 Returns for DSP World Mining Fund
absolute basis & more than 1 year are on CAGR (Compound Annual Growth Rate) basis. as on 30 Jul 26 Duration Returns 1 Month 3.6% 3 Month -3.7% 6 Month -3.6% 1 Year 69.4% 3 Year 23.2% 5 Year 15.1% 10 Year 15 Year Since launch 7% Historical performance (Yearly) on absolute basis
Year Returns 2024 79% 2023 -8.1% 2022 0% 2021 12.2% 2020 18% 2019 34.9% 2018 21.5% 2017 -9.4% 2016 21.1% 2015 49.7% Fund Manager information for DSP World Mining Fund
Name Since Tenure Kaivalya Nadkarni 1 May 25 1.17 Yr. Data below for DSP World Mining Fund as on 30 Jun 26
Equity Sector Allocation
Sector Value Basic Materials 93.17% Energy 1.11% Asset Allocation
Asset Class Value Cash 5.71% Equity 94.28% Debt 0.01% Top Securities Holdings / Portfolio
Name Holding Value Quantity BGF World Mining I2
Investment Fund | -96% ₹180 Cr 141,035 Treps / Reverse Repo Investments
CBLO/Reverse Repo | -4% ₹7 Cr Net Receivables/Payables
Net Current Assets | -0% ₹0 Cr 2. DSP World Gold Fund
DSP World Gold Fund
Growth Launch Date 14 Sep 07 NAV (30 Jul 26) ₹50.4247 ↑ 1.63 (3.33 %) Net Assets (Cr) ₹1,433 on 30 Jun 26 Category Equity - Global AMC DSP BlackRock Invmt Managers Pvt. Ltd. Rating ☆☆☆ Risk High Expense Ratio 1.41 Sharpe Ratio 1.22 Information Ratio -0.5 Alpha Ratio 2.12 Min Investment 1,000 Min SIP Investment 500 Exit Load 0-12 Months (1%),12 Months and above(NIL) Growth of 10,000 investment over the years.
Date Value 31 Jul 21 ₹10,000 31 Jul 22 ₹7,373 31 Jul 23 ₹9,366 31 Jul 24 ₹11,150 31 Jul 25 ₹16,504 31 Jul 26 ₹26,355 Returns for DSP World Gold Fund
absolute basis & more than 1 year are on CAGR (Compound Annual Growth Rate) basis. as on 30 Jul 26 Duration Returns 1 Month 2.3% 3 Month -12.7% 6 Month -17.8% 1 Year 62.8% 3 Year 43.6% 5 Year 22.1% 10 Year 15 Year Since launch 8.9% Historical performance (Yearly) on absolute basis
Year Returns 2024 167.1% 2023 15.9% 2022 7% 2021 -7.7% 2020 -9% 2019 31.4% 2018 35.1% 2017 -10.7% 2016 -4% 2015 52.7% Fund Manager information for DSP World Gold Fund
Name Since Tenure Kaivalya Nadkarni 1 May 25 1.17 Yr. Data below for DSP World Gold Fund as on 30 Jun 26
Equity Sector Allocation
Sector Value Basic Materials 94.47% Asset Allocation
Asset Class Value Cash 3.62% Equity 94.47% Debt 0% Other 1.91% Top Securities Holdings / Portfolio
Name Holding Value Quantity BGF World Gold I2
Investment Fund | -68% ₹1,141 Cr 1,005,044 VanEck Gold Miners ETF
- | GDX29% ₹490 Cr 573,719 Treps / Reverse Repo Investments
CBLO/Reverse Repo | -3% ₹54 Cr Net Receivables/Payables
Net Current Assets | -0% -₹6 Cr 3. Edelweiss Emerging Markets Opportunities Equity Off-shore Fund
Edelweiss Emerging Markets Opportunities Equity Off-shore Fund
Growth Launch Date 7 Jul 14 NAV (30 Jul 26) ₹26.7341 ↑ 0.45 (1.70 %) Net Assets (Cr) ₹259 on 30 Jun 26 Category Equity - Global AMC Edelweiss Asset Management Limited Rating ☆☆☆ Risk High Expense Ratio 1.04 Sharpe Ratio 2.2 Information Ratio -0.41 Alpha Ratio 6.3 Min Investment 5,000 Min SIP Investment 1,000 Exit Load 0-1 Years (1%),1 Years and above(NIL) Growth of 10,000 investment over the years.
Date Value 31 Jul 21 ₹10,000 31 Jul 22 ₹7,821 31 Jul 23 ₹8,604 31 Jul 24 ₹9,029 31 Jul 25 ₹10,507 31 Jul 26 ₹16,349 Returns for Edelweiss Emerging Markets Opportunities Equity Off-shore Fund
absolute basis & more than 1 year are on CAGR (Compound Annual Growth Rate) basis. as on 30 Jul 26 Duration Returns 1 Month -7.1% 3 Month 0.6% 6 Month 12% 1 Year 50.9% 3 Year 22.8% 5 Year 9.7% 10 Year 15 Year Since launch 8.5% Historical performance (Yearly) on absolute basis
Year Returns 2024 41.1% 2023 5.9% 2022 5.5% 2021 -16.8% 2020 -5.9% 2019 21.7% 2018 25.1% 2017 -7.2% 2016 30% 2015 9.8% Fund Manager information for Edelweiss Emerging Markets Opportunities Equity Off-shore Fund
Name Since Tenure Bhavesh Jain 9 Apr 18 8.23 Yr. Bharat Lahoti 1 Oct 21 4.75 Yr. Data below for Edelweiss Emerging Markets Opportunities Equity Off-shore Fund as on 30 Jun 26
Equity Sector Allocation
Sector Value Technology 35.88% Financial Services 20.6% Consumer Cyclical 10.01% Communication Services 7.79% Industrials 5.82% Energy 5.13% Basic Materials 2.8% Consumer Defensive 1.98% Utility 1.27% Health Care 0.52% Asset Allocation
Asset Class Value Cash 6.04% Equity 93.14% Debt 0.01% Other 0.49% Top Securities Holdings / Portfolio
Name Holding Value Quantity JPM Emerging Mkts Opps I acc USD
Investment Fund | -96% ₹241 Cr 102,137
↑ 3,897 Clearing Corporation Of India Ltd.
CBLO/Reverse Repo | -4% ₹10 Cr Net Receivables/(Payables)
CBLO | -0% -₹1 Cr Accrued Interest
CBLO | -0% ₹0 Cr 4. Franklin Asian Equity Fund
Franklin Asian Equity Fund
Growth Launch Date 16 Jan 08 NAV (31 Jul 26) ₹44.1026 ↑ 2.12 (5.04 %) Net Assets (Cr) ₹979 on 30 Jun 26 Category Equity - Global AMC Franklin Templeton Asst Mgmt(IND)Pvt Ltd Rating ☆☆☆☆☆ Risk High Expense Ratio 2.54 Sharpe Ratio 1.54 Information Ratio 0 Alpha Ratio 0 Min Investment 5,000 Min SIP Investment 500 Exit Load 0-3 Years (1%),3 Years and above(NIL) Growth of 10,000 investment over the years.
Date Value 31 Jul 21 ₹10,000 31 Jul 22 ₹8,345 31 Jul 23 ₹8,886 31 Jul 24 ₹9,355 31 Jul 25 ₹10,562 31 Jul 26 ₹14,752 Returns for Franklin Asian Equity Fund
absolute basis & more than 1 year are on CAGR (Compound Annual Growth Rate) basis. as on 30 Jul 26 Duration Returns 1 Month -2.7% 3 Month 9.3% 6 Month 14.1% 1 Year 39.7% 3 Year 18.4% 5 Year 8.1% 10 Year 15 Year Since launch 8.3% Historical performance (Yearly) on absolute basis
Year Returns 2024 23.7% 2023 14.4% 2022 0.7% 2021 -14.5% 2020 -5.9% 2019 25.8% 2018 28.2% 2017 -13.6% 2016 35.5% 2015 7.2% Fund Manager information for Franklin Asian Equity Fund
Name Since Tenure Sandeep Manam 18 Oct 21 4.7 Yr. Shyam Sriram 26 Sep 24 1.76 Yr. Data below for Franklin Asian Equity Fund as on 30 Jun 26
Equity Sector Allocation
Sector Value Technology 32.45% Consumer Cyclical 15.53% Financial Services 11.03% Industrials 10.11% Health Care 5.7% Real Estate 4.83% Energy 3.46% Basic Materials 3.42% Communication Services 2.83% Utility 2.24% Consumer Defensive 1.74% Asset Allocation
Asset Class Value Cash 6.65% Equity 93.35% Top Securities Holdings / Portfolio
Name Holding Value Quantity Taiwan Semiconductor Manufacturing Co Ltd (Technology)
Equity, Since 31 Mar 09 | 23309% ₹81 Cr 114,000
↑ 41,000 Samsung Electronics Co Ltd (Technology)
Equity, Since 31 Mar 08 | 0059307% ₹62 Cr 30,867
↑ 8,934 SK Hynix Inc (Technology)
Equity, Since 30 Jun 20 | 0006605% ₹47 Cr 3,222
↑ 655 MediaTek Inc (Technology)
Equity, Since 31 Aug 20 | 24543% ₹25 Cr 19,000 ICICI Bank Ltd (Financial Services)
Equity, Since 31 Dec 25 | ICICIBANK3% ₹24 Cr 191,115
↑ 43,880 Yageo Corp (Technology)
Equity, Since 30 Jun 25 | 23272% ₹19 Cr 86,000 Tencent Holdings Ltd (Communication Services)
Equity, Since 31 Jul 14 | NNND2% ₹18 Cr 34,400
↑ 5,200 HDFC Bank Ltd (Financial Services)
Equity, Since 31 Dec 25 | HDFCBANK2% ₹17 Cr 224,505
↑ 71,852 Larsen & Toubro Ltd (Industrials)
Equity, Since 31 Mar 24 | LT2% ₹16 Cr 39,999
↑ 5,662 Eternal Ltd (Consumer Cyclical)
Equity, Since 31 Jul 21 | ETERNAL2% ₹16 Cr 639,163
↑ 237,879 5. DSP World Energy Fund
DSP World Energy Fund
Growth Launch Date 14 Aug 09 NAV (30 Jul 26) ₹28.3086 ↑ 0.67 (2.42 %) Net Assets (Cr) ₹117 on 30 Jun 26 Category Equity - Global AMC DSP BlackRock Invmt Managers Pvt. Ltd. Rating ☆☆ Risk High Expense Ratio 1.18 Sharpe Ratio 2.76 Information Ratio 0 Alpha Ratio 0 Min Investment 1,000 Min SIP Investment 500 Exit Load 0-12 Months (1%),12 Months and above(NIL) Growth of 10,000 investment over the years.
Date Value 31 Jul 21 ₹10,000 31 Jul 22 ₹9,575 31 Jul 23 ₹11,538 31 Jul 24 ₹11,246 31 Jul 25 ₹12,513 31 Jul 26 ₹17,462 Returns for DSP World Energy Fund
absolute basis & more than 1 year are on CAGR (Compound Annual Growth Rate) basis. as on 30 Jul 26 Duration Returns 1 Month -5.4% 3 Month -4.6% 6 Month 8.2% 1 Year 39.5% 3 Year 15.2% 5 Year 11.9% 10 Year 15 Year Since launch 6.3% Historical performance (Yearly) on absolute basis
Year Returns 2024 39.2% 2023 -6.8% 2022 12.9% 2021 -8.6% 2020 29.5% 2019 0% 2018 18.2% 2017 -11.3% 2016 -1.9% 2015 22.5% Fund Manager information for DSP World Energy Fund
Name Since Tenure Kaivalya Nadkarni 1 May 25 1.17 Yr. Data below for DSP World Energy Fund as on 30 Jun 26
Equity Sector Allocation
Sector Value Industrials 36.73% Utility 22.76% Technology 22.09% Basic Materials 9.94% Consumer Cyclical 0.71% Asset Allocation
Asset Class Value Cash 7.75% Equity 92.23% Debt 0.02% Top Securities Holdings / Portfolio
Name Holding Value Quantity BGF Sustainable Energy I2
Investment Fund | -97% ₹118 Cr 404,670 Treps / Reverse Repo Investments
CBLO/Reverse Repo | -3% ₹4 Cr Net Receivables/Payables
Net Current Assets | -0% ₹0 Cr 6. Kotak Global Emerging Market Fund
Kotak Global Emerging Market Fund
Growth Launch Date 26 Sep 07 NAV (30 Jul 26) ₹36.475 ↑ 0.10 (0.28 %) Net Assets (Cr) ₹1,767 on 30 Jun 26 Category Equity - Global AMC Kotak Mahindra Asset Management Co Ltd Rating ☆☆☆ Risk High Expense Ratio 1.64 Sharpe Ratio 1.88 Information Ratio -0.25 Alpha Ratio -1.76 Min Investment 5,000 Min SIP Investment 1,000 Exit Load 0-1 Years (1%),1 Years and above(NIL) Growth of 10,000 investment over the years.
Date Value 31 Jul 21 ₹10,000 31 Jul 22 ₹8,472 31 Jul 23 ₹9,265 31 Jul 24 ₹9,876 31 Jul 25 ₹11,685 31 Jul 26 ₹17,135 Returns for Kotak Global Emerging Market Fund
absolute basis & more than 1 year are on CAGR (Compound Annual Growth Rate) basis. as on 30 Jul 26 Duration Returns 1 Month -10.7% 3 Month -3% 6 Month 6.2% 1 Year 38.8% 3 Year 20.6% 5 Year 10.2% 10 Year 15 Year Since launch 7.1% Historical performance (Yearly) on absolute basis
Year Returns 2024 39.1% 2023 5.9% 2022 10.8% 2021 -15% 2020 -0.5% 2019 29.1% 2018 21.4% 2017 -14.4% 2016 30.4% 2015 -1.2% Fund Manager information for Kotak Global Emerging Market Fund
Name Since Tenure Arjun Khanna 9 May 19 7.15 Yr. Data below for Kotak Global Emerging Market Fund as on 30 Jun 26
Equity Sector Allocation
Sector Value Technology 43.42% Financial Services 19.61% Industrials 8.58% Consumer Cyclical 8.12% Basic Materials 6.67% Communication Services 5.05% Energy 4.51% Health Care 0.71% Asset Allocation
Asset Class Value Cash 3.32% Equity 96.68% Top Securities Holdings / Portfolio
Name Holding Value Quantity CI Emerging Markets Class A
Investment Fund | -98% ₹1,762 Cr 4,589,366
↑ 100,988 Triparty Repo
CBLO/Reverse Repo | -2% ₹33 Cr Net Current Assets/(Liabilities)
Net Current Assets | -0% -₹2 Cr 7. DSP US Flexible Equity Fund
DSP US Flexible Equity Fund
Growth Launch Date 3 Aug 12 NAV (30 Jul 26) ₹90.0193 ↑ 0.77 (0.86 %) Net Assets (Cr) ₹1,291 on 30 Jun 26 Category Equity - Global AMC DSP BlackRock Invmt Managers Pvt. Ltd. Rating ☆☆☆☆☆ Risk High Expense Ratio 1.55 Sharpe Ratio 1.93 Information Ratio 0.15 Alpha Ratio -4.1 Min Investment 1,000 Min SIP Investment 500 Exit Load 0-12 Months (1%),12 Months and above(NIL) Growth of 10,000 investment over the years.
Date Value 31 Jul 21 ₹10,000 31 Jul 22 ₹10,023 31 Jul 23 ₹11,458 31 Jul 24 ₹13,332 31 Jul 25 ₹16,454 31 Jul 26 ₹22,370 Returns for DSP US Flexible Equity Fund
absolute basis & more than 1 year are on CAGR (Compound Annual Growth Rate) basis. as on 30 Jul 26 Duration Returns 1 Month -4.1% 3 Month 1.5% 6 Month 11.7% 1 Year 36.9% 3 Year 24.6% 5 Year 17.2% 10 Year 15 Year Since launch 17% Historical performance (Yearly) on absolute basis
Year Returns 2024 33.8% 2023 17.8% 2022 22% 2021 -5.9% 2020 24.2% 2019 22.6% 2018 27.5% 2017 -1.1% 2016 15.5% 2015 9.8% Fund Manager information for DSP US Flexible Equity Fund
Name Since Tenure Kaivalya Nadkarni 1 May 25 1.17 Yr. Data below for DSP US Flexible Equity Fund as on 30 Jun 26
Equity Sector Allocation
Sector Value Technology 33.05% Industrials 13.62% Financial Services 12.17% Communication Services 12.05% Consumer Cyclical 9.62% Health Care 7.65% Basic Materials 2.45% Energy 2.43% Asset Allocation
Asset Class Value Cash 6.96% Equity 93.02% Debt 0.01% Top Securities Holdings / Portfolio
Name Holding Value Quantity BGF US Flexible Equity I2
Investment Fund | -96% ₹1,265 Cr 1,784,131
↓ -32,921 Treps / Reverse Repo Investments
CBLO/Reverse Repo | -4% ₹59 Cr Net Receivables/Payables
Net Current Assets | -0% -₹2 Cr 8. Invesco India Feeder- Invesco Pan European Equity Fund
Invesco India Feeder- Invesco Pan European Equity Fund
Growth Launch Date 31 Jan 14 NAV (30 Jul 26) ₹26.678 ↑ 0.31 (1.18 %) Net Assets (Cr) ₹219 on 30 Jun 26 Category Equity - Global AMC Invesco Asset Management (India) Private Ltd Rating ☆☆☆ Risk High Expense Ratio 0.95 Sharpe Ratio 1.61 Information Ratio 0 Alpha Ratio 0 Min Investment 5,000 Min SIP Investment 500 Exit Load 0-1 Years (1%),1 Years and above(NIL) Growth of 10,000 investment over the years.
Date Value 31 Jul 21 ₹10,000 31 Jul 22 ₹9,030 31 Jul 23 ₹11,921 31 Jul 24 ₹12,549 31 Jul 25 ₹14,586 31 Jul 26 ₹20,295 Returns for Invesco India Feeder- Invesco Pan European Equity Fund
absolute basis & more than 1 year are on CAGR (Compound Annual Growth Rate) basis. as on 30 Jul 26 Duration Returns 1 Month 2.6% 3 Month 8.1% 6 Month 9.8% 1 Year 36.1% 3 Year 19% 5 Year 14.9% 10 Year 15 Year Since launch 8.2% Historical performance (Yearly) on absolute basis
Year Returns 2024 42.5% 2023 -5.1% 2022 20.5% 2021 1.6% 2020 16.6% 2019 1.6% 2018 17.2% 2017 -11.2% 2016 14.8% 2015 -0.2% Fund Manager information for Invesco India Feeder- Invesco Pan European Equity Fund
Name Since Tenure Sagar Gandhi 1 Mar 25 1.33 Yr. Data below for Invesco India Feeder- Invesco Pan European Equity Fund as on 30 Jun 26
Equity Sector Allocation
Sector Value Industrials 24.69% Financial Services 20.7% Technology 9.93% Health Care 7.76% Consumer Defensive 7.69% Basic Materials 6.95% Energy 6.06% Utility 4.4% Consumer Cyclical 3.34% Communication Services 3.11% Asset Allocation
Asset Class Value Cash 5.32% Equity 94.64% Debt 0.04% Top Securities Holdings / Portfolio
Name Holding Value Quantity Invesco Pan European Equity C EUR Acc
Investment Fund | -95% ₹211 Cr 463,645
↑ 77,694 Triparty Repo
CBLO/Reverse Repo | -5% ₹10 Cr Net Receivables / (Payables)
CBLO | -0% ₹0 Cr
ಅಂತರರಾಷ್ಟ್ರೀಯ ಮ್ಯೂಚುಯಲ್ ಫಂಡ್ಗಳ ವಿಧಗಳು
1. ಉದಯೋನ್ಮುಖ ಮಾರುಕಟ್ಟೆ ನಿಧಿಗಳು
ಈ ರೀತಿಯ ಮ್ಯೂಚುವಲ್ ಫಂಡ್ ಭಾರತ, ಚೀನಾ, ರಷ್ಯಾ, ಬ್ರೆಜಿಲ್ ಮುಂತಾದ ಉದಯೋನ್ಮುಖ ಮಾರುಕಟ್ಟೆಗಳಲ್ಲಿ ಹೂಡಿಕೆ ಮಾಡುತ್ತದೆ. ಚೀನಾವು USA ಯನ್ನು ಮೀರಿಸಿ ವಿಶ್ವದ ಅತಿದೊಡ್ಡ ಕಾರು ಉತ್ಪಾದಕವಾಗಿದೆ. ನೈಸರ್ಗಿಕ ಅನಿಲದಲ್ಲಿ ರಷ್ಯಾ ದೊಡ್ಡ ಆಟಗಾರ. ಭಾರತವು ವೇಗವಾಗಿ ಬೆಳೆಯುತ್ತಿರುವ ಸೇವಾ ಆರ್ಥಿಕ ನೆಲೆಯನ್ನು ಹೊಂದಿದೆ. ಈ ದೇಶಗಳು ಮುಂಬರುವ ವರ್ಷಗಳಲ್ಲಿ ಮಹತ್ತರವಾಗಿ ಬೆಳೆಯುವ ನಿರೀಕ್ಷೆಯಿದೆ, ಇದರಿಂದಾಗಿ ಹೂಡಿಕೆದಾರರಿಗೆ ಬಿಸಿ ಆಯ್ಕೆಯಾಗಿದೆ.
ಉದಯೋನ್ಮುಖ ಮಾರುಕಟ್ಟೆಗಳಲ್ಲಿ ಹೂಡಿಕೆ ಮಾಡುವ ಕೆಲವು ಅತ್ಯುತ್ತಮ ಅಂತರಾಷ್ಟ್ರೀಯ ಮ್ಯೂಚುಯಲ್ ಫಂಡ್ ಯೋಜನೆಗಳೆಂದರೆ ಬಿರ್ಲಾ ಸನ್ ಲೈಫ್ ಇಂಟರ್ನ್ಯಾಷನಲ್ ಇಕ್ವಿಟಿ ಪ್ಲಾನ್ ಎ, ಕೋಟಕ್ ಗ್ಲೋಬಲ್ ಎಮರ್ಜಿಂಗ್ ಮಾರ್ಕೆಟ್ ಫಂಡ್ ಮತ್ತು ಪ್ರಿನ್ಸಿಪಲ್ ಗ್ಲೋಬಲ್ ಆಪರ್ಚುನಿಟೀಸ್ ಫಂಡ್.
Talk to our investment specialist
2. ಅಭಿವೃದ್ಧಿ ಹೊಂದಿದ ಮಾರುಕಟ್ಟೆ ನಿಧಿಗಳು
ಅಭಿವೃದ್ಧಿ ಹೊಂದಿದ ಮಾರುಕಟ್ಟೆ ನಿಧಿಗಳು ಆಕರ್ಷಕವಾದ ಆಯ್ಕೆಯಾಗಿದೆ ಏಕೆಂದರೆ ಪ್ರಬುದ್ಧ ಮಾರುಕಟ್ಟೆಗಳು ಹೆಚ್ಚು ಸ್ಥಿರವಾಗಿರುತ್ತವೆ ಎಂದು ಸಾಮಾನ್ಯವಾಗಿ ಕಂಡುಬರುತ್ತದೆ. ಅಲ್ಲದೆ, ಅವರು ಆರ್ಥಿಕತೆ ಅಥವಾ ಆರ್ಥಿಕತೆಯಲ್ಲಿನ ಕರೆನ್ಸಿ ಅಪಾಯ, ರಾಜಕೀಯ ಅಸ್ಥಿರತೆ, ಇತ್ಯಾದಿಗಳಂತಹ ಉದಯೋನ್ಮುಖ ಮಾರುಕಟ್ಟೆಗಳಿಗೆ ಸಂಬಂಧಿಸಿದ ಸಮಸ್ಯೆಗಳನ್ನು ಹೊಂದಿಲ್ಲ. ಅಭಿವೃದ್ಧಿ ಹೊಂದಿದ ಮಾರುಕಟ್ಟೆಗಳಲ್ಲಿ ಹೂಡಿಕೆ ಮಾಡುವ ಕೆಲವು ಯೋಜನೆಗಳು DWS ಗ್ಲೋಬಲ್ ಥೆಮ್ಯಾಟಿಕ್ಕಡಲಾಚೆಯ ನಿಧಿ ಇತ್ಯಾದಿ.
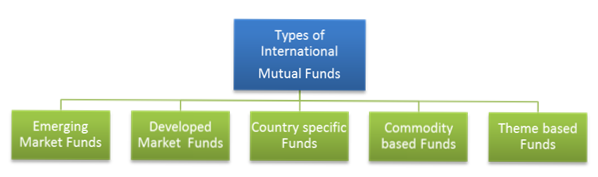
3. ದೇಶದ ನಿರ್ದಿಷ್ಟ ನಿಧಿಗಳು
ಹೆಸರೇ ಸೂಚಿಸುವಂತೆ, ಈ ಪ್ರಕಾರವು ನಿರ್ದಿಷ್ಟ ದೇಶ ಅಥವಾ ಜಗತ್ತಿನ ಭಾಗದಲ್ಲಿ ಮಾತ್ರ ಹೂಡಿಕೆ ಮಾಡುತ್ತದೆ. ಆದರೆ, ದೇಶ-ನಿರ್ದಿಷ್ಟ ನಿಧಿಗಳು ಪೋರ್ಟ್ಫೋಲಿಯೊವನ್ನು ವೈವಿಧ್ಯಗೊಳಿಸುವ ಸಂಪೂರ್ಣ ಉದ್ದೇಶವನ್ನು ಸೋಲಿಸುತ್ತವೆ ಏಕೆಂದರೆ ಅದು ಎಲ್ಲಾ ಮೊಟ್ಟೆಗಳನ್ನು ಒಂದೇ ಬುಟ್ಟಿಯಲ್ಲಿ ಇಡುತ್ತದೆ. ಆದಾಗ್ಯೂ, ವಿವಿಧ ಕಾರಣಗಳಿಂದಾಗಿ ನಿರ್ದಿಷ್ಟ ದೇಶಗಳಲ್ಲಿ ಅವಕಾಶಗಳು ಇದ್ದಾಗ, ಈ ನಿಧಿಗಳು ಉತ್ತಮ ಆಯ್ಕೆಯಾಗುತ್ತವೆ.
ರಿಲಯನ್ಸ್ ಜಪಾನ್ಈಕ್ವಿಟಿ ಫಂಡ್, ಕೋಟಾಕ್ US ಇಕ್ವಿಟೀಸ್ ಫಂಡ್ ಮತ್ತುಮಿರೇ ಅಸೆಟ್ ಚೀನಾ ಅಡ್ವಾಂಟೇಜ್ ಫಂಡ್ ಕೆಲವು ದೇಶ-ನಿರ್ದಿಷ್ಟ ಯೋಜನೆಗಳಾಗಿವೆ.
4. ಸರಕು ಆಧಾರಿತ ನಿಧಿಗಳು
ಈ ನಿಧಿಗಳು ಚಿನ್ನ, ಬೆಲೆಬಾಳುವ ಲೋಹಗಳು, ಕಚ್ಚಾ ತೈಲ, ಗೋಧಿ ಮುಂತಾದ ಸರಕುಗಳಲ್ಲಿ ಹೂಡಿಕೆ ಮಾಡುತ್ತವೆ. ಸರಕುಗಳು ವೈವಿಧ್ಯೀಕರಣವನ್ನು ನೀಡುತ್ತವೆ ಮತ್ತು ಹಾಗೆಯೇ ಕಾರ್ಯನಿರ್ವಹಿಸುತ್ತವೆಹಣದುಬ್ಬರ ಹೆಡ್ಜ್, ಹೀಗೆ ಹೂಡಿಕೆದಾರರನ್ನು ರಕ್ಷಿಸುತ್ತದೆ. ಅಲ್ಲದೆ, ಈ ನಿಧಿಗಳು ಬಹು-ಸರಕು ಆಗಿರಬಹುದು ಅಥವಾ ಒಂದೇ ಸರಕುಗಳ ಮೇಲೆ ಕೇಂದ್ರೀಕರಿಸಬಹುದು.
ಅತ್ಯುತ್ತಮ ಸರಕು ಆಧಾರಿತ ಅಂತರರಾಷ್ಟ್ರೀಯ ಮ್ಯೂಚುಯಲ್ ಫಂಡ್ಗಳು ಡಿಎಸ್ಪಿ ಬ್ಲ್ಯಾಕ್ ರಾಕ್ ವರ್ಲ್ಡ್ ಗೋಲ್ಡ್ ಫಂಡ್, ಐಎನ್ಜಿ ಆಪ್ಟಿಮಿಕ್ಸ್ ಗ್ಲೋಬಲ್ ಕಮೊಡಿಟೀಸ್, ಮಿರೇ ಅಸೆಟ್ ಗ್ಲೋಬಲ್ ಕಮಾಡಿಟಿ ಸ್ಟಾಕ್ಗಳು, ಬಿರ್ಲಾ ಸನ್ ಲೈಫ್ ಕಮಾಡಿಟಿ ಇಕ್ವಿಟೀಸ್ - ಗ್ಲೋಬಲ್ ಅಗ್ರಿ ಫಂಡ್, ಇತ್ಯಾದಿ.
5. ಥೀಮ್ ಆಧಾರಿತ ನಿಧಿಗಳು
ಥೀಮ್ ಆಧಾರಿತ ನಿಧಿಗಳು ಅಥವಾ ವಿಷಯಾಧಾರಿತ ನಿಧಿಗಳು ನಿರ್ದಿಷ್ಟ ಥೀಮ್ನಲ್ಲಿ ಹೂಡಿಕೆ ಮಾಡುತ್ತವೆ. ಉದಾಹರಣೆಗೆ, ಥೀಮ್ ಮೂಲಸೌಕರ್ಯವಾಗಿದ್ದರೆ, ಇದು ಮೂಲಸೌಕರ್ಯ ನಿರ್ಮಾಣ ಕಂಪನಿಗಳು ಮತ್ತು ಸಿಮೆಂಟ್, ಸ್ಟೀಲ್ ಮುಂತಾದ ಮೂಲಸೌಕರ್ಯ ವ್ಯವಹಾರಕ್ಕೆ ಸಂಬಂಧಿಸಿದ ಕಂಪನಿಗಳಲ್ಲಿ ಹೂಡಿಕೆ ಮಾಡುತ್ತದೆ.
ನಿರ್ದಿಷ್ಟ ಉದ್ಯಮದ ಮೇಲೆ ಮಾತ್ರ ಕೇಂದ್ರೀಕರಿಸುವ ವಲಯದ ನಿಧಿಗಳೊಂದಿಗೆ ಅವರು ಸಾಮಾನ್ಯವಾಗಿ ಗೊಂದಲಕ್ಕೊಳಗಾಗುತ್ತಾರೆ. ಉದಾಹರಣೆಗೆ, ಔಷಧೀಯ ವಲಯದ ನಿಧಿಗಳು ಔಷಧ ಕಂಪನಿಗಳಲ್ಲಿ ಮಾತ್ರ ಹೂಡಿಕೆ ಮಾಡುತ್ತವೆ. ಹೋಲಿಸಿದಾಗವಲಯ ನಿಧಿಗಳು, ವಿಷಯಾಧಾರಿತ ನಿಧಿಗಳು ವಿಶಾಲವಾದ ಪರಿಕಲ್ಪನೆಯಾಗಿದೆ. ಹೂಡಿಕೆಯು ವಿವಿಧ ಕೈಗಾರಿಕೆಗಳಲ್ಲಿ ಹರಡಿರುವುದರಿಂದ ಇದು ಹೆಚ್ಚು ವೈವಿಧ್ಯತೆ ಮತ್ತು ಕಡಿಮೆ ಅಪಾಯವನ್ನು ನೀಡುತ್ತದೆ.
ಕೆಲವು ಥೀಮ್ ಆಧಾರಿತ ನಿಧಿಗಳು DSPBR ವರ್ಲ್ಡ್ ಎನರ್ಜಿ ಫಂಡ್, L&T ಗ್ಲೋಬಲ್ ರಿಯಲ್ ಅಸೆಟ್ಸ್ ಫಂಡ್ ಇತ್ಯಾದಿ.
ಅಂತರಾಷ್ಟ್ರೀಯ ಮ್ಯೂಚುಯಲ್ ಫಂಡ್ಗಳಲ್ಲಿ ಏಕೆ ಹೂಡಿಕೆ ಮಾಡಬೇಕು?
1. ವೈವಿಧ್ಯೀಕರಣ
ಮುಖ್ಯ ಉದ್ದೇಶಹೂಡಿಕೆ ಅಂತರರಾಷ್ಟ್ರೀಯ ಮ್ಯೂಚುಯಲ್ ಫಂಡ್ಗಳಲ್ಲಿ ವೈವಿಧ್ಯೀಕರಣವಾಗಿದೆ. ವೈವಿಧ್ಯೀಕರಣವು ಆದಾಯವನ್ನು ಉತ್ತಮಗೊಳಿಸಲು ಮತ್ತು ಪೋರ್ಟ್ಫೋಲಿಯೊದ ಒಟ್ಟಾರೆ ಅಪಾಯಗಳನ್ನು ಕಡಿಮೆ ಮಾಡಲು ಸಹಾಯ ಮಾಡುತ್ತದೆ. ಹೂಡಿಕೆಗಳ ನಡುವಿನ ಕಡಿಮೆ ಅಥವಾ ಋಣಾತ್ಮಕ ಸಂಬಂಧಗಳು ಆದಾಯವು ಕೇವಲ ಒಂದು ವಲಯ ಅಥವಾ ಆರ್ಥಿಕತೆಯ ಮೇಲೆ ಅವಲಂಬಿತವಾಗಿಲ್ಲ ಎಂದು ಖಚಿತಪಡಿಸುತ್ತದೆ. ಹೀಗಾಗಿ, ಪೋರ್ಟ್ಫೋಲಿಯೊವನ್ನು ಸಮತೋಲನಗೊಳಿಸುವುದು ಮತ್ತು ಹೂಡಿಕೆದಾರರನ್ನು ರಕ್ಷಿಸುವುದು.
2. ಹೂಡಿಕೆಯಲ್ಲಿ ಸುಲಭ
ಈಕ್ವಿಟಿಗಳು, ಸರಕುಗಳು, ರಿಯಲ್ ಎಸ್ಟೇಟ್ ಮತ್ತು ವಿನಿಮಯ-ವಹಿವಾಟು ನಿಧಿಗಳ ಮೂಲಕ ವಿದೇಶಿ ಮಾರುಕಟ್ಟೆಗಳಲ್ಲಿ ನೇರ ಹೂಡಿಕೆ ಮಾಡುವ ಮೂಲಕ ನಿಮ್ಮ ಪೋರ್ಟ್ಫೋಲಿಯೊಗೆ ನೀವು ಜಾಗತಿಕ ಅಂಚನ್ನು ನೀಡಬಹುದು (ಇಟಿಎಫ್ಗಳು) ಹಾಗೂ. ಅಂತರರಾಷ್ಟ್ರೀಯ ಮ್ಯೂಚುಯಲ್ ಫಂಡ್ನ ಘಟಕಗಳನ್ನು ಖರೀದಿಸುವುದು ತುಂಬಾ ಸುಲಭ ಮತ್ತು ಅವರು ಇತರ ಹೂಡಿಕೆ ಮಾರ್ಗಗಳಲ್ಲಿ ಲಭ್ಯವಿಲ್ಲದ ನಿಧಿ ವ್ಯವಸ್ಥಾಪಕರ ಪರಿಣತಿಯನ್ನು ಸಹ ಒದಗಿಸುತ್ತಾರೆ.
3. ಅಂತಾರಾಷ್ಟ್ರೀಯ ಮಾನ್ಯತೆ
ಅಂತರರಾಷ್ಟ್ರೀಯ ಮ್ಯೂಚುಯಲ್ ಫಂಡ್ಗಳು ದೇಶೀಯ ಗಡಿಗಳನ್ನು ಮೀರಿ ಹೂಡಿಕೆದಾರರ ಪರಿಧಿಯನ್ನು ವಿಸ್ತರಿಸಲು ಸಹಾಯ ಮಾಡುತ್ತವೆ. ಅಲ್ಲದೆ, ಅಂತರರಾಷ್ಟ್ರೀಯ ಮಟ್ಟದಲ್ಲಿ ಹೂಡಿಕೆಯು ಹೂಡಿಕೆದಾರರು ದೇಶೀಯ ಮಾರುಕಟ್ಟೆಯಲ್ಲಿ ಉಂಟಾದ ಯಾವುದೇ ನಷ್ಟವನ್ನು ಹೊಂದಿಸಲು ಸಹಾಯ ಮಾಡುತ್ತದೆ.
4. ಕರೆನ್ಸಿ ಏರಿಳಿತಗಳು
ಅಂತರಾಷ್ಟ್ರೀಯ ಮ್ಯೂಚುವಲ್ ಫಂಡ್ ಯೋಜನೆಗಳು ನಿರ್ಧರಿಸುತ್ತವೆಅವು ಅಲ್ಲ ಚಾಲ್ತಿಯಲ್ಲಿರುವ ವಿನಿಮಯ ದರವನ್ನು ಬಳಸಿಕೊಂಡು ನಿಧಿಯ (ನಿವ್ವಳ ಆಸ್ತಿ ಮೌಲ್ಯ). ವಿನಿಮಯ ದರಗಳು ಪ್ರತಿದಿನ ಅಥವಾ ಹೆಚ್ಚು ಪ್ರತಿ ನಿಮಿಷದಲ್ಲಿ ಏರಿಳಿತಗೊಳ್ಳುತ್ತವೆ.
ಇದರರ್ಥ US ಡಾಲರ್ಗಳಲ್ಲಿ ಹೂಡಿಕೆ ಮಾಡುವ ಯೋಜನೆಗೆ, ಡಾಲರ್-ರೂಪಾಯಿ ಚಲನೆಯ ಪ್ರಕಾರ ಯೋಜನೆಯ NAV ಮೇಲೆ ಪರಿಣಾಮ ಬೀರುತ್ತದೆ. ರೂಪಾಯಿ ಮೌಲ್ಯ ಹೆಚ್ಚು ಕಡಿಮೆಯಾದಷ್ಟೂ ಲಾಭ ಹೆಚ್ಚುತ್ತದೆ ಎಂದು ಗಮನಿಸಲಾಗಿದೆ. ರೂಪಾಯಿ ಮೌಲ್ಯವು ಈಗ ಕುಸಿಯುತ್ತಿರುವ ಕಾರಣ ಇದು ಅಂತಾರಾಷ್ಟ್ರೀಯ ಮ್ಯೂಚುವಲ್ ಫಂಡ್ಗಳನ್ನು ಇನ್ನಷ್ಟು ಆಕರ್ಷಕವಾಗಿಸುತ್ತದೆ.
5. ದೇಶದ ನಿರ್ದಿಷ್ಟ ಮಾನ್ಯತೆಗಳು
ಹೂಡಿಕೆದಾರರು ಮತ್ತೊಂದು ದೇಶದ ಬೆಳವಣಿಗೆಯ ಸಂಪೂರ್ಣ ಲಾಭವನ್ನು ಪಡೆಯಲು ಬಯಸಿದರೆ, ಅಂತರರಾಷ್ಟ್ರೀಯ ಮ್ಯೂಚುವಲ್ ಫಂಡ್ಗಳು ಹೋಗಲು ದಾರಿ. ಆದರೆಫ್ಲಿಪ್ ಮಾಡಿ ಇದರ ಬದಿಯಲ್ಲಿ ಪೋರ್ಟ್ಫೋಲಿಯೊ ಕೇವಲ ಒಂದು ಆರ್ಥಿಕತೆಯ ಮೇಲೆ ಅವಲಂಬಿತವಾಗಿದೆ. ಆದ್ದರಿಂದ, ಅಪಾಯವನ್ನು ಹೆಚ್ಚಿಸುತ್ತದೆಅಂಶ.
ಅಂತರರಾಷ್ಟ್ರೀಯ ಮ್ಯೂಚುಯಲ್ ಫಂಡ್ಗಳ ತೆರಿಗೆ
ಭಾರತದಲ್ಲಿ ಅಂತರಾಷ್ಟ್ರೀಯ ಮ್ಯೂಚುಯಲ್ ಫಂಡ್ಗಳ ತೆರಿಗೆ ಚಿಕಿತ್ಸೆಯು ಇದೇ ರೀತಿಯದ್ದಾಗಿದೆಸಾಲ ನಿಧಿ. ಹೂಡಿಕೆದಾರರು ಅಲ್ಪಾವಧಿಯ ಹೂಡಿಕೆಗಳನ್ನು ಹೊಂದಿದ್ದರೆ, ಅಂದರೆ ಕಡಿಮೆ36 ತಿಂಗಳುಗಳು, ಅವರು ಅವರ ಒಟ್ಟು ಸೇರಿಸಲಾಗುವುದುಆದಾಯ ಮತ್ತು ಅನ್ವಯವಾಗುವ ಸ್ಲ್ಯಾಬ್ ದರದ ಪ್ರಕಾರ ತೆರಿಗೆ ವಿಧಿಸಲಾಗುತ್ತದೆ.
ಹೂಡಿಕೆಗಳನ್ನು 36 ತಿಂಗಳುಗಳಿಗಿಂತ ಹೆಚ್ಚು ಕಾಲ ಇರಿಸಿದರೆ, ಹೂಡಿಕೆದಾರರು ಸೂಚ್ಯಂಕ ಪ್ರಯೋಜನಗಳಿಗೆ ಅರ್ಹರಾಗಿರುತ್ತಾರೆ. ಯೋಜನೆಗಳಿಂದ ಉಂಟಾಗುವ ಯಾವುದೇ ಲಾಭಗಳಿಗೆ ತೆರಿಗೆ ವಿಧಿಸಲಾಗುತ್ತದೆ@ 10% ಸೂಚ್ಯಂಕವಿಲ್ಲದೆ ಅಥವಾ20% ಸೂಚ್ಯಂಕದೊಂದಿಗೆ.
ಇಂಟರ್ನ್ಯಾಷನಲ್ ಮ್ಯೂಚುವಲ್ ಫಂಡ್ ಆನ್ಲೈನ್ನಲ್ಲಿ ಹೂಡಿಕೆ ಮಾಡುವುದು ಹೇಗೆ?
Fincash.com ನಲ್ಲಿ ಜೀವಮಾನಕ್ಕಾಗಿ ಉಚಿತ ಹೂಡಿಕೆ ಖಾತೆಯನ್ನು ತೆರೆಯಿರಿ.
ನಿಮ್ಮ ನೋಂದಣಿ ಮತ್ತು KYC ಪ್ರಕ್ರಿಯೆಯನ್ನು ಪೂರ್ಣಗೊಳಿಸಿ
ದಾಖಲೆಗಳನ್ನು ಅಪ್ಲೋಡ್ ಮಾಡಿ (PAN, ಆಧಾರ್, ಇತ್ಯಾದಿ).ಮತ್ತು, ನೀವು ಹೂಡಿಕೆ ಮಾಡಲು ಸಿದ್ಧರಿದ್ದೀರಿ!
ತಜ್ಞರ ಪ್ರಕಾರ, ಹೂಡಿಕೆದಾರರು ಅಂತರರಾಷ್ಟ್ರೀಯ ಮ್ಯೂಚುವಲ್ ಫಂಡ್ಗಳಲ್ಲಿ ಹೂಡಿಕೆ ಮಾಡಿದ ಬಂಡವಾಳದ ಸುಮಾರು 10-12% ಅನ್ನು ಹೊಂದಿರಬೇಕು. ಆದ್ದರಿಂದ ಈಗ ಒಳಗೊಂಡಿರುವ ಮೂಲಭೂತ ವಿಷಯಗಳೊಂದಿಗೆ, ಇಂದು ಅಂತರಾಷ್ಟ್ರೀಯ ಮ್ಯೂಚುವಲ್ ಫಂಡ್ಗಳೊಂದಿಗೆ ಆ ಪೋರ್ಟ್ಫೋಲಿಯೊವನ್ನು ನಿರ್ಮಿಸಲು ಪ್ರಾರಂಭಿಸಿ.
FAQ ಗಳು
1. ಅಂತರಾಷ್ಟ್ರೀಯ ಮ್ಯೂಚುವಲ್ ಫಂಡ್ಗಳಲ್ಲಿ ಹೂಡಿಕೆ ಮಾಡುವುದರಿಂದ ಏನು ಪ್ರಯೋಜನ?
ಉ: ಇದು ನಿಮ್ಮ ಹೂಡಿಕೆಯ ಬಂಡವಾಳವನ್ನು ವೈವಿಧ್ಯಗೊಳಿಸುತ್ತದೆ, ಇದು ನಿಮಗೆ ಉತ್ತಮ ಮತ್ತು ವೈವಿಧ್ಯಮಯ ಆದಾಯವನ್ನು ನೀಡುತ್ತದೆ. ಇದು ನಿಮ್ಮ ಪೋರ್ಟ್ಫೋಲಿಯೊವನ್ನು ಸಮತೋಲಿತವಾಗಿರಿಸುತ್ತದೆ. ಈ ಕಂಪನಿಗಳು ವಿದೇಶಿ ಹಣವನ್ನು ಹೊಂದಿರುವುದರಿಂದ, ನಿಮ್ಮ ಹೂಡಿಕೆಯು ಉತ್ತಮ ಆದಾಯವನ್ನು ನೀಡುತ್ತದೆ ಎಂದು ನೀವು ನಿರೀಕ್ಷಿಸಬಹುದು.
2. ಭಾರತಕ್ಕಿಂತ ಕಡಿಮೆ ಬೆಳವಣಿಗೆಯನ್ನು ಹೊಂದಿರುವ ಕಂಪನಿಗಳಲ್ಲಿ ನಾನು ಹೂಡಿಕೆ ಮಾಡಬಹುದೇ?
ಉ: ಹೌದು, ನೀವು ಮಾಡಬಹುದು, ಆದರೆ ಇದು ನೀವು ಹೂಡಿಕೆ ಮಾಡುತ್ತಿರುವ ಹಣಕಾಸು ಸಂಸ್ಥೆಯ ಮೇಲೆ ಅವಲಂಬಿತವಾಗಿರುತ್ತದೆ. ನೀವು ವಿದೇಶಿ ಕಂಪನಿಯ ಭದ್ರತೆಗಳಲ್ಲಿ ನೇರವಾಗಿ ಹೂಡಿಕೆ ಮಾಡಲಾಗುವುದಿಲ್ಲ. ನಿರ್ದಿಷ್ಟ ಭದ್ರತೆಯಲ್ಲಿ ಹೂಡಿಕೆ ಮಾಡಲು ನಿಮಗೆ ಸಹಾಯ ಮಾಡಲು ಬ್ರೋಕರ್ ಅಥವಾ ಹಣಕಾಸು ಸಂಸ್ಥೆಯ ಅಗತ್ಯವಿರುತ್ತದೆ.
3. ಫ್ರಾಂಕ್ಲಿನ್ ಇಂಡಿಯಾ ಫೀಡರ್ ಎಂದರೇನು?
ಉ: ಫ್ರಾಂಕ್ಲಿನ್ ಇಂಡಿಯಾ ಫೀಡರ್ ಅಥವಾ ಫ್ರಾಂಕ್ಲಿನ್ ಯುಎಸ್ ಆಪರ್ಚುನಿಟೀಸ್ ಫಂಡ್ ಅತ್ಯಂತ ಯಶಸ್ವಿ ಅಂತಾರಾಷ್ಟ್ರೀಯ ಮ್ಯೂಚುಯಲ್ ಫಂಡ್ಗಳಲ್ಲಿ ಒಂದಾಗಿದೆ. ಈ ನಿಧಿಯು ತಂತ್ರಜ್ಞಾನ, ಆರೋಗ್ಯ ರಕ್ಷಣೆ, ಗ್ರಾಹಕ ಆವರ್ತಕ, ಹಣಕಾಸು ಸೇವೆಗಳು ಮತ್ತು ಅಂತಹ ಹಲವು ಕೈಗಾರಿಕಾ ವಲಯಗಳಂತಹ ಕ್ಷೇತ್ರಗಳಲ್ಲಿ ತೊಡಗಿಸಿಕೊಂಡಿರುವ ಯುನೈಟೆಡ್ ಸ್ಟೇಟ್ಸ್ನಲ್ಲಿರುವ ಕಂಪನಿಗಳ ಬಹು ಭದ್ರತೆಗಳಲ್ಲಿ ಹೂಡಿಕೆ ಮಾಡಲು ನಿಮಗೆ ಅನುಮತಿಸುತ್ತದೆ. ಈ ಮ್ಯೂಚುವಲ್ ಫಂಡ್ಗಳು ನಿಮ್ಮ ಹೂಡಿಕೆಯ ಬಂಡವಾಳವನ್ನು ವೈವಿಧ್ಯಗೊಳಿಸಲು ನಿಮಗೆ ಅವಕಾಶ ಮಾಡಿಕೊಡುತ್ತದೆ, ಒಂದೇ ಹೂಡಿಕೆಯ ಮೂಲಕ ಬಹು ಭದ್ರತೆಗಳಲ್ಲಿ ಹೂಡಿಕೆ ಮಾಡಲು ಸುಲಭವಾಗುತ್ತದೆ. ಪ್ರಾರಂಭವಾದಾಗಿನಿಂದ, ಫ್ರಾಂಕ್ಲಿನ್ ಇಂಡಿಯಾ ಫೀಡರ್ ಆದಾಯವನ್ನು ಉತ್ಪಾದಿಸಿದೆ19.9%
4. ಬ್ಲ್ಯಾಕ್ರಾಕ್ ವರ್ಲ್ಡ್ ಮೈನಿಂಗ್ ಫಂಡ್ ಎಂದರೇನು?
ಉ: ಇದು ಫ್ರಾಂಕ್ಲಿನ್ಗಿಂತ ಭಿನ್ನವಾಗಿದೆ ಏಕೆಂದರೆ ಇದು ಅಗತ್ಯ ವಸ್ತುಗಳು ಮತ್ತು ಹಣಕಾಸು ಸೇವೆಗಳಲ್ಲಿ ಮಾತ್ರ ಈಕ್ವಿಟಿ ವಲಯವನ್ನು ಹೊಂದಿದೆ. ಇದನ್ನು ಹೆಚ್ಚಿನ ಅಪಾಯದ ಮ್ಯೂಚುಯಲ್ ಫಂಡ್ ಎಂದು ಪರಿಗಣಿಸಲಾಗುತ್ತದೆ, ಆದರೆ ಅತ್ಯುತ್ತಮ ಆದಾಯವನ್ನು ನೀಡುತ್ತದೆ ಎಂದು ತಿಳಿದುಬಂದಿದೆ. ದಿಡಿಎಸ್ಪಿ ಬ್ಲ್ಯಾಕ್ರಾಕ್ ವಿಶ್ವ ಗಣಿಗಾರಿಕೆಯು ಸುಮಾರು ಆದಾಯವನ್ನು ನೀಡಿದೆ34.9% 3 ವರ್ಷಗಳ ಹೂಡಿಕೆಯ ಅವಧಿಗೆ.
5. ಅಂತರಾಷ್ಟ್ರೀಯ ಮ್ಯೂಚುಯಲ್ ಫಂಡ್ಗಳಿಂದ ಗಳಿಕೆಗೆ ತೆರಿಗೆ ವಿಧಿಸಲಾಗಿದೆಯೇ?
ಉ: ಹೌದು,ಗಳಿಕೆ ಅಂತರರಾಷ್ಟ್ರೀಯ ಮ್ಯೂಚುಯಲ್ ಫಂಡ್ಗಳಿಂದ ತೆರಿಗೆ ವಿಧಿಸಲಾಗುತ್ತದೆ. ಈ ಫಂಡ್ಗಳಿಂದ ನೀವು ಗಳಿಸುವ ಲಾಭಾಂಶಗಳು ಮೂಲದಲ್ಲಿ ತೆರಿಗೆ ಕಡಿತಗೊಳಿಸುವಿಕೆ ಅಥವಾ TDS ಗೆ ಹೊಣೆಗಾರರಾಗಿರುತ್ತವೆ7.5% ಮಾರ್ಚ್ 31, 2021 ರವರೆಗೆ ಮತ್ತು ಮ್ಯೂಚುಯಲ್ ಫಂಡ್ ಹೌಸ್ ಅದನ್ನು ಕಡಿತಗೊಳಿಸುತ್ತದೆ. ನೀವು 3 ವರ್ಷಗಳವರೆಗೆ ಹೂಡಿಕೆ ಮಾಡಿದ್ದರೆ, ಅದು ಅಲ್ಪಾವಧಿಯ ಹೂಡಿಕೆಯ ಅಡಿಯಲ್ಲಿ ಬರುತ್ತದೆ ಮತ್ತು ಹೆಚ್ಚಿನದಾದರೆ, ನೀವು ಅದನ್ನು ದೀರ್ಘಾವಧಿಯ ಹೂಡಿಕೆಯ ಅಡಿಯಲ್ಲಿ ವರ್ಗೀಕರಿಸಬೇಕಾಗುತ್ತದೆ. ತೆರಿಗೆ ಸ್ಲ್ಯಾಬ್ ಹೂಡಿಕೆ ಮಾಡಿದ ಸಮಯದ ಮೇಲೆ ಅವಲಂಬಿತವಾಗಿರುತ್ತದೆ.
6. ಅಂತಾರಾಷ್ಟ್ರೀಯ ಮ್ಯೂಚುವಲ್ ಫಂಡ್ನ ಮುಖ್ಯ ಅಪಾಯ ಏನು?
ಉ: ಅಂತರರಾಷ್ಟ್ರೀಯ ಮ್ಯೂಚುವಲ್ ಫಂಡ್ನ ಪ್ರಾಥಮಿಕ ಅಪಾಯವೆಂದರೆ ವಿದೇಶಿ ವಿನಿಮಯ ದರದ ಏರಿಳಿತದ ಸ್ವರೂಪ. ರೂಪಾಯಿಗೆ ಹೋಲಿಸಿದರೆ ವಿದೇಶಿ ವಿನಿಮಯ ದರಗಳು ಏರಿಳಿತವಾದರೆ, ಅದು ನಿಮ್ಮ ಹೂಡಿಕೆಯ ಮೇಲೆ ಪ್ರತಿಕೂಲ ಪರಿಣಾಮ ಬೀರಬಹುದು.
7. ವಿದೇಶಿ ಮ್ಯೂಚುವಲ್ ಫಂಡ್ನಲ್ಲಿ ಯಾರು ಹೂಡಿಕೆ ಮಾಡಬೇಕು?
ಉ: ನಿಮ್ಮ ಹೂಡಿಕೆ ಬಂಡವಾಳವನ್ನು ವೈವಿಧ್ಯಗೊಳಿಸಲು ಮತ್ತು ಭೌಗೋಳಿಕ ವೈವಿಧ್ಯೀಕರಣವನ್ನು ಸೇರಿಸಲು ನೀವು ಬಯಸಿದರೆ, ನೀವು ವಿದೇಶಿ ಮ್ಯೂಚುಯಲ್ ಫಂಡ್ನಲ್ಲಿ ಹೂಡಿಕೆ ಮಾಡುವುದನ್ನು ಪರಿಗಣಿಸಬಹುದು.
ಇಲ್ಲಿ ಒದಗಿಸಲಾದ ಮಾಹಿತಿಯು ನಿಖರವಾಗಿದೆ ಎಂದು ಖಚಿತಪಡಿಸಿಕೊಳ್ಳಲು ಎಲ್ಲಾ ಪ್ರಯತ್ನಗಳನ್ನು ಮಾಡಲಾಗಿದೆ. ಆದಾಗ್ಯೂ, ಡೇಟಾದ ನಿಖರತೆಯ ಬಗ್ಗೆ ಯಾವುದೇ ಗ್ಯಾರಂಟಿಗಳನ್ನು ನೀಡಲಾಗುವುದಿಲ್ಲ. ಯಾವುದೇ ಹೂಡಿಕೆ ಮಾಡುವ ಮೊದಲು ದಯವಿಟ್ಟು ಸ್ಕೀಮ್ ಮಾಹಿತಿ ದಾಖಲೆಯೊಂದಿಗೆ ಪರಿಶೀಲಿಸಿ.


AMFI Registration No. 112358 | CIN: U74999MH2016PTC282153
Shepard Technologies Pvt. Ltd. (with ARN code 112358) makes no warranties or representations, express or implied, on products offered through the platform. It accepts no liability for any damages or losses, however caused, in connection with the use of, or on the reliance of its product or related services. Terms and conditions of the website are applicable.
©2026 Shepard Technologies Private Limited. All Rights Reserved
Very good article I got all the required information.