ਲੰਪਸਮ ਕੈਲਕੁਲੇਟਰ
Lumpsum ਕੈਲਕੁਲੇਟਰ ਨਿਵੇਸ਼ਕਾਂ ਦੀ ਇਹ ਜਾਂਚ ਕਰਨ ਵਿੱਚ ਮਦਦ ਕਰਦਾ ਹੈ ਕਿ ਉਹਨਾਂ ਦਾ ਇੱਕਮੁਸ਼ਤ ਨਿਵੇਸ਼ ਇੱਕ ਨਿਸ਼ਚਿਤ ਸਮਾਂ ਸੀਮਾ ਵਿੱਚ ਕਿਵੇਂ ਵਧਦਾ ਹੈ। ਨਿਵੇਸ਼ ਦੇ ਇੱਕਮੁਸ਼ਤ ਮੋਡ ਵਿੱਚ, ਲੋਕ ਯੋਜਨਾ ਵਿੱਚ ਇੱਕ-ਵਾਰ ਡਾਊਨ ਪੇਮੈਂਟ ਵਜੋਂ ਕਾਫ਼ੀ ਰਕਮ ਨਿਵੇਸ਼ ਕਰਦੇ ਹਨ। ਜਦੋਂ ਵੀ, ਅਸੀਂ ਮਿਉਚੁਅਲ ਫੰਡ ਨਿਵੇਸ਼ ਬਾਰੇ ਗੱਲ ਕਰਦੇ ਹਾਂ, ਤਾਂ ਸਭ ਤੋਂ ਪਹਿਲਾਂ ਜੋ ਸਾਡੇ ਦਿਮਾਗ ਵਿੱਚ ਘੁੰਮਦਾ ਹੈ, "ਸਾਨੂੰ ਕਿੰਨੀ ਰਕਮ ਨਿਵੇਸ਼ ਕਰਨ ਦੀ ਲੋੜ ਹੈ?" ਹਾਲਾਂਕਿ ਸੰਭਾਵਿਤ ਰਿਟਰਨ, ਜੋਖਮ-ਭੁੱਖ, ਨਿਵੇਸ਼ ਦੀ ਮਿਆਦ, ਅਤੇ ਇਸ ਤਰ੍ਹਾਂ ਦੇ ਹੋਰ ਬਹੁਤ ਸਾਰੇ ਸਵਾਲ ਹਨ; ਪਹਿਲਾ ਵਿਚਾਰ ਜੋ ਹਮੇਸ਼ਾ ਸਾਡੇ ਕੰਨਾਂ 'ਤੇ ਵੱਜਦਾ ਹੈ ਉਹ ਹੈ ਨਿਵੇਸ਼ ਦੀ ਰਕਮ।
ਇਸ ਲਈ, ਆਓ ਦੇਖੀਏ ਕਿ ਕਿਵੇਂ ਇਕਮੁਸ਼ਤ ਕੈਲਕੁਲੇਟਰ ਵਿੱਚ ਇੱਕ-ਵਾਰ ਨਿਵੇਸ਼ ਦੇ ਵਾਧੇ ਦਾ ਮੁਲਾਂਕਣ ਕਰਨ ਵਿੱਚ ਮਦਦ ਕਰਦਾ ਹੈਮਿਉਚੁਅਲ ਫੰਡ.
Lumpsum ਕੈਲਕੁਲੇਟਰ ਇਲਸਟ੍ਰੇਸ਼ਨ
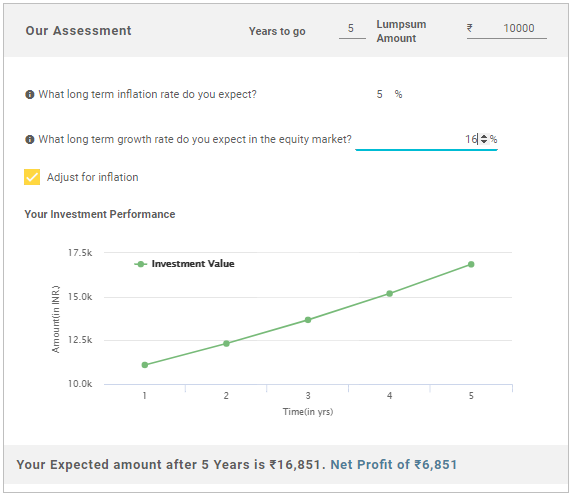
ਹੇਠਾਂ ਦਿੱਤੇ ਡੇਟਾ ਦੀ ਮਦਦ ਨਾਲ ਆਪਣੇ ਇੱਕਮੁਸ਼ਤ ਨਿਵੇਸ਼ 'ਤੇ ਰਿਟਰਨ ਦੀ ਗਣਨਾ ਕਰੋ।
ਨਿਵੇਸ਼ ਦੀ ਮਿਆਦ: 5 ਸਾਲ
ਇੱਕਮੁਸ਼ਤ ਨਿਵੇਸ਼ ਦੀ ਰਕਮ: ₹10,000
ਲੰਮਾ ਸਮਾਂਮਹਿੰਗਾਈ (%): 5 (ਲਗਭਗ)
ਲੰਬੇ ਸਮੇਂ ਦੇ ਰਿਟਰਨ (%): 16 (ਲਗਭਗ)
Lumpsum ਕੈਲਕੁਲੇਟਰ ਦੇ ਅਨੁਸਾਰ ਸੰਭਾਵਿਤ ਰਿਟਰਨ: ₹6,851
5 ਸਾਲਾਂ ਬਾਅਦ ਕੁੱਲ ਰਕਮ: ₹16,851
Talk to our investment specialist
ਲੰਪਸਮ ਨਿਵੇਸ਼ ਲਈ 2018 ਵਿੱਚ ਚੋਟੀ ਦੇ 10 ਪ੍ਰਦਰਸ਼ਨ ਕਰਨ ਵਾਲੇ ਮਿਉਚੁਅਲ ਫੰਡ
Fund NAV Net Assets (Cr) Min Investment 3 MO (%) 6 MO (%) 1 YR (%) 3 YR (%) 5 YR (%) 2024 (%) Sundaram Rural and Consumption Fund Growth ₹95.1263
↑ 0.10 ₹1,422 5,000 6 4.8 -2.2 10.6 11.7 -0.1 Franklin Asian Equity Fund Growth ₹44.1026
↑ 2.12 ₹979 5,000 9.3 14.1 39.7 18.4 8.1 23.7 Franklin Build India Fund Growth ₹144.394
↑ 0.99 ₹3,256 5,000 -2 1.9 1.9 18.1 19.7 3.7 DSP Natural Resources and New Energy Fund Growth ₹106.327
↑ 0.33 ₹2,401 1,000 -4.7 0.4 18.3 19.2 15 17.5 DSP Equity Opportunities Fund Growth ₹624.745
↑ 0.37 ₹17,906 1,000 3.4 -1.1 2.2 14.6 12.4 7.1 DSP US Flexible Equity Fund Growth ₹90.0193
↑ 0.77 ₹1,291 1,000 1.5 11.7 36.9 24.6 17.2 33.8 Bandhan Infrastructure Fund Growth ₹49.429
↑ 0.28 ₹1,545 5,000 1.5 7.9 -1.5 16.2 16.4 -6.9 Tata India Tax Savings Fund Growth ₹46.8846
↑ 0.31 ₹4,597 500 4.4 5.1 6.6 12.4 13 4.9 Aditya Birla Sun Life Banking And Financial Services Fund Growth ₹63.22
↑ 0.50 ₹3,676 1,000 3.6 -0.6 5 10.3 11.5 17.5 Aditya Birla Sun Life Small Cap Fund Growth ₹96.6213
↑ 0.64 ₹5,731 1,000 8.8 17.5 12.8 15.1 12.4 -3.7 Note: Returns up to 1 year are on absolute basis & more than 1 year are on CAGR basis. as on 31 Jul 26 Research Highlights & Commentary of 10 Funds showcased
Commentary Sundaram Rural and Consumption Fund Franklin Asian Equity Fund Franklin Build India Fund DSP Natural Resources and New Energy Fund DSP Equity Opportunities Fund DSP US Flexible Equity Fund Bandhan Infrastructure Fund Tata India Tax Savings Fund Aditya Birla Sun Life Banking And Financial Services Fund Aditya Birla Sun Life Small Cap Fund Point 1 Bottom quartile AUM (₹1,422 Cr). Bottom quartile AUM (₹979 Cr). Upper mid AUM (₹3,256 Cr). Lower mid AUM (₹2,401 Cr). Highest AUM (₹17,906 Cr). Bottom quartile AUM (₹1,291 Cr). Lower mid AUM (₹1,545 Cr). Upper mid AUM (₹4,597 Cr). Upper mid AUM (₹3,676 Cr). Top quartile AUM (₹5,731 Cr). Point 2 Established history (20+ yrs). Established history (18+ yrs). Established history (16+ yrs). Established history (18+ yrs). Oldest track record among peers (26 yrs). Established history (14+ yrs). Established history (15+ yrs). Established history (11+ yrs). Established history (12+ yrs). Established history (19+ yrs). Point 3 Top rated. Rating: 5★ (top quartile). Rating: 5★ (upper mid). Rating: 5★ (upper mid). Rating: 5★ (upper mid). Rating: 5★ (lower mid). Rating: 5★ (lower mid). Rating: 5★ (bottom quartile). Rating: 5★ (bottom quartile). Rating: 5★ (bottom quartile). Point 4 Risk profile: Moderately High. Risk profile: High. Risk profile: High. Risk profile: High. Risk profile: Moderately High. Risk profile: High. Risk profile: High. Risk profile: Moderately High. Risk profile: High. Risk profile: Moderately High. Point 5 5Y return: 11.75% (bottom quartile). 5Y return: 8.09% (bottom quartile). 5Y return: 19.68% (top quartile). 5Y return: 14.99% (upper mid). 5Y return: 12.42% (lower mid). 5Y return: 17.19% (top quartile). 5Y return: 16.44% (upper mid). 5Y return: 13.00% (upper mid). 5Y return: 11.51% (bottom quartile). 5Y return: 12.43% (lower mid). Point 6 3Y return: 10.63% (bottom quartile). 3Y return: 18.41% (upper mid). 3Y return: 18.05% (upper mid). 3Y return: 19.21% (top quartile). 3Y return: 14.61% (lower mid). 3Y return: 24.61% (top quartile). 3Y return: 16.23% (upper mid). 3Y return: 12.37% (bottom quartile). 3Y return: 10.29% (bottom quartile). 3Y return: 15.12% (lower mid). Point 7 1Y return: -2.17% (bottom quartile). 1Y return: 39.67% (top quartile). 1Y return: 1.90% (bottom quartile). 1Y return: 18.33% (upper mid). 1Y return: 2.24% (lower mid). 1Y return: 36.94% (top quartile). 1Y return: -1.52% (bottom quartile). 1Y return: 6.56% (upper mid). 1Y return: 4.98% (lower mid). 1Y return: 12.80% (upper mid). Point 8 Alpha: -6.29 (bottom quartile). Alpha: 0.00 (upper mid). Alpha: 0.00 (upper mid). Alpha: 0.00 (upper mid). Alpha: -2.56 (bottom quartile). Alpha: -4.10 (bottom quartile). Alpha: 0.00 (lower mid). Alpha: 4.23 (top quartile). Alpha: 3.47 (top quartile). Alpha: 0.00 (lower mid). Point 9 Sharpe: -0.67 (bottom quartile). Sharpe: 1.54 (top quartile). Sharpe: -0.04 (upper mid). Sharpe: 0.72 (upper mid). Sharpe: -0.35 (bottom quartile). Sharpe: 1.93 (top quartile). Sharpe: -0.25 (bottom quartile). Sharpe: -0.09 (lower mid). Sharpe: -0.06 (lower mid). Sharpe: 0.22 (upper mid). Point 10 Information ratio: -0.56 (bottom quartile). Information ratio: 0.00 (upper mid). Information ratio: 0.00 (lower mid). Information ratio: 0.00 (lower mid). Information ratio: 0.20 (upper mid). Information ratio: 0.15 (upper mid). Information ratio: 0.00 (bottom quartile). Information ratio: 0.22 (top quartile). Information ratio: 0.24 (top quartile). Information ratio: 0.00 (bottom quartile). Sundaram Rural and Consumption Fund
Franklin Asian Equity Fund
Franklin Build India Fund
DSP Natural Resources and New Energy Fund
DSP Equity Opportunities Fund
DSP US Flexible Equity Fund
Bandhan Infrastructure Fund
Tata India Tax Savings Fund
Aditya Birla Sun Life Banking And Financial Services Fund
Aditya Birla Sun Life Small Cap Fund
Lumpsum ਕੈਲਕੁਲੇਟਰ ਨੂੰ ਸਮਝਣਾ
ਉਹ ਵਿਅਕਤੀ ਜੋ ਨਿਵੇਸ਼ ਲਈ ਨਵੇਂ ਹਨ, ਉਹਨਾਂ ਨੂੰ ਇੱਕਮੁਸ਼ਤ ਕੈਲਕੁਲੇਟਰ ਦੀ ਧਾਰਨਾ ਅਤੇ ਇਸਦੇ ਕੰਮਕਾਜ ਨੂੰ ਸਮਝਣ ਵਿੱਚ ਮੁਸ਼ਕਲ ਆਉਂਦੀ ਹੈ। ਇਸ ਲਈ, ਗੁੰਝਲਾਂ ਨੂੰ ਸੌਖਾ ਕਰਨ ਲਈ, ਗਣਨਾ ਬਾਰੇ ਵਿਸਤ੍ਰਿਤ ਜਾਣਕਾਰੀ ਦਿੱਤੀ ਗਈ ਹੈ. ਪ੍ਰਕਿਰਿਆ ਨੂੰ ਸਮਝਣ ਲਈ ਇਸ ਜਾਣਕਾਰੀ 'ਤੇ ਜਾਓ। ਇੰਪੁੱਟ ਡੇਟਾ ਜਿਸਨੂੰ ਇੱਕਮੁਸ਼ਤ ਕੈਲਕੁਲੇਟਰ ਵਿੱਚ ਫੀਡ ਕਰਨ ਦੀ ਲੋੜ ਹੈ ਵਿੱਚ ਸ਼ਾਮਲ ਹਨ:
- ਇੱਕਮੁਸ਼ਤ ਨਿਵੇਸ਼ ਦਾ ਕਾਰਜਕਾਲ
- ਪੈਸੇ ਦੀ ਰਕਮ ਇੱਕਮੁਸ਼ਤ ਮੋਡ ਰਾਹੀਂ ਨਿਵੇਸ਼ ਕੀਤੀ ਜਾ ਰਹੀ ਹੈ
- ਇਕੁਇਟੀ ਬਾਜ਼ਾਰਾਂ ਤੋਂ ਲੰਬੇ ਸਮੇਂ ਲਈ ਰਿਟਰਨ ਦੀ ਉਮੀਦ ਕੀਤੀ ਦਰ
- ਅਨੁਮਾਨਿਤ ਸਾਲਾਨਾ ਮਹਿੰਗਾਈ ਦਰ
ਇਹ ਕਿਵੇਂ ਕੰਮ ਕਰਦਾ ਹੈ?
ਕਿਸੇ ਵੀ ਨਿਵੇਸ਼ ਦੇ ਉਦੇਸ਼ ਲਈ ਹਮੇਸ਼ਾ ਇੱਕ ਪ੍ਰਭਾਵਸ਼ਾਲੀ ਯੋਜਨਾ ਦੀ ਲੋੜ ਹੁੰਦੀ ਹੈ। ਹਾਲਾਂਕਿ ਲੋਕ ਇਸਦੇ ਪਿਛਲੇ ਪ੍ਰਦਰਸ਼ਨ ਅਤੇ ਹੋਰ ਸੰਬੰਧਿਤ ਕਾਰਕਾਂ ਦੇ ਅਧਾਰ ਤੇ ਸਭ ਤੋਂ ਵਧੀਆ ਸਕੀਮਾਂ ਦੀ ਚੋਣ ਕਰ ਸਕਦੇ ਹਨ ਹਾਲਾਂਕਿ; ਇਹ ਇਸ ਇੱਕਮੁਸ਼ਤ ਕੈਲਕੁਲੇਟਰ ਦੀ ਮਦਦ ਨਾਲ ਹੈ ਜੋ ਲੋਕਾਂ ਨੂੰ ਇਹ ਫੈਸਲਾ ਕਰਨ ਵਿੱਚ ਮਦਦ ਕਰਦਾ ਹੈ ਕਿ ਉਹਨਾਂ ਦਾ ਨਿਵੇਸ਼ ਇੱਕ ਸਮੇਂ ਦੇ ਨਾਲ ਲਗਭਗ ਕਿਵੇਂ ਵਧਦਾ ਹੈ। ਜਿਵੇਂ ਕਿ ਪਹਿਲਾਂ ਦੱਸਿਆ ਗਿਆ ਹੈ, ਇਸ ਕੈਲਕੁਲੇਟਰ ਦੇ ਇਨਪੁਟ ਤੱਤਾਂ ਵਿੱਚ ਨਿਵੇਸ਼ ਦੀ ਮਿਆਦ, ਨਿਵੇਸ਼ ਕੀਤੀ ਰਕਮ ਅਤੇ ਹੋਰ ਸ਼ਾਮਲ ਹਨ। ਇਸ ਲਈ, ਆਓ ਦੇਖੀਏ ਕਿ ਹੇਠਾਂ ਦਿੱਤੀ ਉਦਾਹਰਣ ਨਾਲ ਗਣਨਾ ਕਿਵੇਂ ਕੰਮ ਕਰਦੀ ਹੈ।
ਇੱਕਮੁਸ਼ਤ ਨਿਵੇਸ਼ ਦੀ ਰਕਮ: ₹25,000
ਨਿਵੇਸ਼ ਦੀ ਮਿਆਦ: 5 ਸਾਲ
ਸੰਭਾਵਿਤ ਰਿਟਰਨ (%) (ਲਗਭਗ): 15
ਸੰਭਾਵਿਤ ਮਹਿੰਗਾਈ (%) (ਲਗਭਗ): 5
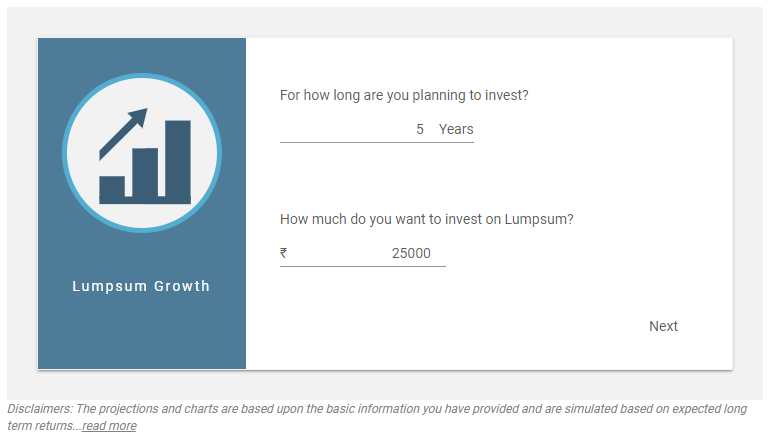
1. ਆਪਣੀ ਇਕਮੁਸ਼ਤ ਨਿਵੇਸ਼ ਰਕਮ ਅਤੇ ਨਿਵੇਸ਼ ਕਾਰਜਕਾਲ ਦਰਜ ਕਰੋ
ਇਹ ਪਹਿਲਾ ਸਵਾਲ ਹੈ ਜੋ ਤੁਹਾਨੂੰ ਪੁੱਛਣਾ ਚਾਹੀਦਾ ਹੈ, ਕਿ ਮੈਨੂੰ ਕਿੰਨੀ ਰਕਮ ਨਿਵੇਸ਼ ਕਰਨ ਦੀ ਲੋੜ ਹੈ ਤਾਂ ਜੋ ਮੈਂ ਆਪਣੇ ਉਦੇਸ਼ ਨੂੰ ਪ੍ਰਾਪਤ ਕਰ ਸਕਾਂ। ਇਸ ਦੇ ਨਾਲ, ਨਿਵੇਸ਼ ਦੀ ਮਿਆਦ ਵੀ ਦੱਸੋ। ਇਸ ਲਈ, ₹25,000 ਅਤੇ 5 ਸਾਲਾਂ ਦੇ ਕਾਰਜਕਾਲ ਬਾਰੇ ਦੱਸੀ ਗਈ ਰਕਮ ਦੀ ਮਦਦ ਨਾਲ, ਚਿੱਤਰ ਹੇਠਾਂ ਦਿੱਤਾ ਗਿਆ ਹੈ। ਇੱਥੇ, ਨਿਵੇਸ਼ ਦੀ ਰਕਮ ਅਤੇ ਕਾਰਜਕਾਲ ਦਰਜ ਕਰਨ ਤੋਂ ਬਾਅਦ, ਤੁਹਾਨੂੰ ਕਲਿੱਕ ਕਰਨ ਦੀ ਲੋੜ ਹੈਅਗਲਾ ਬਟਨ ਜੋ ਕਿ ਸਕਰੀਨ ਦੇ ਹੇਠਾਂ ਹੈ ਜਿਵੇਂ ਕਿ ਚਿੱਤਰ ਵਿੱਚ ਦਿਖਾਇਆ ਗਿਆ ਹੈ।
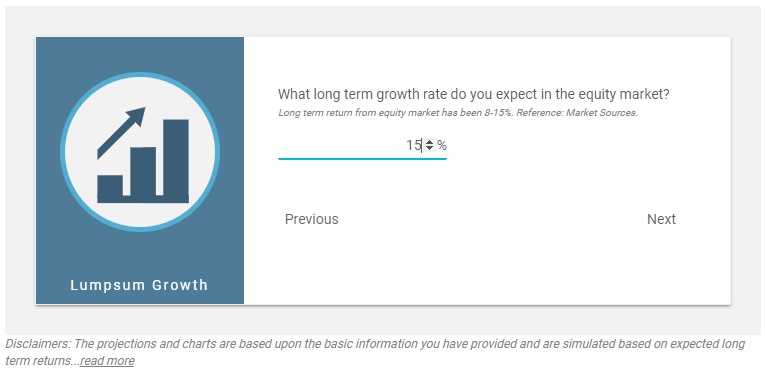
2. ਤੁਹਾਡੇ ਨਿਵੇਸ਼ 'ਤੇ ਉਮੀਦ ਕੀਤੀ ਲੰਬੀ ਮਿਆਦ ਦੀ ਵਾਧਾ ਦਰਜ ਕਰੋ
ਇਹ ਦੂਜਾ ਸਵਾਲ ਹੈ ਜਿਸਦਾ ਤੁਹਾਨੂੰ ਜਵਾਬ ਦੇਣ ਦੀ ਲੋੜ ਹੈ। ਇੱਥੇ, ਤੁਹਾਨੂੰ ਇੱਕਮੁਸ਼ਤ ਨਿਵੇਸ਼ 'ਤੇ ਵਾਪਸੀ ਦੀ ਸੰਭਾਵਿਤ ਦਰ ਦਰਜ ਕਰਨ ਦੀ ਲੋੜ ਹੈ। ਉਦਾਹਰਨ ਲਈ, ਆਓ ਇਸ ਕੇਸ ਵਿੱਚ ਰਿਟਰਨ ਦੀ ਦਰ 15% ਮੰਨ ਲਈਏ। ਇਸਦੇ ਲਈ ਚਿੱਤਰ ਹੇਠਾਂ ਦਿੱਤੇ ਅਨੁਸਾਰ ਸੂਚੀਬੱਧ ਕੀਤਾ ਗਿਆ ਹੈ. ਇਸ ਤੋਂ ਬਾਅਦ, ਰਿਟਰਨ ਦੀ ਸੰਭਾਵਿਤ ਦਰ ਦਰਜ ਕਰਨ ਤੋਂ ਬਾਅਦ, ਤੁਹਾਨੂੰ ਕਲਿੱਕ ਕਰਨ ਦੀ ਲੋੜ ਹੈਅਗਲਾ ਬਟਨ ਜੋ ਕਿ ਹੇਠਾਂ ਦਿੱਤੇ ਅਨੁਸਾਰ ਦਿਖਾਇਆ ਗਿਆ ਹੈ।
3. ਮਹਿੰਗਾਈ ਲਈ ਵਿਵਸਥਿਤ ਕਰੋ
ਇੱਕ ਵਾਰ ਜਦੋਂ ਤੁਸੀਂ ਉਮੀਦ ਕੀਤੀ ਰਿਟਰਨ ਦੀ ਪ੍ਰਤੀਸ਼ਤਤਾ ਦਰਜ ਕਰਦੇ ਹੋ, ਅਤੇ ਅੱਗੇ 'ਤੇ ਕਲਿੱਕ ਕਰੋ, ਤਾਂ ਤੁਹਾਨੂੰ ਨਤੀਜਾ ਮਿਲੇਗਾ। ਇੱਥੇ, ਤੁਹਾਨੂੰ ਨੇੜੇ ਦੇ ਬਾਕਸ ਨੂੰ ਚੁਣਨ ਦੀ ਲੋੜ ਹੈਮਹਿੰਗਾਈ ਲਈ ਵਿਵਸਥਿਤ ਕਰੋ ਅਤੇ ਲੰਬੇ ਸਮੇਂ ਦੀ ਮਹਿੰਗਾਈ ਦਰ ਦਰਜ ਕਰੋ। ਸਾਡੀ ਉਦਾਹਰਨ ਵਿੱਚ, ਅਸੀਂ ਮਹਿੰਗਾਈ ਦਰ ਨੂੰ 5% ਮੰਨਿਆ ਹੈ। ਇੱਕ ਵਾਰ ਜਦੋਂ ਤੁਸੀਂ ਮਹਿੰਗਾਈ ਦਰ ਵਿੱਚ ਦਾਖਲ ਹੋ ਜਾਂਦੇ ਹੋ; ਤੁਹਾਨੂੰ ਨਿਵੇਸ਼ ਮੁੱਲ. ਇਸ ਕਦਮ ਲਈ ਚਿੱਤਰ ਹੇਠ ਲਿਖੇ ਅਨੁਸਾਰ ਹੈ.
4. ਅੰਤਮ ਨਤੀਜਾ
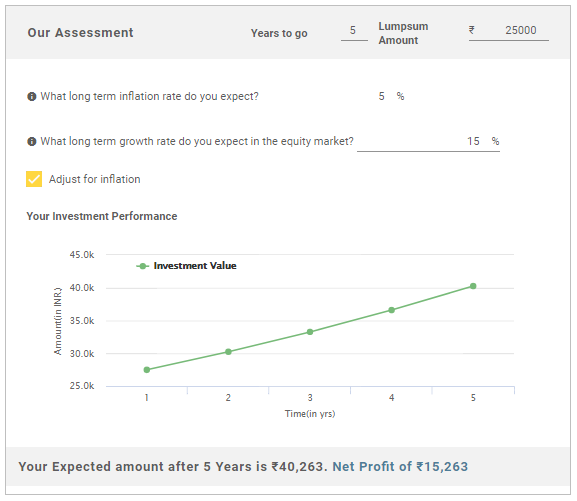
ਇਸ ਲਈ, ਅਸੀਂ ਇਹ ਸਿੱਟਾ ਕੱਢ ਸਕਦੇ ਹਾਂ ਕਿ, ਪੰਜਵੇਂ ਸਾਲ ਦੇ ਅੰਤ ਵਿੱਚ, ਨਿਵੇਸ਼ 'ਤੇ ਸ਼ੁੱਧ ਲਾਭ ₹15,263 ਹੈ ਅਤੇ ਕੁੱਲ ਨਿਵੇਸ਼ ਮੁੱਲ ₹40,263 ਹੈ।
ਇਸ ਤਰ੍ਹਾਂ, ਉੱਪਰ ਦੱਸੇ ਗਏ ਕਦਮਾਂ ਤੋਂ, ਅਸੀਂ ਦੇਖ ਸਕਦੇ ਹਾਂ ਕਿ Fincash Lumpsum ਕੈਲਕੁਲੇਟਰ ਦੀ ਵਰਤੋਂ ਕਰਨਾ ਸਰਲ ਹੈ।
ਹੋਰ ਸਵਾਲਾਂ ਦੇ ਮਾਮਲੇ ਵਿੱਚ, ਸਾਡੇ ਗਾਹਕ ਦੇਖਭਾਲ ਵਿਭਾਗ ਨਾਲ ਸੰਪਰਕ ਕਰਨ ਲਈ ਬੇਝਿਜਕ ਮਹਿਸੂਸ ਕਰੋ।
2022 ਲਈ ਪ੍ਰਮੁੱਖ ਫੰਡ
*3 ਸਾਲ ਦੀ ਕਾਰਗੁਜ਼ਾਰੀ ਦੇ ਆਧਾਰ 'ਤੇ ਵਧੀਆ ਫੰਡ।
"The primary investment objective of the Scheme is to seek capital appreciation by investing predominantly in units of MLIIF - WGF. The Scheme may, at the discretion of the Investment Manager, also invest in the units of other similar overseas mutual fund schemes, which may constitute a significant part of its corpus. The Scheme may also invest a certain portion of its corpus in money market securities and/or units of money market/liquid schemes of DSP Merrill Lynch Mutual Fund, in order to meet liquidity requirements from time to time. However, there is no assurance that the investment objective of the Scheme will be realized." Below is the key information for DSP World Gold Fund Returns up to 1 year are on The primary investment objective of the Scheme is to seek capital appreciation by investing predominantly in units of BGF – USFEF. The Scheme may, at the discretion of the Investment Manager also invest in the units of other similar overseas mutual fund schemes, which may constitute a significant part of its corpus. The Scheme may also invest a certain portion of its corpus in money market securities and/or money market/liquid schemes of DSP BlackRock Mutual Fund, in order to meet liquidity requirements from time to time. However, there is no assurance that the investment objective of the Scheme will be realized. It shall be noted ‘similar overseas mutual fund schemes’ shall have investment objective, investment strategy and risk profile/consideration similar to those of BGF – USFEF. Research Highlights for DSP US Flexible Equity Fund Below is the key information for DSP US Flexible Equity Fund Returns up to 1 year are on The investment objective of the scheme is to provide long term growth from a portfolio of equity / equity related instruments of companies engaged either directly or indirectly in the infrastructure sector. Research Highlights for LIC MF Infrastructure Fund Below is the key information for LIC MF Infrastructure Fund Returns up to 1 year are on 1. DSP World Gold Fund
DSP World Gold Fund
Growth Launch Date 14 Sep 07 NAV (30 Jul 26) ₹50.4247 ↑ 1.63 (3.33 %) Net Assets (Cr) ₹1,433 on 30 Jun 26 Category Equity - Global AMC DSP BlackRock Invmt Managers Pvt. Ltd. Rating ☆☆☆ Risk High Expense Ratio 1.41 Sharpe Ratio 1.22 Information Ratio -0.5 Alpha Ratio 2.12 Min Investment 1,000 Min SIP Investment 500 Exit Load 0-12 Months (1%),12 Months and above(NIL) Growth of 10,000 investment over the years.
Date Value 31 Jul 21 ₹10,000 31 Jul 22 ₹7,373 31 Jul 23 ₹9,366 31 Jul 24 ₹11,150 31 Jul 25 ₹16,504 Returns for DSP World Gold Fund
absolute basis & more than 1 year are on CAGR (Compound Annual Growth Rate) basis. as on 30 Jul 26 Duration Returns 1 Month 2.3% 3 Month -12.7% 6 Month -17.8% 1 Year 62.8% 3 Year 43.6% 5 Year 22.1% 10 Year 15 Year Since launch 8.9% Historical performance (Yearly) on absolute basis
Year Returns 2024 167.1% 2023 15.9% 2022 7% 2021 -7.7% 2020 -9% 2019 31.4% 2018 35.1% 2017 -10.7% 2016 -4% 2015 52.7% Fund Manager information for DSP World Gold Fund
Name Since Tenure Kaivalya Nadkarni 1 May 25 1.17 Yr. Data below for DSP World Gold Fund as on 30 Jun 26
Equity Sector Allocation
Sector Value Basic Materials 94.47% Asset Allocation
Asset Class Value Cash 3.62% Equity 94.47% Debt 0% Other 1.91% Top Securities Holdings / Portfolio
Name Holding Value Quantity BGF World Gold I2
Investment Fund | -68% ₹1,141 Cr 1,005,044 VanEck Gold Miners ETF
- | GDX29% ₹490 Cr 573,719 Treps / Reverse Repo Investments
CBLO/Reverse Repo | -3% ₹54 Cr Net Receivables/Payables
Net Current Assets | -0% -₹6 Cr 2. DSP US Flexible Equity Fund
DSP US Flexible Equity Fund
Growth Launch Date 3 Aug 12 NAV (30 Jul 26) ₹90.0193 ↑ 0.77 (0.86 %) Net Assets (Cr) ₹1,291 on 30 Jun 26 Category Equity - Global AMC DSP BlackRock Invmt Managers Pvt. Ltd. Rating ☆☆☆☆☆ Risk High Expense Ratio 1.55 Sharpe Ratio 1.93 Information Ratio 0.15 Alpha Ratio -4.1 Min Investment 1,000 Min SIP Investment 500 Exit Load 0-12 Months (1%),12 Months and above(NIL) Growth of 10,000 investment over the years.
Date Value 31 Jul 21 ₹10,000 31 Jul 22 ₹10,023 31 Jul 23 ₹11,458 31 Jul 24 ₹13,332 31 Jul 25 ₹16,454 Returns for DSP US Flexible Equity Fund
absolute basis & more than 1 year are on CAGR (Compound Annual Growth Rate) basis. as on 30 Jul 26 Duration Returns 1 Month -4.1% 3 Month 1.5% 6 Month 11.7% 1 Year 36.9% 3 Year 24.6% 5 Year 17.2% 10 Year 15 Year Since launch 17% Historical performance (Yearly) on absolute basis
Year Returns 2024 33.8% 2023 17.8% 2022 22% 2021 -5.9% 2020 24.2% 2019 22.6% 2018 27.5% 2017 -1.1% 2016 15.5% 2015 9.8% Fund Manager information for DSP US Flexible Equity Fund
Name Since Tenure Kaivalya Nadkarni 1 May 25 1.17 Yr. Data below for DSP US Flexible Equity Fund as on 30 Jun 26
Equity Sector Allocation
Sector Value Technology 33.05% Industrials 13.62% Financial Services 12.17% Communication Services 12.05% Consumer Cyclical 9.62% Health Care 7.65% Basic Materials 2.45% Energy 2.43% Asset Allocation
Asset Class Value Cash 6.96% Equity 93.02% Debt 0.01% Top Securities Holdings / Portfolio
Name Holding Value Quantity BGF US Flexible Equity I2
Investment Fund | -96% ₹1,265 Cr 1,784,131
↓ -32,921 Treps / Reverse Repo Investments
CBLO/Reverse Repo | -4% ₹59 Cr Net Receivables/Payables
Net Current Assets | -0% -₹2 Cr 3. LIC MF Infrastructure Fund
LIC MF Infrastructure Fund
Growth Launch Date 29 Feb 08 NAV (31 Jul 26) ₹54.5662 ↑ 0.75 (1.39 %) Net Assets (Cr) ₹1,137 on 30 Jun 26 Category Equity - Sectoral AMC LIC Mutual Fund Asset Mgmt Co Ltd Rating Risk High Expense Ratio 2.21 Sharpe Ratio 0.22 Information Ratio 0.58 Alpha Ratio 8.41 Min Investment 5,000 Min SIP Investment 1,000 Exit Load 0-1 Years (1%),1 Years and above(NIL) Growth of 10,000 investment over the years.
Date Value 31 Jul 21 ₹10,000 31 Jul 22 ₹11,519 31 Jul 23 ₹14,236 31 Jul 24 ₹26,350 31 Jul 25 ₹25,021 Returns for LIC MF Infrastructure Fund
absolute basis & more than 1 year are on CAGR (Compound Annual Growth Rate) basis. as on 30 Jul 26 Duration Returns 1 Month -0.9% 3 Month 5.3% 6 Month 14.5% 1 Year 9.8% 3 Year 24.5% 5 Year 22.4% 10 Year 15 Year Since launch 9.7% Historical performance (Yearly) on absolute basis
Year Returns 2024 -3.7% 2023 47.8% 2022 44.4% 2021 7.9% 2020 46.6% 2019 -0.1% 2018 13.3% 2017 -14.6% 2016 42.2% 2015 -2.2% Fund Manager information for LIC MF Infrastructure Fund
Name Since Tenure Sumit Bhatnagar 7 Apr 26 0.23 Yr. Mahesh Bendre 1 Jul 24 2 Yr. Data below for LIC MF Infrastructure Fund as on 30 Jun 26
Equity Sector Allocation
Sector Value Industrials 37.05% Consumer Cyclical 20.88% Basic Materials 12.42% Utility 11.88% Communication Services 5.02% Financial Services 3.98% Real Estate 1.97% Health Care 1.89% Technology 1.08% Asset Allocation
Asset Class Value Cash 3.82% Equity 96.18% Top Securities Holdings / Portfolio
Name Holding Value Quantity Larsen & Toubro Ltd (Industrials)
Equity, Since 30 Apr 09 | LT4% ₹44 Cr 106,968
↓ -10,884 Garware Hi-Tech Films Ltd (Basic Materials)
Equity, Since 31 Aug 23 | 5006554% ₹40 Cr 65,325
↓ -7,684 Tata Motors Passenger Vehicles Ltd (Consumer Cyclical)
Equity, Since 28 Feb 26 | TMPV4% ₹39 Cr 982,891
↓ -332,760 Tata Motors Ltd (Consumer Cyclical)
Equity, Since 31 Oct 25 | TMCV4% ₹39 Cr 1,015,933
↑ 26,983 Tata Power Co Ltd (Utilities)
Equity, Since 29 Feb 24 | TATAPOWER3% ₹36 Cr 861,040
↑ 524,312 KSH International Ltd (Industrials)
Equity, Since 31 Dec 25 | KSHINTL3% ₹34 Cr 432,816
↑ 6,280 Siemens Energy India Ltd (Utilities)
Equity, Since 31 Aug 25 | ENRIN3% ₹34 Cr 87,106
↑ 24,800 JSW Infrastructure Ltd (Industrials)
Equity, Since 30 Apr 26 | JSWINFRA3% ₹31 Cr 1,133,858
↑ 745,681 Carraro India Ltd (Consumer Cyclical)
Equity, Since 31 Dec 24 | CARRARO3% ₹31 Cr 572,991 Bharat Dynamics Ltd Ordinary Shares (Industrials)
Equity, Since 31 Jan 26 | BDL3% ₹29 Cr 242,954
↑ 157,744
ਇਹ ਯਕੀਨੀ ਬਣਾਉਣ ਲਈ ਸਾਰੇ ਯਤਨ ਕੀਤੇ ਗਏ ਹਨ ਕਿ ਇੱਥੇ ਦਿੱਤੀ ਗਈ ਜਾਣਕਾਰੀ ਸਹੀ ਹੈ। ਹਾਲਾਂਕਿ, ਡੇਟਾ ਦੀ ਸ਼ੁੱਧਤਾ ਬਾਰੇ ਕੋਈ ਗਾਰੰਟੀ ਨਹੀਂ ਦਿੱਤੀ ਗਈ ਹੈ। ਕਿਰਪਾ ਕਰਕੇ ਕੋਈ ਵੀ ਨਿਵੇਸ਼ ਕਰਨ ਤੋਂ ਪਹਿਲਾਂ ਸਕੀਮ ਜਾਣਕਾਰੀ ਦਸਤਾਵੇਜ਼ ਨਾਲ ਤਸਦੀਕ ਕਰੋ।


AMFI Registration No. 112358 | CIN: U74999MH2016PTC282153
Shepard Technologies Pvt. Ltd. (with ARN code 112358) makes no warranties or representations, express or implied, on products offered through the platform. It accepts no liability for any damages or losses, however caused, in connection with the use of, or on the reliance of its product or related services. Terms and conditions of the website are applicable.
©2026 Shepard Technologies Private Limited. All Rights Reserved
Research Highlights for DSP World Gold Fund