ELSS vs Tax Saving FD
Equity Linked Savings Scheme (ELSS)
ELSS is the only Mutual Fund eligible for 80C deductions. It is a diversified equity mutual fund that offers tax deductions up to Rs. 1.5 lakhs annually under Section 80C of income tax Act (IT Act 1961).

Prior to the introduction of Feburary Budget 2018, its returns were completely tax-free. However, now it is subject to 10% long-term Capital Gains tax if your capital gains exceed Rs. 1 lakh after one year. Even after the 10% tax cut, ELSS has the potential to deliver superior returns compared to other tax-saving instruments. The perks of ELSS investments are not limited to the taxes saved. The Power of Compounding ensures that your investment is doubled if you invest for, say, 5 years (tenure of tax-saving FD). To add to that, the minimum lock-in period is only 3 years.
Tax Saving Fixed Deposits
Investing money in Fixed Deposits with banks allows individuals and HUFs to claim a tax deduction of up to Rs. 1,50,000 in a financial year. These deposits have a lock-in period of 5 years. You, however, cannot withdraw this deposit prematurely. But you can avail loans against your FDs at competitive rates. The interest earned on these deposits, however, is taxable marginal rate of tax (as per the tax bracket) of the individual.
Highlights of Tax Saver FD
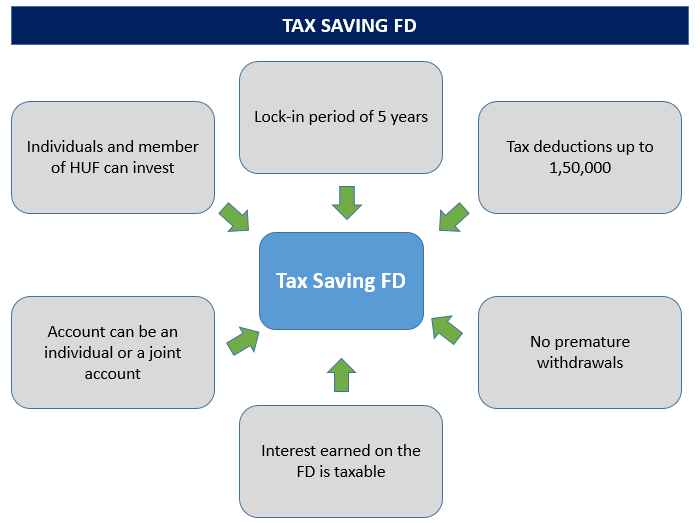
Let us look at the key highlights of the tax saver FD -
- Only individuals and members of hindu undivided family (HUF) can invest in the tax saving FD scheme
- The minimum investment amount of the tax saver FD varies from Bank to bank
- The lock-in period of the tax saving FD is five years
- You can get tax deductions up to Rs. 1,50,000
- There is no provision for premature withdrawal
- You cannot apply for loan against these tax saver FD
- Investment in these tax saver FDs can be done in any private or public sector bank (except co-operative and rural banks)
- Investment made in Post Office Time Deposit for the period of over five years also qualifies as tax saving FD
- You can transfer the Post Office FD from one Post Office to another
- The interest earned from this type of FD is taxable and will be deducted from the source
- Tax saving deposit account can be opened individually as well as jointly.
- In case of a joint account, the tax benefit will be enjoyed by the first holder of the joint account
Talk to our investment specialist
ELSS vs FD - Comparison
Here is a quick overview of the of the differences between ELSS and Tax Saving FDs over various parameters:
| Parameter | FD | ELSS |
|---|---|---|
| Tenure | 5 Years Lock-in | 3 Years Lock-in |
| Returns | 7.00 - 8.00 % (Compounded Annually) | No Assured Divividend / Return as it market linked generally around 16 - 17% per annum |
| Min. Investment | Rs. 1000 | Rs. 500 |
| Max. Investment | No Upper Limit | No Upper Limit |
| Amount Eligible for Deduction under 80c | Rs. 1.5 Lakhs | Rs. 1.5 Lakhs |
| Taxation for Interest/return | Interest Taxable | Gains up to Rs. 1 lakh are free of tax. Tax at 10% applies to gains above Rs. 1 lakh |
| Safety/Ratings | Safe | Bit Risky |
| Liquidity | You cannot withdraw tax saving FD before 5 years | You may exit or withdraw ELSS after 3 years. |
| Online option | Not all banks offer an online facility to open an FD | One can start an ELSS online – as a lump sum or SIP |
Fund Selection Methodology used to find 5 funds
Top ELSS Mutual Funds FY 26 - 27
Fund NAV Net Assets (Cr) 3 MO (%) 6 MO (%) 1 YR (%) 3 YR (%) 5 YR (%) 2024 (%) IDBI Equity Advantage Fund Growth ₹43.39
↑ 0.04 ₹485 9.7 15.1 16.9 20.8 10 Motilal Oswal Long Term Equity Fund Growth ₹54.5313
↑ 0.05 ₹4,862 3.1 16 1.6 20.5 16.4 -9.1 Baroda Pioneer ELSS 96 Growth ₹68.6676
↑ 0.33 ₹210 -6.1 -3.5 17.6 16.7 11.6 JM Tax Gain Fund Growth ₹50.0254
↓ -0.18 ₹232 6.7 7.2 2.6 14.8 14.1 2.5 BNP Paribas Long Term Equity Fund (ELSS) Growth ₹97.9053
↓ -0.28 ₹897 2.5 2.4 1.9 14.6 11.8 4.8 Note: Returns up to 1 year are on absolute basis & more than 1 year are on CAGR basis. as on 28 Jul 23 Research Highlights & Commentary of 5 Funds showcased
Commentary IDBI Equity Advantage Fund Motilal Oswal Long Term Equity Fund Baroda Pioneer ELSS 96 JM Tax Gain Fund BNP Paribas Long Term Equity Fund (ELSS) Point 1 Lower mid AUM (₹485 Cr). Highest AUM (₹4,862 Cr). Bottom quartile AUM (₹210 Cr). Bottom quartile AUM (₹232 Cr). Upper mid AUM (₹897 Cr). Point 2 Established history (12+ yrs). Established history (11+ yrs). Established history (11+ yrs). Established history (18+ yrs). Oldest track record among peers (20 yrs). Point 3 Top rated. Not Rated. Not Rated. Rating: 3★ (upper mid). Rating: 3★ (lower mid). Point 4 Risk profile: Moderately High. Risk profile: Moderately High. Risk profile: Moderately High. Risk profile: Moderately High. Risk profile: Moderately High. Point 5 5Y return: 9.97% (bottom quartile). 5Y return: 16.39% (top quartile). 5Y return: 11.62% (bottom quartile). 5Y return: 14.14% (upper mid). 5Y return: 11.84% (lower mid). Point 6 3Y return: 20.84% (top quartile). 3Y return: 20.49% (upper mid). 3Y return: 16.70% (lower mid). 3Y return: 14.80% (bottom quartile). 3Y return: 14.61% (bottom quartile). Point 7 1Y return: 16.92% (upper mid). 1Y return: 1.60% (bottom quartile). 1Y return: 17.56% (top quartile). 1Y return: 2.61% (lower mid). 1Y return: 1.90% (bottom quartile). Point 8 Alpha: 1.78 (bottom quartile). Alpha: 6.27 (top quartile). Alpha: 5.69 (upper mid). Alpha: 4.31 (lower mid). Alpha: 2.78 (bottom quartile). Point 9 Sharpe: 1.21 (upper mid). Sharpe: 0.02 (lower mid). Sharpe: 2.51 (top quartile). Sharpe: -0.11 (bottom quartile). Sharpe: -0.15 (bottom quartile). Point 10 Information ratio: -1.13 (bottom quartile). Information ratio: 0.76 (top quartile). Information ratio: -0.09 (bottom quartile). Information ratio: 0.50 (lower mid). Information ratio: 0.58 (upper mid). IDBI Equity Advantage Fund
Motilal Oswal Long Term Equity Fund
Baroda Pioneer ELSS 96
JM Tax Gain Fund
BNP Paribas Long Term Equity Fund (ELSS)
*Below is the list of funds having AUM between 100 - 15000 Crore & having fund age of 3 Years of above. Based on 3 Year Performance.
The Scheme will seek to invest predominantly in a diversified portfolio of equity and equity related instruments with the objective to provide investors with opportunities for capital appreciation and income along with the benefit of income-tax deduction(under section 80C of the Income-tax Act, 1961) on their investments. Investments in this scheme would be subject to a statutory lock-in of 3 years from the date of allotment to be eligible for income-tax benefits under Section 80C. There can be no assurance that the investment objective under the scheme will be realized. Below is the key information for IDBI Equity Advantage Fund Returns up to 1 year are on (Erstwhile Motilal Oswal MOSt Focused Long Term Fund) The investment objective of the Scheme is to generate long-term capital appreciation from a diversified portfolio of predominantly equity and equity related instruments. However, there can be no assurance or guarantee that the investment objective of the Scheme would be achieved. Research Highlights for Motilal Oswal Long Term Equity Fund Below is the key information for Motilal Oswal Long Term Equity Fund Returns up to 1 year are on The main objective of the scheme is to provide the investor long term capital growth as also tax benefit under section 80C of the Income Tax Act, 1961. Research Highlights for Baroda Pioneer ELSS 96 Below is the key information for Baroda Pioneer ELSS 96 Returns up to 1 year are on The investment objective is to generate long-term capital growth from a diversified and actively managed portfolio of equity and equity related securities and to enable investors a deduction from total income, as permitted under the Income Tax Act, 1961 from time to time. However, there can be no assurance that the investment objectives of the Scheme will be realized. The Scheme does not guarantee/indicate any returns. Research Highlights for JM Tax Gain Fund Below is the key information for JM Tax Gain Fund Returns up to 1 year are on The investment objective of the Scheme is to generate long-term capital growth from a diversified and actively managed portfolio of equity and equity related securities along with income tax rebate, as may be prevalent fromtime to time. However, there can be no assurance that the investment objective of the Scheme will be achieved. The Scheme does not guarantee / indicate any returns. Research Highlights for BNP Paribas Long Term Equity Fund (ELSS) Below is the key information for BNP Paribas Long Term Equity Fund (ELSS) Returns up to 1 year are on 1. IDBI Equity Advantage Fund
IDBI Equity Advantage Fund
Growth Launch Date 10 Sep 13 NAV (28 Jul 23) ₹43.39 ↑ 0.04 (0.09 %) Net Assets (Cr) ₹485 on 30 Jun 23 Category Equity - ELSS AMC IDBI Asset Management Limited Rating ☆☆☆ Risk Moderately High Expense Ratio 2.39 Sharpe Ratio 1.21 Information Ratio -1.13 Alpha Ratio 1.78 Min Investment 500 Min SIP Investment 500 Exit Load NIL Growth of 10,000 investment over the years.
Date Value 30 Jun 21 ₹10,000 30 Jun 22 ₹9,909 30 Jun 23 ₹12,418 Returns for IDBI Equity Advantage Fund
absolute basis & more than 1 year are on CAGR (Compound Annual Growth Rate) basis. as on 28 Jul 23 Duration Returns 1 Month 3.1% 3 Month 9.7% 6 Month 15.1% 1 Year 16.9% 3 Year 20.8% 5 Year 10% 10 Year 15 Year Since launch 16% Historical performance (Yearly) on absolute basis
Year Returns 2024 2023 2022 2021 2020 2019 2018 2017 2016 2015 Fund Manager information for IDBI Equity Advantage Fund
Name Since Tenure Data below for IDBI Equity Advantage Fund as on 30 Jun 23
Equity Sector Allocation
Sector Value Asset Allocation
Asset Class Value Top Securities Holdings / Portfolio
Name Holding Value Quantity 2. Motilal Oswal Long Term Equity Fund
Motilal Oswal Long Term Equity Fund
Growth Launch Date 21 Jan 15 NAV (24 Jul 26) ₹54.5313 ↑ 0.05 (0.09 %) Net Assets (Cr) ₹4,862 on 30 Jun 26 Category Equity - ELSS AMC Motilal Oswal Asset Management Co. Ltd Rating Risk Moderately High Expense Ratio 1.65 Sharpe Ratio 0.02 Information Ratio 0.76 Alpha Ratio 6.27 Min Investment 500 Min SIP Investment 500 Exit Load NIL Growth of 10,000 investment over the years.
Date Value 30 Jun 21 ₹10,000 30 Jun 22 ₹9,362 30 Jun 23 ₹12,562 30 Jun 24 ₹19,819 30 Jun 25 ₹21,898 30 Jun 26 ₹22,806 Returns for Motilal Oswal Long Term Equity Fund
absolute basis & more than 1 year are on CAGR (Compound Annual Growth Rate) basis. as on 28 Jul 23 Duration Returns 1 Month -1.6% 3 Month 3.1% 6 Month 16% 1 Year 1.6% 3 Year 20.5% 5 Year 16.4% 10 Year 15 Year Since launch 15.9% Historical performance (Yearly) on absolute basis
Year Returns 2024 -9.1% 2023 47.7% 2022 37% 2021 1.8% 2020 32.1% 2019 8.8% 2018 13.2% 2017 -8.7% 2016 44% 2015 12.5% Fund Manager information for Motilal Oswal Long Term Equity Fund
Name Since Tenure Ajay Khandelwal 11 Dec 23 2.55 Yr. Ankit Agarwal 16 Mar 26 0.29 Yr. Rakesh Shetty 22 Nov 22 3.61 Yr. Atul Mehra 1 Oct 24 1.75 Yr. Data below for Motilal Oswal Long Term Equity Fund as on 30 Jun 26
Equity Sector Allocation
Sector Value Financial Services 25.8% Industrials 23.55% Consumer Cyclical 16.57% Basic Materials 13.61% Technology 13.23% Health Care 4.78% Asset Allocation
Asset Class Value Cash 2.46% Equity 97.54% Top Securities Holdings / Portfolio
Name Holding Value Quantity Multi Commodity Exchange of India Ltd (Financial Services)
Equity, Since 29 Feb 24 | MCX7% ₹337 Cr 1,140,862
↓ -55,178 OneSource Specialty Pharma Ltd (Healthcare)
Equity, Since 31 Jan 25 | ONESOURCE5% ₹223 Cr 1,221,228 Zen Technologies Ltd (Industrials)
Equity, Since 31 Dec 24 | ZENTEC4% ₹203 Cr 1,218,528 Muthoot Finance Ltd (Financial Services)
Equity, Since 30 Jun 25 | MUTHOOTFIN4% ₹197 Cr 588,318
↑ 41,444 Ather Energy Ltd (Consumer Cyclical)
Equity, Since 31 Oct 25 | ATHERENERG4% ₹192 Cr 1,990,789
↓ -310,680 Waaree Energies Ltd (Technology)
Equity, Since 31 Oct 24 | WAAREEENER4% ₹188 Cr 600,000
↓ -27,718 Jain Resource Recycling Ltd (Basic Materials)
Equity, Since 31 Oct 25 | JAINREC4% ₹187 Cr 5,000,000
↓ -11,074 PTC Industries Ltd (Industrials)
Equity, Since 30 Sep 24 | 5390064% ₹186 Cr 115,181 Suzlon Energy Ltd (Industrials)
Equity, Since 31 Jan 24 | SUZLON4% ₹185 Cr 32,483,092 Apar Industries Ltd (Industrials)
Equity, Since 31 Dec 23 | APARINDS4% ₹176 Cr 134,000
↓ -48,754 3. Baroda Pioneer ELSS 96
Baroda Pioneer ELSS 96
Growth Launch Date 2 Mar 15 NAV (11 Mar 22) ₹68.6676 ↑ 0.33 (0.48 %) Net Assets (Cr) ₹210 on 31 Jan 22 Category Equity - ELSS AMC Baroda Pioneer Asset Management Co. Ltd. Rating Risk Moderately High Expense Ratio 2.55 Sharpe Ratio 2.51 Information Ratio -0.09 Alpha Ratio 5.69 Min Investment 500 Min SIP Investment 500 Exit Load NIL Growth of 10,000 investment over the years.
Date Value 30 Jun 21 ₹10,000 Returns for Baroda Pioneer ELSS 96
absolute basis & more than 1 year are on CAGR (Compound Annual Growth Rate) basis. as on 28 Jul 23 Duration Returns 1 Month -3.9% 3 Month -6.1% 6 Month -3.5% 1 Year 17.6% 3 Year 16.7% 5 Year 11.6% 10 Year 15 Year Since launch 8.4% Historical performance (Yearly) on absolute basis
Year Returns 2024 2023 2022 2021 2020 2019 2018 2017 2016 2015 Fund Manager information for Baroda Pioneer ELSS 96
Name Since Tenure Data below for Baroda Pioneer ELSS 96 as on 31 Jan 22
Equity Sector Allocation
Sector Value Asset Allocation
Asset Class Value Top Securities Holdings / Portfolio
Name Holding Value Quantity 4. JM Tax Gain Fund
JM Tax Gain Fund
Growth Launch Date 31 Mar 08 NAV (24 Jul 26) ₹50.0254 ↓ -0.18 (-0.35 %) Net Assets (Cr) ₹232 on 30 Jun 26 Category Equity - ELSS AMC JM Financial Asset Management Limited Rating ☆☆☆ Risk Moderately High Expense Ratio 2.37 Sharpe Ratio -0.11 Information Ratio 0.5 Alpha Ratio 4.31 Min Investment 500 Min SIP Investment 500 Exit Load NIL Growth of 10,000 investment over the years.
Date Value 30 Jun 21 ₹10,000 30 Jun 22 ₹9,919 30 Jun 23 ₹12,968 30 Jun 24 ₹19,302 30 Jun 25 ₹19,540 30 Jun 26 ₹19,895 Returns for JM Tax Gain Fund
absolute basis & more than 1 year are on CAGR (Compound Annual Growth Rate) basis. as on 28 Jul 23 Duration Returns 1 Month 0.4% 3 Month 6.7% 6 Month 7.2% 1 Year 2.6% 3 Year 14.8% 5 Year 14.1% 10 Year 15 Year Since launch 9.2% Historical performance (Yearly) on absolute basis
Year Returns 2024 2.5% 2023 29% 2022 30.9% 2021 0.5% 2020 32.2% 2019 18.3% 2018 14.9% 2017 -4.6% 2016 42.6% 2015 5.2% Fund Manager information for JM Tax Gain Fund
Name Since Tenure Satish Ramanathan 1 Oct 24 1.75 Yr. Asit Bhandarkar 31 Dec 21 4.5 Yr. Ruchi Fozdar 4 Oct 24 1.74 Yr. Deepak Gupta 11 Apr 25 1.22 Yr. Data below for JM Tax Gain Fund as on 30 Jun 26
Equity Sector Allocation
Sector Value Financial Services 27.9% Consumer Cyclical 17.25% Technology 11.32% Industrials 9.8% Basic Materials 8.63% Health Care 6.75% Consumer Defensive 3.63% Real Estate 3.5% Energy 3.16% Utility 2.72% Communication Services 2.7% Asset Allocation
Asset Class Value Cash 2.63% Equity 97.37% Top Securities Holdings / Portfolio
Name Holding Value Quantity HDFC Bank Ltd (Financial Services)
Equity, Since 31 Dec 11 | HDFCBANK3% ₹7 Cr 98,262 Reliance Industries Ltd (Energy)
Equity, Since 30 Jun 25 | RELIANCE3% ₹7 Cr 53,400 Syrma SGS Technology Ltd (Technology)
Equity, Since 31 May 25 | SYRMA3% ₹6 Cr 59,457 ICICI Bank Ltd (Financial Services)
Equity, Since 31 Mar 22 | ICICIBANK3% ₹6 Cr 48,500 Larsen & Toubro Ltd (Industrials)
Equity, Since 30 Nov 10 | LT3% ₹6 Cr 14,947 Adani Power Ltd (Utilities)
Equity, Since 31 Mar 26 | ADANIPOWER3% ₹6 Cr 249,000 Bharti Airtel Ltd (Communication Services)
Equity, Since 31 Mar 24 | BHARTIARTL3% ₹6 Cr 32,950 Karur Vysya Bank Ltd (Financial Services)
Equity, Since 30 Apr 25 | KARURVYSYA3% ₹6 Cr 199,000 Lupin Ltd (Healthcare)
Equity, Since 31 May 25 | LUPIN3% ₹6 Cr 25,000 Polycab India Ltd (Industrials)
Equity, Since 31 Jul 25 | POLYCAB3% ₹6 Cr 5,900 5. BNP Paribas Long Term Equity Fund (ELSS)
BNP Paribas Long Term Equity Fund (ELSS)
Growth Launch Date 5 Jan 06 NAV (24 Jul 26) ₹97.9053 ↓ -0.28 (-0.29 %) Net Assets (Cr) ₹897 on 30 Jun 26 Category Equity - ELSS AMC BNP Paribas Asset Mgmt India Pvt. Ltd Rating ☆☆☆ Risk Moderately High Expense Ratio 2.21 Sharpe Ratio -0.15 Information Ratio 0.58 Alpha Ratio 2.78 Min Investment 500 Min SIP Investment 500 Exit Load NIL Growth of 10,000 investment over the years.
Date Value 30 Jun 21 ₹10,000 30 Jun 22 ₹9,480 30 Jun 23 ₹11,609 30 Jun 24 ₹16,494 30 Jun 25 ₹17,507 30 Jun 26 ₹17,827 Returns for BNP Paribas Long Term Equity Fund (ELSS)
absolute basis & more than 1 year are on CAGR (Compound Annual Growth Rate) basis. as on 28 Jul 23 Duration Returns 1 Month -0.2% 3 Month 2.5% 6 Month 2.4% 1 Year 1.9% 3 Year 14.6% 5 Year 11.8% 10 Year 15 Year Since launch 11.7% Historical performance (Yearly) on absolute basis
Year Returns 2024 4.8% 2023 23.6% 2022 31.3% 2021 -2.1% 2020 23.6% 2019 17.8% 2018 14.3% 2017 -9.3% 2016 42.3% 2015 -6.6% Fund Manager information for BNP Paribas Long Term Equity Fund (ELSS)
Name Since Tenure Sanjay Chawla 14 Mar 22 4.3 Yr. Yash Mehta 1 May 26 0.16 Yr. Data below for BNP Paribas Long Term Equity Fund (ELSS) as on 30 Jun 26
Equity Sector Allocation
Sector Value Financial Services 28.78% Industrials 15.65% Consumer Cyclical 14.19% Basic Materials 8.98% Technology 7.08% Health Care 6.37% Energy 5.79% Consumer Defensive 4.17% Communication Services 3.01% Utility 1.38% Asset Allocation
Asset Class Value Cash 4.57% Equity 95.4% Top Securities Holdings / Portfolio
Name Holding Value Quantity HDFC Bank Ltd (Financial Services)
Equity, Since 31 Oct 08 | HDFCBANK5% ₹41 Cr 550,000
↓ -106,320 Reliance Industries Ltd (Energy)
Equity, Since 31 Oct 18 | RELIANCE4% ₹37 Cr 281,800 Hitachi Energy India Ltd Ordinary Shares (Industrials)
Equity, Since 31 Aug 23 | POWERINDIA4% ₹34 Cr 8,766 State Bank of India (Financial Services)
Equity, Since 31 Mar 22 | SBIN4% ₹32 Cr 330,000
↑ 52,000 ICICI Bank Ltd (Financial Services)
Equity, Since 31 Oct 12 | ICICIBANK4% ₹31 Cr 250,000
↓ -79,900 Bharat Heavy Electricals Ltd (Industrials)
Equity, Since 30 Nov 24 | BHEL3% ₹29 Cr 701,626
↓ -119,754 Bharti Airtel Ltd (Communication Services)
Equity, Since 31 May 19 | BHARTIARTL3% ₹27 Cr 144,966 Larsen & Toubro Ltd (Industrials)
Equity, Since 30 Apr 20 | LT3% ₹26 Cr 65,000
↑ 5,000 Hindalco Industries Ltd (Basic Materials)
Equity, Since 28 Feb 25 | HINDALCO3% ₹25 Cr 220,000 Navin Fluorine International Ltd (Basic Materials)
Equity, Since 31 Jul 24 | NAVINFLUOR3% ₹23 Cr 31,685
Should you Invest in ELSS or Tax saving FDs?
Before getting into new investment ventures, people consider a lot of things. Age, investment horizon and risk appetite are a few of the important factors. People who want dual benefits of wealth growth and tax benefits prefer ELSS. For instance, new investors with a long investment horizon and higher risk appetite find ELSS a sensible option. People nearing retirement can invest in tax saving FDs as they tend to have low risks and guaranteed returns over long term (5 year or above atleast).
How to Invest in ELSS Online?
Open Free Investment Account for Lifetime at Fincash.com.
Complete your Registration and KYC Process
Upload Documents (PAN, Aadhaar, etc.). And, You are Ready to Invest!
All efforts have been made to ensure the information provided here is accurate. However, no guarantees are made regarding correctness of data. Please verify with scheme information document before making any investment.


AMFI Registration No. 112358 | CIN: U74999MH2016PTC282153
Shepard Technologies Pvt. Ltd. (with ARN code 112358) makes no warranties or representations, express or implied, on products offered through the platform. It accepts no liability for any damages or losses, however caused, in connection with the use of, or on the reliance of its product or related services. Terms and conditions of the website are applicable.
©2026 Shepard Technologies Private Limited. All Rights Reserved
Research Highlights for IDBI Equity Advantage Fund