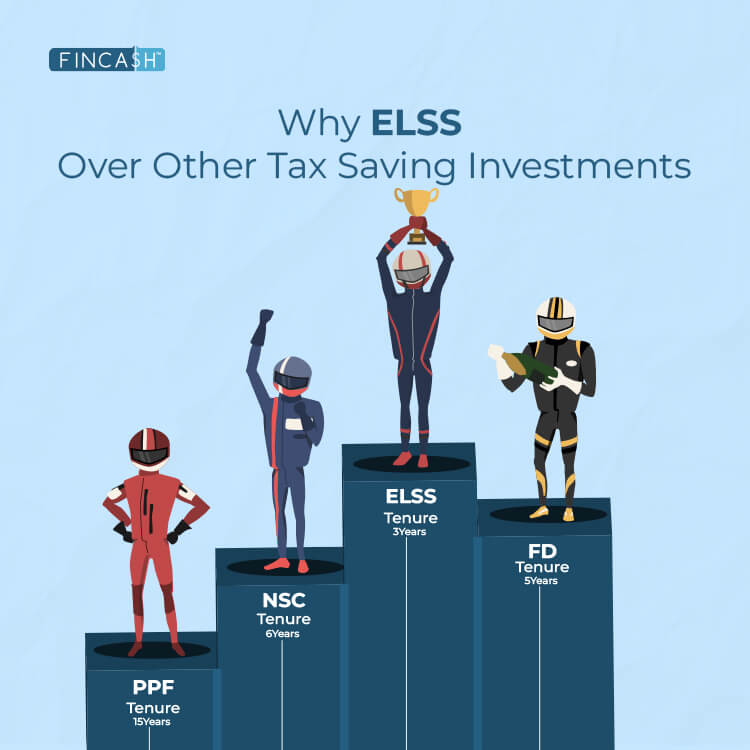
Why ELSS Over Other Tax Saving Investments
ELSS funds also known as Equity Linked Savings Scheme is an equity-diversified tax saving Mutual Fund that majorly invests its assets in equities or equity-linked instruments like stock markets. The ELSS Mutual Funds offer market-linked returns, which are volatile and are dependent on the market conditions.
However, financial advisors suggest Investing in ELSS funds for a long duration, as these ELSS Mutual funds generate best returns when invested for a longer duration. In the recent reports, it was seen that ELSS funds generated around 20%-30% returns when invested for 3 years, which is much more than the returns generated by other Mutual Funds.
Comparison Of ELSS & Other Tax Saving Investment Options
The comparison of ELSS and other tax saving is based on parameters like tenure, returns, eligibility for deduction under 80c, etc.
Let's have a look:
| Parameter | PPF | NSC | FD | ELSS |
|---|---|---|---|---|
| Tenure | 15 years | 6 years | 5 Years | 3 years |
| Returns | 7.60 % (Compounded Annually) | 7.60 % (Compounded Annually) | 7.00 - 8.00 % (Compounded Annually) | No Assured Divividend / Return as it market linked |
| Min. Investment | Rs. 500 | Rs. 100 | Rs. 1000 | Rs. 500 |
| Max. Investment | Rs. 1.5 Lakhs | No Upper Limit | No Upper Limit | No Upper Limit |
| Amount Eligible for Deduction under 80c | Rs. 1.5 Lakhs | Rs. 1.5 Lakhs | Rs. 1.5 Lakhs | Rs. 1.5 Lakhs |
| Taxation for Interest/return | Tax-Free | Interest Taxable | Interest Taxable | Gains up to Rs 1 lakh are free of tax. Tax at 10% applies to gains above Rs 1 lakh |
| Safety/Ratings | Safe | Safe | Safe | Risk |
Fund Selection Methodology used to find 5 funds
Top 5 ELSS Funds To Invest In 2026
Below is the list of Fund having Net Assets/AUM between 100 - 200 Crores.
Fund NAV Net Assets (Cr) 3 MO (%) 6 MO (%) 1 YR (%) 3 YR (%) 5 YR (%) 2024 (%) IDBI Equity Advantage Fund Growth ₹43.39
↑ 0.04 ₹485 9.7 15.1 16.9 20.8 10 HDFC Long Term Advantage Fund Growth ₹595.168
↑ 0.28 ₹1,318 1.2 15.4 35.5 20.6 17.4 Baroda Pioneer ELSS 96 Growth ₹68.6676
↑ 0.33 ₹210 -6.1 -3.5 17.6 16.7 11.6 JM Tax Gain Fund Growth ₹50.6099
↓ -0.26 ₹232 6.8 6.6 3.5 15.3 14.4 2.5 BNP Paribas Long Term Equity Fund (ELSS) Growth ₹98.6526
↓ -0.68 ₹897 1.9 1.8 2.6 14.9 12.1 4.8 Note: Returns up to 1 year are on absolute basis & more than 1 year are on CAGR basis. as on 28 Jul 23 Research Highlights & Commentary of 5 Funds showcased
Commentary IDBI Equity Advantage Fund HDFC Long Term Advantage Fund Baroda Pioneer ELSS 96 JM Tax Gain Fund BNP Paribas Long Term Equity Fund (ELSS) Point 1 Lower mid AUM (₹485 Cr). Highest AUM (₹1,318 Cr). Bottom quartile AUM (₹210 Cr). Bottom quartile AUM (₹232 Cr). Upper mid AUM (₹897 Cr). Point 2 Established history (12+ yrs). Oldest track record among peers (25 yrs). Established history (11+ yrs). Established history (18+ yrs). Established history (20+ yrs). Point 3 Top rated. Rating: 3★ (upper mid). Not Rated. Rating: 3★ (lower mid). Rating: 3★ (bottom quartile). Point 4 Risk profile: Moderately High. Risk profile: Moderately High. Risk profile: Moderately High. Risk profile: Moderately High. Risk profile: Moderately High. Point 5 5Y return: 9.97% (bottom quartile). 5Y return: 17.39% (top quartile). 5Y return: 11.62% (bottom quartile). 5Y return: 14.35% (upper mid). 5Y return: 12.07% (lower mid). Point 6 3Y return: 20.84% (top quartile). 3Y return: 20.64% (upper mid). 3Y return: 16.70% (lower mid). 3Y return: 15.34% (bottom quartile). 3Y return: 14.89% (bottom quartile). Point 7 1Y return: 16.92% (lower mid). 1Y return: 35.51% (top quartile). 1Y return: 17.56% (upper mid). 1Y return: 3.54% (bottom quartile). 1Y return: 2.62% (bottom quartile). Point 8 Alpha: 1.78 (bottom quartile). Alpha: 1.75 (bottom quartile). Alpha: 5.69 (top quartile). Alpha: 4.31 (upper mid). Alpha: 2.78 (lower mid). Point 9 Sharpe: 1.21 (lower mid). Sharpe: 2.27 (upper mid). Sharpe: 2.51 (top quartile). Sharpe: -0.11 (bottom quartile). Sharpe: -0.15 (bottom quartile). Point 10 Information ratio: -1.13 (bottom quartile). Information ratio: -0.15 (bottom quartile). Information ratio: -0.09 (lower mid). Information ratio: 0.50 (upper mid). Information ratio: 0.58 (top quartile). IDBI Equity Advantage Fund
HDFC Long Term Advantage Fund
Baroda Pioneer ELSS 96
JM Tax Gain Fund
BNP Paribas Long Term Equity Fund (ELSS)
Talk to our investment specialist
The Scheme will seek to invest predominantly in a diversified portfolio of equity and equity related instruments with the objective to provide investors with opportunities for capital appreciation and income along with the benefit of income-tax deduction(under section 80C of the Income-tax Act, 1961) on their investments. Investments in this scheme would be subject to a statutory lock-in of 3 years from the date of allotment to be eligible for income-tax benefits under Section 80C. There can be no assurance that the investment objective under the scheme will be realized. Below is the key information for IDBI Equity Advantage Fund Returns up to 1 year are on To generate long term capital appreciation from a portfolio that is predominantly in equity and equity related instruments Research Highlights for HDFC Long Term Advantage Fund Below is the key information for HDFC Long Term Advantage Fund Returns up to 1 year are on The main objective of the scheme is to provide the investor long term capital growth as also tax benefit under section 80C of the Income Tax Act, 1961. Research Highlights for Baroda Pioneer ELSS 96 Below is the key information for Baroda Pioneer ELSS 96 Returns up to 1 year are on The investment objective is to generate long-term capital growth from a diversified and actively managed portfolio of equity and equity related securities and to enable investors a deduction from total income, as permitted under the Income Tax Act, 1961 from time to time. However, there can be no assurance that the investment objectives of the Scheme will be realized. The Scheme does not guarantee/indicate any returns. Research Highlights for JM Tax Gain Fund Below is the key information for JM Tax Gain Fund Returns up to 1 year are on The investment objective of the Scheme is to generate long-term capital growth from a diversified and actively managed portfolio of equity and equity related securities along with income tax rebate, as may be prevalent fromtime to time. However, there can be no assurance that the investment objective of the Scheme will be achieved. The Scheme does not guarantee / indicate any returns. Research Highlights for BNP Paribas Long Term Equity Fund (ELSS) Below is the key information for BNP Paribas Long Term Equity Fund (ELSS) Returns up to 1 year are on 1. IDBI Equity Advantage Fund
IDBI Equity Advantage Fund
Growth Launch Date 10 Sep 13 NAV (28 Jul 23) ₹43.39 ↑ 0.04 (0.09 %) Net Assets (Cr) ₹485 on 30 Jun 23 Category Equity - ELSS AMC IDBI Asset Management Limited Rating ☆☆☆ Risk Moderately High Expense Ratio 2.39 Sharpe Ratio 1.21 Information Ratio -1.13 Alpha Ratio 1.78 Min Investment 500 Min SIP Investment 500 Exit Load NIL Growth of 10,000 investment over the years.
Date Value 30 Jun 21 ₹10,000 30 Jun 22 ₹9,909 30 Jun 23 ₹12,418 Returns for IDBI Equity Advantage Fund
absolute basis & more than 1 year are on CAGR (Compound Annual Growth Rate) basis. as on 28 Jul 23 Duration Returns 1 Month 3.1% 3 Month 9.7% 6 Month 15.1% 1 Year 16.9% 3 Year 20.8% 5 Year 10% 10 Year 15 Year Since launch 16% Historical performance (Yearly) on absolute basis
Year Returns 2024 2023 2022 2021 2020 2019 2018 2017 2016 2015 Fund Manager information for IDBI Equity Advantage Fund
Name Since Tenure Data below for IDBI Equity Advantage Fund as on 30 Jun 23
Equity Sector Allocation
Sector Value Asset Allocation
Asset Class Value Top Securities Holdings / Portfolio
Name Holding Value Quantity 2. HDFC Long Term Advantage Fund
HDFC Long Term Advantage Fund
Growth Launch Date 2 Jan 01 NAV (14 Jan 22) ₹595.168 ↑ 0.28 (0.05 %) Net Assets (Cr) ₹1,318 on 30 Nov 21 Category Equity - ELSS AMC HDFC Asset Management Company Limited Rating ☆☆☆ Risk Moderately High Expense Ratio 2.25 Sharpe Ratio 2.27 Information Ratio -0.15 Alpha Ratio 1.75 Min Investment 500 Min SIP Investment 500 Exit Load NIL Growth of 10,000 investment over the years.
Date Value 30 Jun 21 ₹10,000
Purchase not allowed Returns for HDFC Long Term Advantage Fund
absolute basis & more than 1 year are on CAGR (Compound Annual Growth Rate) basis. as on 28 Jul 23 Duration Returns 1 Month 4.4% 3 Month 1.2% 6 Month 15.4% 1 Year 35.5% 3 Year 20.6% 5 Year 17.4% 10 Year 15 Year Since launch 21.4% Historical performance (Yearly) on absolute basis
Year Returns 2024 2023 2022 2021 2020 2019 2018 2017 2016 2015 Fund Manager information for HDFC Long Term Advantage Fund
Name Since Tenure Data below for HDFC Long Term Advantage Fund as on 30 Nov 21
Equity Sector Allocation
Sector Value Asset Allocation
Asset Class Value Top Securities Holdings / Portfolio
Name Holding Value Quantity 3. Baroda Pioneer ELSS 96
Baroda Pioneer ELSS 96
Growth Launch Date 2 Mar 15 NAV (11 Mar 22) ₹68.6676 ↑ 0.33 (0.48 %) Net Assets (Cr) ₹210 on 31 Jan 22 Category Equity - ELSS AMC Baroda Pioneer Asset Management Co. Ltd. Rating Risk Moderately High Expense Ratio 2.55 Sharpe Ratio 2.51 Information Ratio -0.09 Alpha Ratio 5.69 Min Investment 500 Min SIP Investment 500 Exit Load NIL Growth of 10,000 investment over the years.
Date Value 30 Jun 21 ₹10,000 Returns for Baroda Pioneer ELSS 96
absolute basis & more than 1 year are on CAGR (Compound Annual Growth Rate) basis. as on 28 Jul 23 Duration Returns 1 Month -3.9% 3 Month -6.1% 6 Month -3.5% 1 Year 17.6% 3 Year 16.7% 5 Year 11.6% 10 Year 15 Year Since launch 8.4% Historical performance (Yearly) on absolute basis
Year Returns 2024 2023 2022 2021 2020 2019 2018 2017 2016 2015 Fund Manager information for Baroda Pioneer ELSS 96
Name Since Tenure Data below for Baroda Pioneer ELSS 96 as on 31 Jan 22
Equity Sector Allocation
Sector Value Asset Allocation
Asset Class Value Top Securities Holdings / Portfolio
Name Holding Value Quantity 4. JM Tax Gain Fund
JM Tax Gain Fund
Growth Launch Date 31 Mar 08 NAV (22 Jul 26) ₹50.6099 ↓ -0.26 (-0.50 %) Net Assets (Cr) ₹232 on 30 Jun 26 Category Equity - ELSS AMC JM Financial Asset Management Limited Rating ☆☆☆ Risk Moderately High Expense Ratio 2.37 Sharpe Ratio -0.11 Information Ratio 0.5 Alpha Ratio 4.31 Min Investment 500 Min SIP Investment 500 Exit Load NIL Growth of 10,000 investment over the years.
Date Value 30 Jun 21 ₹10,000 30 Jun 22 ₹9,919 30 Jun 23 ₹12,968 30 Jun 24 ₹19,302 30 Jun 25 ₹19,540 30 Jun 26 ₹19,895 Returns for JM Tax Gain Fund
absolute basis & more than 1 year are on CAGR (Compound Annual Growth Rate) basis. as on 28 Jul 23 Duration Returns 1 Month 1.6% 3 Month 6.8% 6 Month 6.6% 1 Year 3.5% 3 Year 15.3% 5 Year 14.4% 10 Year 15 Year Since launch 9.3% Historical performance (Yearly) on absolute basis
Year Returns 2024 2.5% 2023 29% 2022 30.9% 2021 0.5% 2020 32.2% 2019 18.3% 2018 14.9% 2017 -4.6% 2016 42.6% 2015 5.2% Fund Manager information for JM Tax Gain Fund
Name Since Tenure Satish Ramanathan 1 Oct 24 1.75 Yr. Asit Bhandarkar 31 Dec 21 4.5 Yr. Ruchi Fozdar 4 Oct 24 1.74 Yr. Deepak Gupta 11 Apr 25 1.22 Yr. Data below for JM Tax Gain Fund as on 30 Jun 26
Equity Sector Allocation
Sector Value Financial Services 27.9% Consumer Cyclical 17.25% Technology 11.32% Industrials 9.8% Basic Materials 8.63% Health Care 6.75% Consumer Defensive 3.63% Real Estate 3.5% Energy 3.16% Utility 2.72% Communication Services 2.7% Asset Allocation
Asset Class Value Cash 2.63% Equity 97.37% Top Securities Holdings / Portfolio
Name Holding Value Quantity HDFC Bank Ltd (Financial Services)
Equity, Since 31 Dec 11 | HDFCBANK3% ₹7 Cr 98,262 Reliance Industries Ltd (Energy)
Equity, Since 30 Jun 25 | RELIANCE3% ₹7 Cr 53,400 Syrma SGS Technology Ltd (Technology)
Equity, Since 31 May 25 | SYRMA3% ₹6 Cr 59,457 ICICI Bank Ltd (Financial Services)
Equity, Since 31 Mar 22 | ICICIBANK3% ₹6 Cr 48,500 Larsen & Toubro Ltd (Industrials)
Equity, Since 30 Nov 10 | LT3% ₹6 Cr 14,947 Adani Power Ltd (Utilities)
Equity, Since 31 Mar 26 | ADANIPOWER3% ₹6 Cr 249,000 Bharti Airtel Ltd (Communication Services)
Equity, Since 31 Mar 24 | BHARTIARTL3% ₹6 Cr 32,950 Karur Vysya Bank Ltd (Financial Services)
Equity, Since 30 Apr 25 | KARURVYSYA3% ₹6 Cr 199,000 Lupin Ltd (Healthcare)
Equity, Since 31 May 25 | LUPIN3% ₹6 Cr 25,000 Polycab India Ltd (Industrials)
Equity, Since 31 Jul 25 | POLYCAB3% ₹6 Cr 5,900 5. BNP Paribas Long Term Equity Fund (ELSS)
BNP Paribas Long Term Equity Fund (ELSS)
Growth Launch Date 5 Jan 06 NAV (22 Jul 26) ₹98.6526 ↓ -0.68 (-0.69 %) Net Assets (Cr) ₹897 on 30 Jun 26 Category Equity - ELSS AMC BNP Paribas Asset Mgmt India Pvt. Ltd Rating ☆☆☆ Risk Moderately High Expense Ratio 2.21 Sharpe Ratio -0.15 Information Ratio 0.58 Alpha Ratio 2.78 Min Investment 500 Min SIP Investment 500 Exit Load NIL Growth of 10,000 investment over the years.
Date Value 30 Jun 21 ₹10,000 30 Jun 22 ₹9,480 30 Jun 23 ₹11,609 30 Jun 24 ₹16,494 30 Jun 25 ₹17,507 30 Jun 26 ₹17,827 Returns for BNP Paribas Long Term Equity Fund (ELSS)
absolute basis & more than 1 year are on CAGR (Compound Annual Growth Rate) basis. as on 28 Jul 23 Duration Returns 1 Month -0.1% 3 Month 1.9% 6 Month 1.8% 1 Year 2.6% 3 Year 14.9% 5 Year 12.1% 10 Year 15 Year Since launch 11.8% Historical performance (Yearly) on absolute basis
Year Returns 2024 4.8% 2023 23.6% 2022 31.3% 2021 -2.1% 2020 23.6% 2019 17.8% 2018 14.3% 2017 -9.3% 2016 42.3% 2015 -6.6% Fund Manager information for BNP Paribas Long Term Equity Fund (ELSS)
Name Since Tenure Sanjay Chawla 14 Mar 22 4.3 Yr. Yash Mehta 1 May 26 0.16 Yr. Data below for BNP Paribas Long Term Equity Fund (ELSS) as on 30 Jun 26
Equity Sector Allocation
Sector Value Financial Services 28.78% Industrials 15.65% Consumer Cyclical 14.19% Basic Materials 8.98% Technology 7.08% Health Care 6.37% Energy 5.79% Consumer Defensive 4.17% Communication Services 3.01% Utility 1.38% Asset Allocation
Asset Class Value Cash 4.57% Equity 95.4% Top Securities Holdings / Portfolio
Name Holding Value Quantity HDFC Bank Ltd (Financial Services)
Equity, Since 31 Oct 08 | HDFCBANK5% ₹41 Cr 550,000
↓ -106,320 Reliance Industries Ltd (Energy)
Equity, Since 31 Oct 18 | RELIANCE4% ₹37 Cr 281,800 Hitachi Energy India Ltd Ordinary Shares (Industrials)
Equity, Since 31 Aug 23 | POWERINDIA4% ₹34 Cr 8,766 State Bank of India (Financial Services)
Equity, Since 31 Mar 22 | SBIN4% ₹32 Cr 330,000
↑ 52,000 ICICI Bank Ltd (Financial Services)
Equity, Since 31 Oct 12 | ICICIBANK4% ₹31 Cr 250,000
↓ -79,900 Bharat Heavy Electricals Ltd (Industrials)
Equity, Since 30 Nov 24 | BHEL3% ₹29 Cr 701,626
↓ -119,754 Bharti Airtel Ltd (Communication Services)
Equity, Since 31 May 19 | BHARTIARTL3% ₹27 Cr 144,966 Larsen & Toubro Ltd (Industrials)
Equity, Since 30 Apr 20 | LT3% ₹26 Cr 65,000
↑ 5,000 Hindalco Industries Ltd (Basic Materials)
Equity, Since 28 Feb 25 | HINDALCO3% ₹25 Cr 220,000 Navin Fluorine International Ltd (Basic Materials)
Equity, Since 31 Jul 24 | NAVINFLUOR3% ₹23 Cr 31,685
How ELSS Better Than Other Tax Saving Investments?
There are various Tax Saving Investment options in India among which ELSS is one of the best options. How? Here are some of the reasons mentioned.
High Returns over Long-Term
The ELSS funds allocate the highest number of assets in stock market among other tax saving investments. So, these funds earn best inflation-beating returns amongst all. If invested for a longer duration, the rate of returns of ELSS can easily beat the returns of other traditional debt-oriented investments. Therefore, ELSS Mutual funds provide investors with the best of both worlds- high returns and tax benefits.
Shortest Lock-in Period
The ELSS Mutual Funds have a short lock-in period as compared to the traditional tax saving investment options. The lock-in period of ELSS funds is 3 years while that of PPF is 15 years and of NPS is until retirement. So, by investing in ELSS your money does not get locked for a longer duration and you can stop investing soon after the lock-in is over.
Highly Flexible Investment
The flexibility of ELSS Mutual Funds is much more than all other tax saving investments. Unlike traditional investments, there is no need of investing in only one type of option. ELSS funds enable you to diversify your Portfolio with different kinds of investments. Also, the investors can remain invested in these funds even after the lock-in period is over. So, once the lock-in is over, you can easily choose to remain invested or redeem as per your convenience.
Conclusion
In conclusion, here are a few tips for investors investing in ELSS Funds.
- Start investing in ELSS early
- Invest within your limits
- Do not choose dividend reinvestment
- Redeem slowly and gradually
- Invest via a SIP
All efforts have been made to ensure the information provided here is accurate. However, no guarantees are made regarding correctness of data. Please verify with scheme information document before making any investment.
You Might Also Like


 ?")


AMFI Registration No. 112358 | CIN: U74999MH2016PTC282153
Shepard Technologies Pvt. Ltd. (with ARN code 112358) makes no warranties or representations, express or implied, on products offered through the platform. It accepts no liability for any damages or losses, however caused, in connection with the use of, or on the reliance of its product or related services. Terms and conditions of the website are applicable.
©2026 Shepard Technologies Private Limited. All Rights Reserved
Research Highlights for IDBI Equity Advantage Fund