Best Tax Saving Investments For 2026
Looking for best tax saving investments? Don’t know how to save income tax? Tax saving can be easy if done in a correct manner. There are various smart ways to stay away from paying taxes and save as much as possible. Generally, people indulge into Tax Planning when the financial year is about to end. But, does this ensure prudent investment planning? No! Investing in the early quarters of the financial year is a smarter approach instead. This ensures that you get time to plan your investment and avail the most out of it. Some of the tax saving investments include tax saving Mutual Funds ELSS, PPF, tax saving FD, NPS etc. a detailed list of tax saving investment options is mentioned below.
Some of the Best Investment Plan in India that are beneficial for tax saving include-

Tax Saving ELSS Funds Or Equity Linked Savings Schemes
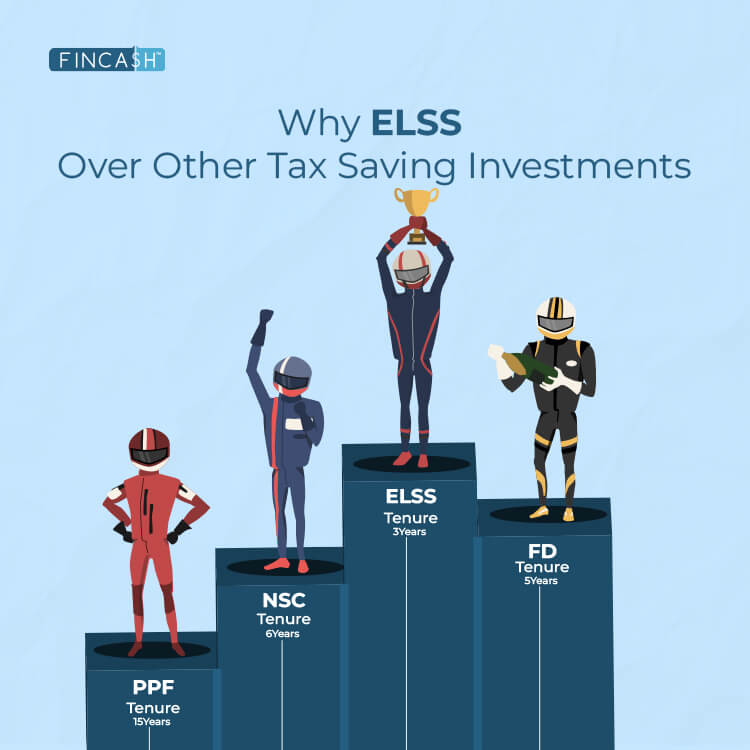
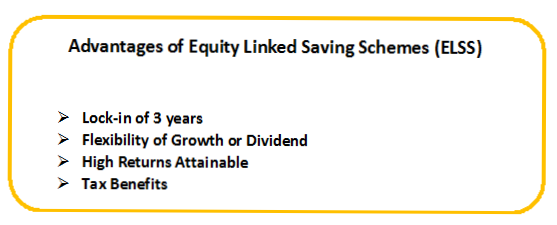
Tax saving is an ideal way of financial planning. ELSS Funds are tax saving schemes that are equity diversified and invest the major part of the fund corpus either in equities or equity-related instruments. Being market-linked, equity-linked savings scheme or ELSS funds offer good returns. ELSS funds are tax saving Mutual Funds that offers tax deductions upto INR 1,50,000 under Section 80C of Income Tax Act.
As per the Budget 2018, ELSS would attract Long Term Capital Gains (LTCG). Investors would be taxed at 10% (with no indexation) under long term capital gain tax. Gains up to INR 1 lakh are free of tax. Tax at 10% applies to gains above INR 1 lakh.
Fund Selection Methodology used to find 3 funds
Top 3 Tax Saving ELSS Funds 2026
Fund NAV Net Assets (Cr) 3 MO (%) 6 MO (%) 1 YR (%) 3 YR (%) 5 YR (%) 2024 (%) HDFC Long Term Advantage Fund Growth ₹595.168
↑ 0.28 ₹1,318 1.2 15.4 35.5 20.6 17.4 Baroda Pioneer ELSS 96 Growth ₹68.6676
↑ 0.33 ₹210 -6.1 -3.5 17.6 16.7 11.6 IDBI Equity Advantage Fund Growth ₹43.39
↑ 0.04 ₹485 9.7 15.1 16.9 20.8 10 Note: Returns up to 1 year are on absolute basis & more than 1 year are on CAGR basis. as on 14 Jan 22 Research Highlights & Commentary of 3 Funds showcased
Commentary HDFC Long Term Advantage Fund Baroda Pioneer ELSS 96 IDBI Equity Advantage Fund Point 1 Highest AUM (₹1,318 Cr). Bottom quartile AUM (₹210 Cr). Lower mid AUM (₹485 Cr). Point 2 Oldest track record among peers (25 yrs). Established history (10+ yrs). Established history (12+ yrs). Point 3 Top rated. Not Rated. Rating: 3★ (lower mid). Point 4 Risk profile: Moderately High. Risk profile: Moderately High. Risk profile: Moderately High. Point 5 5Y return: 17.39% (upper mid). 5Y return: 11.62% (lower mid). 5Y return: 9.97% (bottom quartile). Point 6 3Y return: 20.64% (lower mid). 3Y return: 16.70% (bottom quartile). 3Y return: 20.84% (upper mid). Point 7 1Y return: 35.51% (upper mid). 1Y return: 17.56% (lower mid). 1Y return: 16.92% (bottom quartile). Point 8 Alpha: 1.75 (bottom quartile). Alpha: 5.69 (upper mid). Alpha: 1.78 (lower mid). Point 9 Sharpe: 2.27 (lower mid). Sharpe: 2.51 (upper mid). Sharpe: 1.21 (bottom quartile). Point 10 Information ratio: -0.15 (lower mid). Information ratio: -0.09 (upper mid). Information ratio: -1.13 (bottom quartile). HDFC Long Term Advantage Fund
Baroda Pioneer ELSS 96
IDBI Equity Advantage Fund
*Above is the list of Top 3 Tax Saving ELSS Mutual Funds sorted on last To generate long term capital appreciation from a portfolio that is predominantly in equity and equity related instruments Below is the key information for HDFC Long Term Advantage Fund Returns up to 1 year are on The main objective of the scheme is to provide the investor long term capital growth as also tax benefit under section 80C of the Income Tax Act, 1961. Research Highlights for Baroda Pioneer ELSS 96 Below is the key information for Baroda Pioneer ELSS 96 Returns up to 1 year are on The Scheme will seek to invest predominantly in a diversified portfolio of equity and equity related instruments with the objective to provide investors with opportunities for capital appreciation and income along with the benefit of income-tax deduction(under section 80C of the Income-tax Act, 1961) on their investments. Investments in this scheme would be subject to a statutory lock-in of 3 years from the date of allotment to be eligible for income-tax benefits under Section 80C. There can be no assurance that the investment objective under the scheme will be realized. Research Highlights for IDBI Equity Advantage Fund Below is the key information for IDBI Equity Advantage Fund Returns up to 1 year are on 1 year performance and have Net Assets between 100 - 5000 Crore.
1. HDFC Long Term Advantage Fund
HDFC Long Term Advantage Fund
Growth Launch Date 2 Jan 01 NAV (14 Jan 22) ₹595.168 ↑ 0.28 (0.05 %) Net Assets (Cr) ₹1,318 on 30 Nov 21 Category Equity - ELSS AMC HDFC Asset Management Company Limited Rating ☆☆☆ Risk Moderately High Expense Ratio 2.25 Sharpe Ratio 2.27 Information Ratio -0.15 Alpha Ratio 1.75 Min Investment 500 Min SIP Investment 500 Exit Load NIL Growth of 10,000 investment over the years.
Date Value 31 Jan 21 ₹10,000
Purchase not allowed Returns for HDFC Long Term Advantage Fund
absolute basis & more than 1 year are on CAGR (Compound Annual Growth Rate) basis. as on 14 Jan 22 Duration Returns 1 Month 4.4% 3 Month 1.2% 6 Month 15.4% 1 Year 35.5% 3 Year 20.6% 5 Year 17.4% 10 Year 15 Year Since launch 21.4% Historical performance (Yearly) on absolute basis
Year Returns 2024 2023 2022 2021 2020 2019 2018 2017 2016 2015 Fund Manager information for HDFC Long Term Advantage Fund
Name Since Tenure Data below for HDFC Long Term Advantage Fund as on 30 Nov 21
Equity Sector Allocation
Sector Value Asset Allocation
Asset Class Value Top Securities Holdings / Portfolio
Name Holding Value Quantity 2. Baroda Pioneer ELSS 96
Baroda Pioneer ELSS 96
Growth Launch Date 2 Mar 15 NAV (11 Mar 22) ₹68.6676 ↑ 0.33 (0.48 %) Net Assets (Cr) ₹210 on 31 Jan 22 Category Equity - ELSS AMC Baroda Pioneer Asset Management Co. Ltd. Rating Risk Moderately High Expense Ratio 2.55 Sharpe Ratio 2.51 Information Ratio -0.09 Alpha Ratio 5.69 Min Investment 500 Min SIP Investment 500 Exit Load NIL Growth of 10,000 investment over the years.
Date Value 31 Jan 21 ₹10,000 31 Jan 22 ₹13,804 Returns for Baroda Pioneer ELSS 96
absolute basis & more than 1 year are on CAGR (Compound Annual Growth Rate) basis. as on 14 Jan 22 Duration Returns 1 Month -3.9% 3 Month -6.1% 6 Month -3.5% 1 Year 17.6% 3 Year 16.7% 5 Year 11.6% 10 Year 15 Year Since launch 8.4% Historical performance (Yearly) on absolute basis
Year Returns 2024 2023 2022 2021 2020 2019 2018 2017 2016 2015 Fund Manager information for Baroda Pioneer ELSS 96
Name Since Tenure Data below for Baroda Pioneer ELSS 96 as on 31 Jan 22
Equity Sector Allocation
Sector Value Asset Allocation
Asset Class Value Top Securities Holdings / Portfolio
Name Holding Value Quantity 3. IDBI Equity Advantage Fund
IDBI Equity Advantage Fund
Growth Launch Date 10 Sep 13 NAV (28 Jul 23) ₹43.39 ↑ 0.04 (0.09 %) Net Assets (Cr) ₹485 on 30 Jun 23 Category Equity - ELSS AMC IDBI Asset Management Limited Rating ☆☆☆ Risk Moderately High Expense Ratio 2.39 Sharpe Ratio 1.21 Information Ratio -1.13 Alpha Ratio 1.78 Min Investment 500 Min SIP Investment 500 Exit Load NIL Growth of 10,000 investment over the years.
Date Value 31 Jan 21 ₹10,000 31 Jan 22 ₹12,897 31 Jan 23 ₹12,807 Returns for IDBI Equity Advantage Fund
absolute basis & more than 1 year are on CAGR (Compound Annual Growth Rate) basis. as on 14 Jan 22 Duration Returns 1 Month 3.1% 3 Month 9.7% 6 Month 15.1% 1 Year 16.9% 3 Year 20.8% 5 Year 10% 10 Year 15 Year Since launch 16% Historical performance (Yearly) on absolute basis
Year Returns 2024 2023 2022 2021 2020 2019 2018 2017 2016 2015 Fund Manager information for IDBI Equity Advantage Fund
Name Since Tenure Data below for IDBI Equity Advantage Fund as on 30 Jun 23
Equity Sector Allocation
Sector Value Asset Allocation
Asset Class Value Top Securities Holdings / Portfolio
Name Holding Value Quantity
Other Popular Tax Saving Schemes in India
PPF Or Public Provident Fund
PPF or Public Provident Fund is a tax-free investment option that is backed by the Central Government of India. PPF came into existence in 1968 by the Ministry of Finance. Public Provident Fund aims to provide financial security to people post-retirement. The government of India launched PPF in order to help people inculcate the habit of saving and also plan their retirement well in advance. PPF is one of the best tax saving investments as the interest earned on deposits are not taxable. Moreover, the investments are liable for tax deductions under section 80C of Income Tax Act.
Tax Saving FD Or Fixed Deposit
tax saving FD or Fixed Deposits are financial instruments that are provided by banks for a fixed period of time. The interest rate of FD varies from 4% to 8% (according to the investment tenure). Usually, it is seen that higher the period of investment higher is the rate of interest on FD and vice versa. Though FD is a tax saving and safe investment, the interest earned on them is fully taxable as per the Income Tax Act. Furthermore, if the rate of interest on FD is above INR 10,000, banks deduct a TDS @ 10% p.a.
Talk to our investment specialist
NPS Or National Pension Scheme
NPS or National Pension Scheme is a tax saving investment option formulated by the Central Government of India to help people save tax while saving for retirement. As per the National Pension Scheme, one can open a personal retirement account where they can save a pension corpus during their working life. Apart from Retirement planning, investments upto 50,000 under NPS are liable for deductions under section 80 CCD (1B). Under section 80C of Income Tax Act, tax deductions upto 1,50,000 are liable on investments in a National Pension Scheme. This makes NPS one of the best tax saving investments in India.
National Saving Certificate (NSC)
National Saving Certificate (NSC) is a good Tax Saving Scheme to invest in. NSC interest rates are set in the month of April every year. The current interest rate of NSC is 7.9% p.a. Investments up to INR 1,00,000 per year are eligible for IT rebate under the Section 80C of the Income Tax Act. You can invest in NSC through your local Post Office as well.
Employee Provident Fund (EPF)
Employee Provident Fund or EPF is typically deducted from the salary of an individual which includes 12% of their basic salary. The employer also contributes the similar percentage of which 3.7% goes to the EPF and the remaining 8.3% goes towards the pension fund. It is a defined benefit scheme with interest rates being set every year. The interest rate was 8.8% p.a. for the year 2015-2016. There is no tax at the time of making the investment in EPF. Also, the interest earned is also tax-free. At the time of retirement, individuals can withdraw the entire amount in the account.
ULIP Or Unit Linked Insurance Policy
Unit-linked insurance Policy is an insurance policy that works an insurance cover along with offering market linked returns. Under a ULIP, some part of your investment is invested in Mutual Funds (Equity, Balanced or Debt Funds) and the remaining is contributed towards your life cover. One can save tax by investing in ULIP under Sections 80C, 80CCC and 80D of the Income Tax Act. Moreover, the interests that are earned on your ULIP investment are tax-free. Also, under section 10 (10D), tax-free maturity benefits are available as well. When choosing an investment, people usually tend to choose it just to avail tax benefits. Ideally, the investors should look for certain factors before investing. Some of those include maximum tax saving, low-cost investment, substantial returns etc. So, understand the tax saving investments well and then invest.
All efforts have been made to ensure the information provided here is accurate. However, no guarantees are made regarding correctness of data. Please verify with scheme information document before making any investment.


Research Highlights for HDFC Long Term Advantage Fund