How to Become a Crorepati?
Are you one of those who dreams to be a crorepati? Well, it’s not easy, but it’s most definitely possible. But how? The answer lies in the Mutual Funds, more specifically in the Systematic Investment plan (SIP). So, let’s understand what exactly is a SIP, and how one can build such a large corpus.
Systematic Investment Plan or SIP
A Systematic Investment Plan or SIP is one of the modes of Investing in the Mutual Funds. SIP starts the process of wealth creation where a small amount of money is invested at regular intervals. When you make an equity investment via a SIP, the money is being invested in the stock market and this generates regular returns over time. It also makes sure that the money grows well over time.
Talk to our investment specialist
Benefits of Investing in SIP
Some of the major benefits of SIPs are:
Rupee cost averaging
The biggest benefit that a SIP offers is rupee cost averaging which helps an individual to average out the cost of an asset purchase. While making a lump sum investment in a Mutual Fund a certain number of units are purchased by the investor all at once, in the case of a SIP the purchase of units is done over a long period and these are spread out equally over monthly intervals (usually). Due to the investment being spread out over time, the investment is made into the stock market at different price points giving the investor the benefit of averaging cost, hence the term rupee cost averaging.
Power of Compounding
It also offers the benefit of the Power of Compounding. Simple interest is when you gain interest on only the principal. In the case of compound interest, the interest amount is added to the principal, and interest is calculated on the new principal (old principal plus gains). This process continues every time. Since the mutual funds in the SIP are in instalments, they are compounded, which adds more to the initially invested sum.
Affordability
SIPs are a very affordable option for the masses to start savings since the minimum amount required for each instalment (that too monthly!) can be as low as INR 500. Some Mutual Fund companies even offer something called a “MicroSIP” where the ticket size is as low as INR 100.
Risk Reduction
Given that a SIP is spread over a long period of time, one catches all periods of the stock market, the ups and more importantly the downturns. In downturns, when fear catches most investors, SIP instalments continue ensuring the investors buy “low”.
In a SIP, one can start investing with an amount as low as ₹ 500. This makes the most affordable means of investment for most people. This way one can start investing small amounts right from a young age in order to build a large corpus in the future. SIP is most famous for goal planning. Some the long-term Financial goals people plan through SIP are:
- Buying a house
- Buying a car
- Marriage
- Retirement planning
- International trip
- Child’s education
- Medical emergencies etc.
SIP plans help you save money and achieve all these major financial goals in a systematic manner. But, how? Let’s check this!
How to become a Crorepati?
Start a SIP
When you SIP, your money grows! The key to reaching your desired long-term financial goals is to start a SIP and stay invested for a longer duration. The early you start the more you benefit. Let’s look at some of the examples:
Case 1- If you are 25 years old and you want to accumulate ₹ 1 crore by the time you reach your 40s. You just have to invest just ₹ 500 per month to become a crorepati. We have assumed 14 percent as the long-term growth rate in the equity market.
| Tenure | Investment amount | Total investment amount | Expected amount after 42 Years of SIP | Net Profit |
|---|---|---|---|---|
| 42 years | ₹ 500 | ₹2,52,000 | ₹1,12,56,052 | ₹1,10,04,052 |
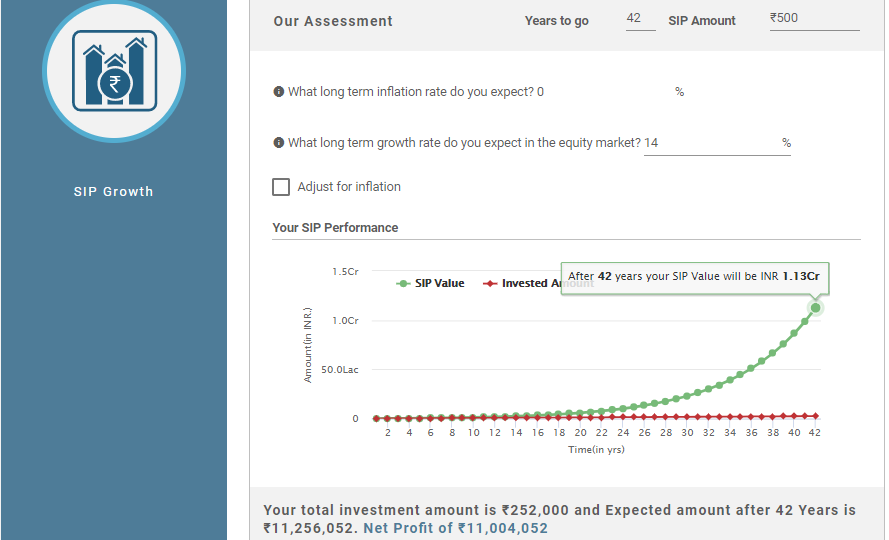
When you invest INR 500 via a SIP for 42 years, you make a net profit of ₹1,10,04,052. The number may look surprising, but this is the magic of the power of compounding. The longer you stay invested, the more returns you earn, which helps you to accumulate the corpus faster.
If you increase your monthly investment amount, you could become a crorepati even before 42 years, given 14 percent rate of interest.
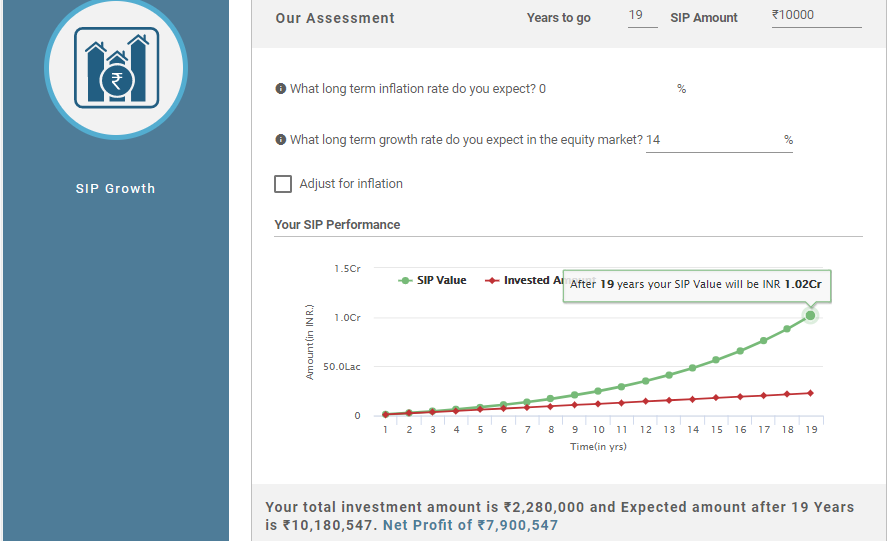
Case 2- For example, if you make an investment of INR 10,000 through a monthly SIP for about 19 years. Your money can grow to over INR 1 crore, if you assume 14 percent as the long-term growth rate in the equity market.
| Tenure | Investment amount | Total investment amount | Expected amount after 19 Years of SIP | Net Profit |
|---|---|---|---|---|
| 19 years | ₹10,000 | ₹22,80,000 | ₹1,01,80,547 | ₹79,00,547 |
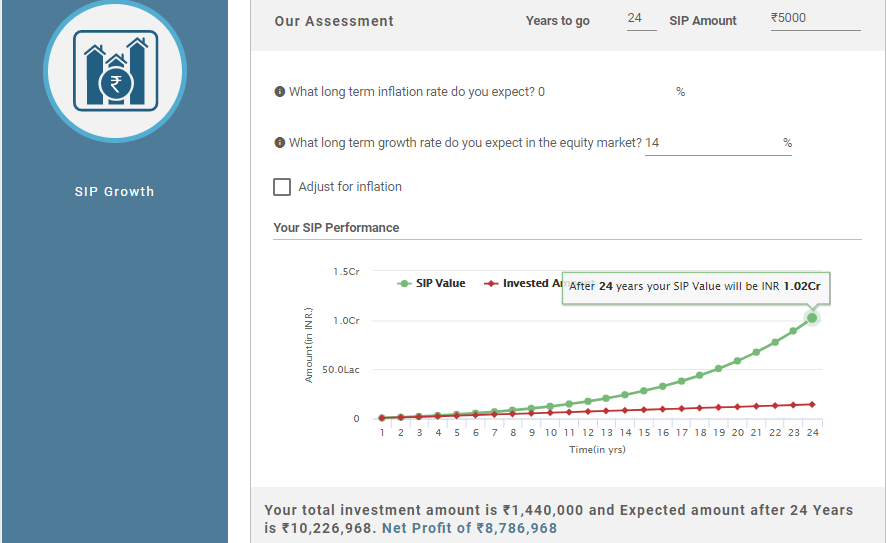
Case 3- If you make an investment of INR 5,000 through a monthly SIP for about 24 years, your corpus could grow to over INR 1 crore, if you assume 14 percent as the long-term growth rate in the equity market.
| Tenure | Investment amount | Total investment amount | Expected amount after 24 Years of SIP | Net Profit |
|---|---|---|---|---|
| 24 years | ₹5,000 | ₹14,40,000 | ₹1,02,26,968 | ₹87,86,968 |
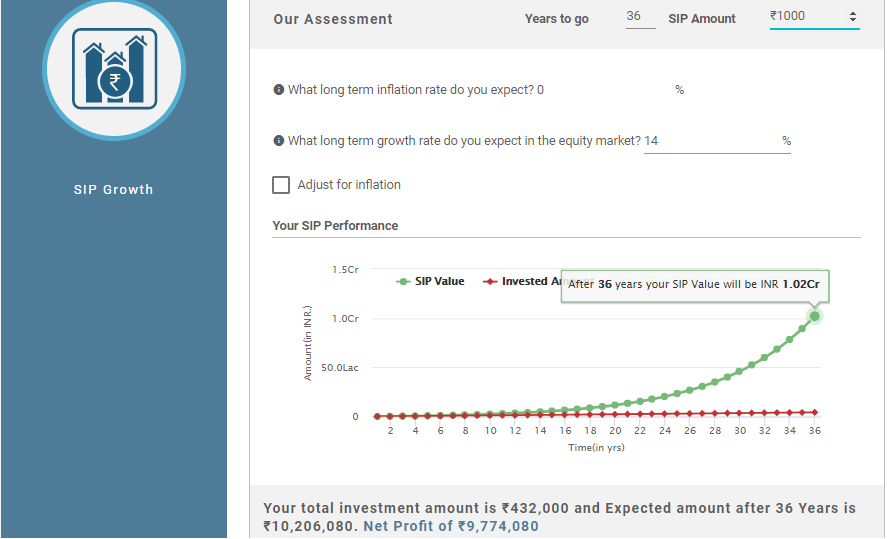
Case 4- If you make an investment of INR 1,000 through a monthly SIP for about 36 years, your wealth can grow to over INR 1 crore, if you assume 14 percent as the long-term growth rate in the equity market.
| Tenure | Investment amount | Total investment amount | Expected amount after 36 Years of SIP | Net Profit |
|---|---|---|---|---|
| 36 years | ₹1,000 | ₹4,32,000 | ₹1,02,06,080 | ₹97,74,080 |
This is how your money grows with a SIP. One of the best thing about a SIP is that you can predetermine the SIP returns of your investments with the help of a sip calculator, like we did above. All you need to do is add certain inputs like--
- For how long are you planning to invest?
- How much do you want to invest monthly on SIP?
- What long-term growth rate do you expect in the equity market?
And this inputs will get your results. It is that simple.
Fund Selection Methodology used to find 10 funds
Best SIP Mutual Funds to Invest 2026
Some of the Best SIP Equity Funds that could help you to achieve your long-term goals are as follows-
Fund NAV Net Assets (Cr) Min SIP Investment 3 MO (%) 6 MO (%) 1 YR (%) 3 YR (%) 5 YR (%) 2024 (%) DSP US Flexible Equity Fund Growth ₹95.752
↑ 0.41 ₹1,226 500 22.8 28.2 64.1 29.9 19.6 33.8 Franklin Asian Equity Fund Growth ₹45.1739
↑ 0.59 ₹521 500 12.6 30.4 54.6 21.7 7.4 23.7 DSP Natural Resources and New Energy Fund Growth ₹112.557
↑ 0.15 ₹2,343 500 2.2 17.7 27.2 24.8 17.9 17.5 Aditya Birla Sun Life Small Cap Fund Growth ₹91.2669
↓ -0.48 ₹5,253 1,000 8.6 5.6 8.8 17.7 13.9 -3.7 Invesco India Growth Opportunities Fund Growth ₹100.38
↓ -1.08 ₹9,761 100 2.2 -3.3 5.5 22.4 17.1 4.7 Franklin Build India Fund Growth ₹144.114
↓ -2.15 ₹3,214 500 -3.1 -0.5 3.9 24.1 21.3 3.7 Tata India Tax Savings Fund Growth ₹45.0308
↓ -0.54 ₹4,519 500 -1.7 -3 3.1 14.7 13.2 4.9 Kotak Equity Opportunities Fund Growth ₹337.59
↓ -5.45 ₹30,251 1,000 -5.1 -4.7 1.5 15.6 14.5 5.6 Aditya Birla Sun Life Banking And Financial Services Fund Growth ₹59.99
↓ -0.86 ₹3,541 1,000 -6.1 -7.1 0 11.8 11.1 17.5 Tata Equity PE Fund Growth ₹339.76
↓ -4.97 ₹8,592 150 -3.6 -6.1 -0.1 15.2 14.6 3.7 Note: Returns up to 1 year are on absolute basis & more than 1 year are on CAGR basis. as on 27 May 26 Research Highlights & Commentary of 10 Funds showcased
Commentary DSP US Flexible Equity Fund Franklin Asian Equity Fund DSP Natural Resources and New Energy Fund Aditya Birla Sun Life Small Cap Fund Invesco India Growth Opportunities Fund Franklin Build India Fund Tata India Tax Savings Fund Kotak Equity Opportunities Fund Aditya Birla Sun Life Banking And Financial Services Fund Tata Equity PE Fund Point 1 Bottom quartile AUM (₹1,226 Cr). Bottom quartile AUM (₹521 Cr). Bottom quartile AUM (₹2,343 Cr). Upper mid AUM (₹5,253 Cr). Top quartile AUM (₹9,761 Cr). Lower mid AUM (₹3,214 Cr). Upper mid AUM (₹4,519 Cr). Highest AUM (₹30,251 Cr). Lower mid AUM (₹3,541 Cr). Upper mid AUM (₹8,592 Cr). Point 2 Established history (13+ yrs). Established history (18+ yrs). Established history (18+ yrs). Established history (19+ yrs). Established history (18+ yrs). Established history (16+ yrs). Established history (11+ yrs). Oldest track record among peers (21 yrs). Established history (12+ yrs). Established history (21+ yrs). Point 3 Top rated. Rating: 5★ (top quartile). Rating: 5★ (upper mid). Rating: 5★ (upper mid). Rating: 5★ (upper mid). Rating: 5★ (lower mid). Rating: 5★ (lower mid). Rating: 5★ (bottom quartile). Rating: 5★ (bottom quartile). Rating: 5★ (bottom quartile). Point 4 Risk profile: High. Risk profile: High. Risk profile: High. Risk profile: Moderately High. Risk profile: Moderately High. Risk profile: High. Risk profile: Moderately High. Risk profile: Moderately High. Risk profile: High. Risk profile: Moderately High. Point 5 5Y return: 19.57% (top quartile). 5Y return: 7.43% (bottom quartile). 5Y return: 17.91% (upper mid). 5Y return: 13.92% (lower mid). 5Y return: 17.07% (upper mid). 5Y return: 21.29% (top quartile). 5Y return: 13.16% (bottom quartile). 5Y return: 14.54% (lower mid). 5Y return: 11.05% (bottom quartile). 5Y return: 14.64% (upper mid). Point 6 3Y return: 29.87% (top quartile). 3Y return: 21.69% (upper mid). 3Y return: 24.83% (top quartile). 3Y return: 17.73% (lower mid). 3Y return: 22.36% (upper mid). 3Y return: 24.07% (upper mid). 3Y return: 14.69% (bottom quartile). 3Y return: 15.59% (lower mid). 3Y return: 11.84% (bottom quartile). 3Y return: 15.24% (bottom quartile). Point 7 1Y return: 64.07% (top quartile). 1Y return: 54.63% (top quartile). 1Y return: 27.21% (upper mid). 1Y return: 8.84% (upper mid). 1Y return: 5.51% (upper mid). 1Y return: 3.90% (lower mid). 1Y return: 3.12% (lower mid). 1Y return: 1.46% (bottom quartile). 1Y return: 0.02% (bottom quartile). 1Y return: -0.14% (bottom quartile). Point 8 Alpha: -3.89 (bottom quartile). Alpha: 0.00 (lower mid). Alpha: 0.00 (lower mid). Alpha: 0.00 (bottom quartile). Alpha: 2.57 (upper mid). Alpha: 0.00 (bottom quartile). Alpha: 3.49 (top quartile). Alpha: 1.08 (upper mid). Alpha: 4.98 (top quartile). Alpha: 0.14 (upper mid). Point 9 Sharpe: 2.58 (top quartile). Sharpe: 1.56 (upper mid). Sharpe: 1.74 (top quartile). Sharpe: 0.46 (upper mid). Sharpe: 0.23 (lower mid). Sharpe: 0.37 (upper mid). Sharpe: 0.18 (lower mid). Sharpe: 0.18 (bottom quartile). Sharpe: 0.03 (bottom quartile). Sharpe: 0.00 (bottom quartile). Point 10 Information ratio: -0.04 (bottom quartile). Information ratio: 0.00 (upper mid). Information ratio: 0.00 (lower mid). Information ratio: 0.00 (lower mid). Information ratio: 0.83 (top quartile). Information ratio: 0.00 (bottom quartile). Information ratio: 0.09 (upper mid). Information ratio: -0.17 (bottom quartile). Information ratio: 0.50 (top quartile). Information ratio: 0.49 (upper mid). DSP US Flexible Equity Fund
Franklin Asian Equity Fund
DSP Natural Resources and New Energy Fund
Aditya Birla Sun Life Small Cap Fund
Invesco India Growth Opportunities Fund
Franklin Build India Fund
Tata India Tax Savings Fund
Kotak Equity Opportunities Fund
Aditya Birla Sun Life Banking And Financial Services Fund
Tata Equity PE Fund
The Mutual Fund returns vary scheme to scheme and so are the long-term returns.
All efforts have been made to ensure the information provided here is accurate. However, no guarantees are made regarding correctness of data. Please verify with scheme information document before making any investment.


AMFI Registration No. 112358 | CIN: U74999MH2016PTC282153
Shepard Technologies Pvt. Ltd. (with ARN code 112358) makes no warranties or representations, express or implied, on products offered through the platform. It accepts no liability for any damages or losses, however caused, in connection with the use of, or on the reliance of its product or related services. Terms and conditions of the website are applicable.
©2026 Shepard Technologies Private Limited. All Rights Reserved