റിട്ടയർമെന്റ് കാൽക്കുലേറ്റർ: വിലയിരുത്തുകയും നിക്ഷേപിക്കുകയും ചെയ്യുക
വിരമിക്കൽ ഒരു നിശ്ചിത ജീവിത നിലവാരം നിലനിർത്തുന്നതിന് വിരമിക്കലിന് ശേഷം ആവശ്യമായ കോർപ്പസിനെ കുറിച്ച് അറിയാൻ ഉത്സുകരായവർക്കുള്ള ഒരു ഉപകരണമാണ് കാൽക്കുലേറ്റർ. റിട്ടയർമെന്റ് കാൽക്കുലേറ്റർ ഒരു അത്യാവശ്യ ഘടകമായി കണക്കാക്കുമ്പോൾവിരമിക്കുന്നതിനുള്ള ആസൂത്രണം. നിങ്ങളുടെ നിലവിലെ സാമ്പത്തിക സാഹചര്യങ്ങളെ അടിസ്ഥാനമാക്കി നിങ്ങളുടെ റിട്ടയർമെന്റിനായി നിങ്ങൾ സംരക്ഷിക്കേണ്ട കണക്കാക്കിയ തുക തിരിച്ചറിയാൻ ഇത് നിങ്ങളെ സഹായിക്കുന്നു. അതിനാൽ, നിങ്ങൾ വിരമിക്കുമ്പോൾ ആവശ്യമായ കോർപ്പസ് വിലയിരുത്താൻ സഹായിക്കുന്ന വളരെ ലളിതമായ ഒരു റിട്ടയർമെന്റ് കാൽക്കുലേറ്ററിലൂടെ ഞങ്ങൾ നിങ്ങളെ കൊണ്ടുപോകുന്നു.
റിട്ടയർമെന്റ് കാൽക്കുലേറ്റർ മനസ്സിലാക്കുന്നു
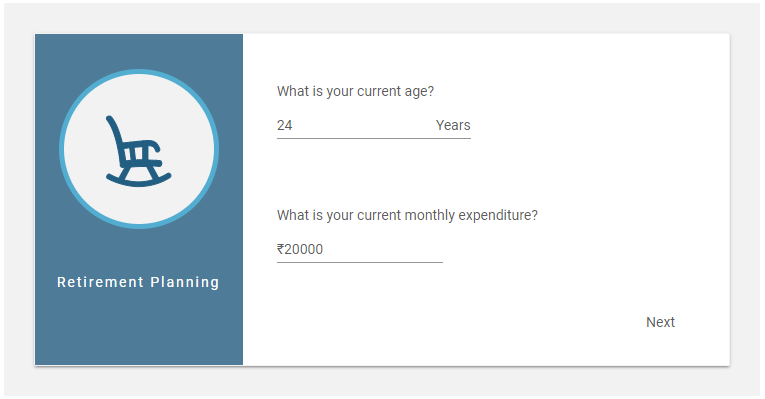
ഒരു റിട്ടയർമെന്റ് കാൽക്കുലേറ്റർ ഉപയോഗിക്കുമ്പോൾ, നിങ്ങൾ ചില വേരിയബിളുകൾ നൽകേണ്ടതുണ്ട്,
- നിങ്ങളുടെ ഇപ്പോഴത്തെ പ്രായം
- നിങ്ങളുടെ നിലവിലെ പ്രതിമാസ ചെലവുകൾ
- പ്രതീക്ഷിച്ചത്പണപ്പെരുപ്പം വരും വർഷങ്ങളിലെ നിരക്ക് (വാർഷികം).
- നിക്ഷേപങ്ങളുടെ ദീർഘകാല വളർച്ചാ നിരക്ക്
ഈ വേരിയബിളുകളെല്ലാം കാൽക്കുലേറ്ററിലേക്ക് നൽകുമ്പോൾ, ജീവിതനിലവാരം നിലനിർത്താൻ നിങ്ങളുടെ വിരമിക്കലിന് പ്രതിമാസം നിക്ഷേപിക്കേണ്ട തുക നൽകും. (അതായത് നിങ്ങളുടെ നിലവിലെ പ്രതിമാസ ജീവിതച്ചെലവുകൾ പണപ്പെരുപ്പത്തിനനുസരിച്ച് ക്രമീകരിച്ചിരിക്കുന്നു).
റിട്ടയർമെന്റ് കാൽക്കുലേറ്റർ: മൂല്യനിർണ്ണയ പ്രക്രിയ
1. നിങ്ങളുടെ നിലവിലെ പ്രതിമാസ ചെലവുകൾ കണക്കാക്കുന്നു
നിങ്ങൾ ഇവിടെ ആദ്യം ചെയ്യേണ്ടത്, വീട്ടുചെലവുകൾ, യൂട്ടിലിറ്റി ചെലവുകൾ, ഗതാഗത ചെലവ്, മറ്റ് ജീവിതശൈലി ചെലവുകൾ എന്നിങ്ങനെയുള്ള നിങ്ങളുടെ പ്രതിമാസ ചെലവുകൾ കണക്കാക്കുക എന്നതാണ്. ഇതുകൂടാതെ, വിവിധ ചെലവുകൾക്കായി നിങ്ങൾക്ക് പ്രതിമാസം ആവശ്യമായ ഏറ്റവും കുറഞ്ഞ തുകയെക്കുറിച്ച് നിങ്ങൾക്ക് ഏകദേശ ധാരണ ഉണ്ടായിരിക്കണം. വിരമിച്ച ശേഷം സുഖപ്രദമായ ജീവിതം നയിക്കാൻ ഭാവിയിൽ പണപ്പെരുപ്പത്തിനായി ക്രമീകരിച്ച ഈ ചെലവുകൾ മതിയാകും എന്നതാണ് ഇവിടെ അടിസ്ഥാന അനുമാനം.
*ഉദാഹരണത്തിന്-*
- വീട്ടുചെലവുകൾ -10 രൂപ,000
- ഗതാഗത ചെലവുകൾ -2,000 രൂപ
- യൂട്ടിലിറ്റി ചെലവുകൾ-** INR 3,000**
- മറ്റ് ജീവിതശൈലി ചെലവുകൾ (സിനിമകൾ, ഡൈനിംഗ് മുതലായവ) -3,000 രൂപ
- വിവിധ ചെലവുകൾ -2000 രൂപ
മൊത്തം പ്രതിമാസ ചെലവുകൾ-20,000 രൂപ
Know Your Monthly SIP Amount
2. വരും വർഷങ്ങളിലെ പണപ്പെരുപ്പ നിരക്ക് മനസ്സിലാക്കുക
നിങ്ങൾ വിരമിക്കുന്നതുവരെ വരും വർഷങ്ങളിൽ നിങ്ങൾ പ്രതീക്ഷിക്കുന്ന ശരാശരി വാർഷിക പണപ്പെരുപ്പ നിരക്കാണിത്. വിവിധ പ്രകാരംവിപണി സ്രോതസ്സുകൾ, ശരാശരി പണപ്പെരുപ്പം ഏകദേശം 4-5% p.a ആയി കണക്കാക്കാം. വരും വർഷങ്ങളിൽ. എന്നിരുന്നാലും, ഒരാൾക്ക് അവരുടെ സ്വന്തം അനുമാനവും നൽകാം.
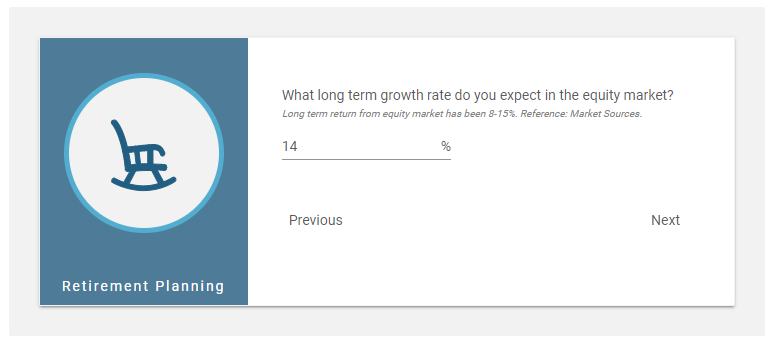
3. നിക്ഷേപങ്ങളുടെ ദീർഘകാല വളർച്ചാ നിരക്ക്
നിങ്ങളുടെ നിക്ഷേപങ്ങളിൽ നിങ്ങൾ പ്രതീക്ഷിക്കുന്ന ദീർഘകാല വളർച്ചാ നിരക്കാണിത്. ഇക്വിറ്റി മാർക്കറ്റിൽ നിന്നുള്ള ദീർഘകാല റിട്ടേൺ ചരിത്രപരമായി 8-15% ആണെങ്കിലും, വിപണി സ്രോതസ്സുകൾ പ്രകാരം, മുന്നോട്ട് പോകുമ്പോൾ ഏകദേശം 8-15% p.a. ദീർഘകാലാടിസ്ഥാനത്തിൽ. നിങ്ങൾക്ക് വിപണിയെക്കുറിച്ച് നല്ല അറിവുണ്ടെങ്കിൽ, വളർച്ചാ നിരക്കിൽ നിങ്ങളുടെ സ്വന്തം അനുമാനങ്ങൾ നൽകാം.
Talk to our investment specialist
4. നിക്ഷേപ മൂല്യനിർണ്ണയം
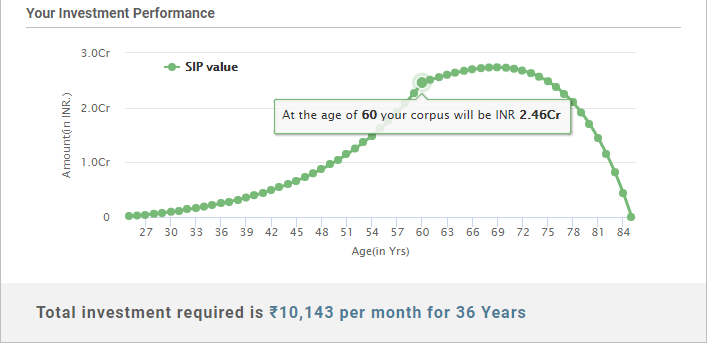
നിങ്ങൾക്ക് പ്രതിമാസം നിക്ഷേപിക്കേണ്ട ആവശ്യമുള്ള തുക ലഭിക്കുന്ന രസകരമായ ഭാഗം ഇപ്പോൾ വരുന്നു. മേൽപ്പറഞ്ഞ വേരിയബിളുകൾ കണക്കിലെടുക്കുമ്പോൾ, നിങ്ങൾ വിരമിക്കുന്നതുവരെ പ്രതിമാസം ലാഭിക്കേണ്ട ആവശ്യമുള്ള കോർപ്പസ് നിങ്ങൾക്ക് ലഭിക്കും. ഇവിടെ റിട്ടയർമെന്റിനുള്ള കണക്കാക്കിയ പ്രായം 60 വയസ്സായി കണക്കാക്കുന്നു (ചുവടെയുള്ള ചിത്രം കാണുക).
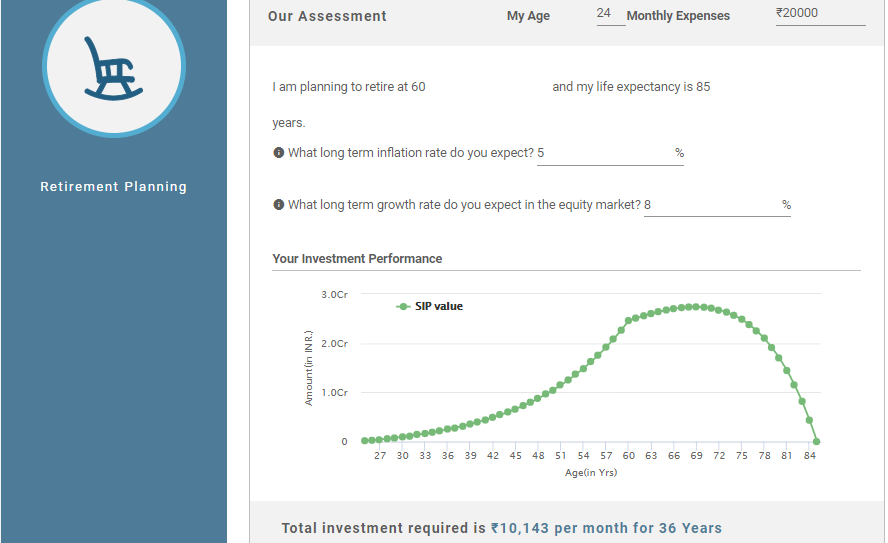
5. മൊത്തം കോർപ്പസ്
നിങ്ങൾ 36 വർഷത്തേക്ക് നിക്ഷേപിക്കുമ്പോൾ എത്ര കോർപ്പസ് സമാഹരിക്കപ്പെടും എന്നർത്ഥം, നിങ്ങൾ ആരംഭിച്ചാൽനിക്ഷേപിക്കുന്നു 24 വയസ്സ് മുതൽ 60 വയസ്സ് വരെ. ആവശ്യമുള്ള കോർപ്പസിൽ എത്താൻ, നിങ്ങൾ പ്രതിമാസ നിക്ഷേപം നടത്തേണ്ടതുണ്ട്. മേൽപ്പറഞ്ഞ കണക്കുകൾ പ്രകാരം, 36 വർഷത്തേക്ക് എല്ലാ മാസവും ആവശ്യമായ മൊത്തം നിക്ഷേപം 10,143 രൂപയാണ്. സൂചിപ്പിച്ചതുപോലെ, കണക്കാക്കിയ മൊത്തം കോർപ്പസ് നിങ്ങളുടെ നിലവിലെ പ്രായം, നിലവിലെ പ്രതിമാസ ചെലവുകൾ, പണപ്പെരുപ്പം, വർഷങ്ങളിൽ പ്രതീക്ഷിക്കുന്ന നിക്ഷേപത്തിന്റെ വളർച്ചാ നിരക്ക് എന്നിവയെ ആശ്രയിച്ചിരിക്കും.
ഉപസംഹാരം- റിട്ടയർമെന്റിനായി ആസൂത്രണം ചെയ്യുന്ന ആളുകൾക്ക് ഈ കാൽക്കുലേറ്റർ ഉപയോഗിക്കാം, അതിലൂടെ നിങ്ങളുടെ റിട്ടയർമെന്റ് കോർപ്പസ് എളുപ്പത്തിൽ കണക്കാക്കാം. വിരമിക്കലിന് ആവശ്യമായ തുക ഏകദേശം കണക്കാക്കാൻ ഇത് നിങ്ങളെ സഹായിക്കും, അതിനാൽ, അതിനനുസരിച്ച് നിങ്ങളുടെ നിക്ഷേപം ആസൂത്രണം ചെയ്യാൻ കഴിയും!
2022-ലെ മികച്ച ഫണ്ടുകൾ
*5 വർഷത്തെ പ്രകടനത്തെ അടിസ്ഥാനമാക്കിയുള്ള മികച്ച ഫണ്ടുകൾ.
The investment objective of the scheme is to provide long term growth from a portfolio of equity / equity related instruments of companies engaged either directly or indirectly in the infrastructure sector. Below is the key information for LIC MF Infrastructure Fund Returns up to 1 year are on "The primary investment objective of the Scheme is to seek capital appreciation by investing predominantly in units of MLIIF - WGF. The Scheme may, at the discretion of the Investment Manager, also invest in the units of other similar overseas mutual fund schemes, which may constitute a significant part of its corpus. The Scheme may also invest a certain portion of its corpus in money market securities and/or units of money market/liquid schemes of DSP Merrill Lynch Mutual Fund, in order to meet liquidity requirements from time to time. However, there is no assurance that the investment objective of the Scheme will be realized." Research Highlights for DSP World Gold Fund Below is the key information for DSP World Gold Fund Returns up to 1 year are on 1. LIC MF Infrastructure Fund
LIC MF Infrastructure Fund
Growth Launch Date 29 Feb 08 NAV (16 Jul 26) ₹54.3117 ↓ -0.12 (-0.22 %) Net Assets (Cr) ₹1,099 on 31 May 26 Category Equity - Sectoral AMC LIC Mutual Fund Asset Mgmt Co Ltd Rating Risk High Expense Ratio 2.21 Sharpe Ratio 0.26 Information Ratio 0.55 Alpha Ratio 4.51 Min Investment 5,000 Min SIP Investment 1,000 Exit Load 0-1 Years (1%),1 Years and above(NIL) Growth of 10,000 investment over the years.
Date Value 30 Jun 21 ₹10,000 30 Jun 22 ₹11,137 30 Jun 23 ₹14,179 30 Jun 24 ₹26,268 30 Jun 25 ₹26,896 30 Jun 26 ₹29,151 Returns for LIC MF Infrastructure Fund
absolute basis & more than 1 year are on CAGR (Compound Annual Growth Rate) basis. as on 16 Jul 26 Duration Returns 1 Month 0.6% 3 Month 6.6% 6 Month 13.4% 1 Year 6.9% 3 Year 25.4% 5 Year 22.7% 10 Year 15 Year Since launch 9.6% Historical performance (Yearly) on absolute basis
Year Returns 2025 -3.7% 2024 47.8% 2023 44.4% 2022 7.9% 2021 46.6% 2020 -0.1% 2019 13.3% 2018 -14.6% 2017 42.2% 2016 -2.2% Fund Manager information for LIC MF Infrastructure Fund
Name Since Tenure Sumit Bhatnagar 7 Apr 26 0.23 Yr. Mahesh Bendre 1 Jul 24 2 Yr. Data below for LIC MF Infrastructure Fund as on 31 May 26
Equity Sector Allocation
Sector Value Industrials 37.05% Consumer Cyclical 20.88% Basic Materials 12.42% Utility 11.88% Communication Services 5.02% Financial Services 3.98% Real Estate 1.97% Health Care 1.89% Technology 1.08% Asset Allocation
Asset Class Value Cash 3.82% Equity 96.18% Top Securities Holdings / Portfolio
Name Holding Value Quantity Larsen & Toubro Ltd (Industrials)
Equity, Since 30 Apr 09 | LT4% ₹44 Cr 106,968
↓ -10,884 Garware Hi-Tech Films Ltd (Basic Materials)
Equity, Since 31 Aug 23 | 5006554% ₹40 Cr 65,325
↓ -7,684 Tata Motors Passenger Vehicles Ltd (Consumer Cyclical)
Equity, Since 28 Feb 26 | TMPV4% ₹39 Cr 982,891
↓ -332,760 Tata Motors Ltd (Consumer Cyclical)
Equity, Since 31 Oct 25 | TMCV4% ₹39 Cr 1,015,933
↑ 26,983 Tata Power Co Ltd (Utilities)
Equity, Since 29 Feb 24 | TATAPOWER3% ₹36 Cr 861,040
↑ 524,312 KSH International Ltd (Industrials)
Equity, Since 31 Dec 25 | KSHINTL3% ₹34 Cr 432,816
↑ 6,280 Siemens Energy India Ltd (Utilities)
Equity, Since 31 Aug 25 | ENRIN3% ₹34 Cr 87,106
↑ 24,800 JSW Infrastructure Ltd (Industrials)
Equity, Since 30 Apr 26 | JSWINFRA3% ₹31 Cr 1,133,858
↑ 745,681 Carraro India Ltd (Consumer Cyclical)
Equity, Since 31 Dec 24 | CARRARO3% ₹31 Cr 572,991 Bharat Dynamics Ltd Ordinary Shares (Industrials)
Equity, Since 31 Jan 26 | BDL3% ₹29 Cr 242,954
↑ 157,744 2. DSP World Gold Fund
DSP World Gold Fund
Growth Launch Date 14 Sep 07 NAV (15 Jul 26) ₹49.6706 ↓ -0.65 (-1.29 %) Net Assets (Cr) ₹1,679 on 31 May 26 Category Equity - Global AMC DSP BlackRock Invmt Managers Pvt. Ltd. Rating ☆☆☆ Risk High Expense Ratio 1.41 Sharpe Ratio 1.77 Information Ratio -0.78 Alpha Ratio -0.46 Min Investment 1,000 Min SIP Investment 500 Exit Load 0-12 Months (1%),12 Months and above(NIL) Growth of 10,000 investment over the years.
Date Value 30 Jun 21 ₹10,000 30 Jun 22 ₹8,181 30 Jun 23 ₹9,294 30 Jun 24 ₹10,640 30 Jun 25 ₹16,808 30 Jun 26 ₹27,693 Returns for DSP World Gold Fund
absolute basis & more than 1 year are on CAGR (Compound Annual Growth Rate) basis. as on 16 Jul 26 Duration Returns 1 Month -11.6% 3 Month -21.9% 6 Month -16.1% 1 Year 63.3% 3 Year 40.7% 5 Year 21.9% 10 Year 15 Year Since launch 8.9% Historical performance (Yearly) on absolute basis
Year Returns 2025 167.1% 2024 15.9% 2023 7% 2022 -7.7% 2021 -9% 2020 31.4% 2019 35.1% 2018 -10.7% 2017 -4% 2016 52.7% Fund Manager information for DSP World Gold Fund
Name Since Tenure Kaivalya Nadkarni 1 May 25 1.17 Yr. Data below for DSP World Gold Fund as on 31 May 26
Equity Sector Allocation
Sector Value Basic Materials 94.47% Asset Allocation
Asset Class Value Cash 3.62% Equity 94.47% Debt 0% Other 1.91% Top Securities Holdings / Portfolio
Name Holding Value Quantity BGF World Gold I2
Investment Fund | -68% ₹1,141 Cr 1,005,044 VanEck Gold Miners ETF
- | GDX29% ₹490 Cr 573,719 Treps / Reverse Repo Investments
CBLO/Reverse Repo | -3% ₹54 Cr Net Receivables/Payables
Net Current Assets | -0% -₹6 Cr
ഇവിടെ നൽകിയിരിക്കുന്ന വിവരങ്ങൾ കൃത്യമാണെന്ന് ഉറപ്പാക്കാൻ എല്ലാ ശ്രമങ്ങളും നടത്തിയിട്ടുണ്ട്. എന്നിരുന്നാലും, ഡാറ്റയുടെ കൃത്യത സംബന്ധിച്ച് യാതൊരു ഉറപ്പും നൽകുന്നില്ല. എന്തെങ്കിലും നിക്ഷേപം നടത്തുന്നതിന് മുമ്പ് സ്കീം വിവര രേഖ ഉപയോഗിച്ച് പരിശോധിക്കുക.


AMFI Registration No. 112358 | CIN: U74999MH2016PTC282153
Shepard Technologies Pvt. Ltd. (with ARN code 112358) makes no warranties or representations, express or implied, on products offered through the platform. It accepts no liability for any damages or losses, however caused, in connection with the use of, or on the reliance of its product or related services. Terms and conditions of the website are applicable.
©2026 Shepard Technologies Private Limited. All Rights Reserved
Research Highlights for LIC MF Infrastructure Fund