
 +91-22-48913909
6 ਸਭ ਤੋਂ ਵਧੀਆ ਮਾਸਿਕ ਆਮਦਨ ਯੋਜਨਾ (MIP) 2022
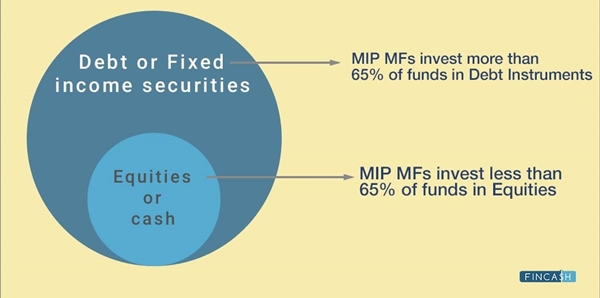
ਦਮਹੀਨਾਵਾਰ ਆਮਦਨ ਯੋਜਨਾ ਇੱਕ ਓਪਨ-ਐਂਡ ਮਿਉਚੁਅਲ ਫੰਡ ਹੈ ਜੋ ਮੁੱਖ ਤੌਰ 'ਤੇ ਆਪਣੀ ਜਾਇਦਾਦ ਨੂੰ ਸਥਿਰ ਵਿੱਚ ਨਿਵੇਸ਼ ਕਰਦਾ ਹੈਆਮਦਨ ਯੰਤਰ ਆਮ ਤੌਰ 'ਤੇ, ਮਹੀਨਾਵਾਰ ਆਮਦਨ ਯੋਜਨਾ ਕਰਜ਼ੇ ਅਤੇ ਇਕੁਇਟੀ ਸੰਪਤੀਆਂ ਦਾ ਸੁਮੇਲ ਹੈ, ਜਿਸ ਵਿੱਚ 65% ਤੋਂ ਵੱਧ ਸੰਪਤੀਆਂ ਦਾ ਨਿਵੇਸ਼ ਕੀਤਾ ਜਾਂਦਾ ਹੈ।ਪੱਕੀ ਤਨਖਾਹ ਉਪਜ ਯੰਤਰ. ਹਾਲਾਂਕਿ, ਮਹੀਨਾਵਾਰ ਆਮਦਨ ਸਕੀਮ ਦੀਆਂ ਬਾਕੀ ਸੰਪਤੀਆਂ ਨੂੰ ਸ਼ੇਅਰਾਂ ਅਤੇ ਸਟਾਕਾਂ ਵਰਗੇ ਇਕੁਇਟੀ-ਲਿੰਕਡ ਯੰਤਰਾਂ ਵਿੱਚ ਨਿਵੇਸ਼ ਕੀਤਾ ਜਾਂਦਾ ਹੈ, ਜੋ ਪ੍ਰਦਾਨ ਕਰਦਾ ਹੈਬਜ਼ਾਰ- ਲਿੰਕਡ ਰਿਟਰਨ।
ਮਾਸਿਕ ਆਮਦਨ ਯੋਜਨਾ ਦਾ ਮੂਲ ਉਦੇਸ਼ ਲੋਕਾਂ ਨੂੰ ਨਿਯਮਤ ਆਮਦਨ ਪ੍ਰਦਾਨ ਕਰਨਾ ਹੈ। ਨਾਲ ਹੀ, ਇੱਕ MIP ਮਿਉਚੁਅਲ ਫੰਡ ਮਹੀਨਾਵਾਰ ਅਤੇ ਤਿਮਾਹੀ ਆਮਦਨ ਦਾ ਵਿਕਲਪ ਪੇਸ਼ ਕਰਦਾ ਹੈ, ਜਿਸਨੂੰ ਲੋਕ ਆਪਣੀ ਸਹੂਲਤ ਅਨੁਸਾਰ ਚੁਣ ਸਕਦੇ ਹਨ।
ਜੇਕਰ ਤੁਸੀਂ ਮਾਸਿਕ ਆਮਦਨ ਯੋਜਨਾ ਵਿੱਚ ਨਿਵੇਸ਼ ਕਰਨਾ ਚਾਹੁੰਦੇ ਹੋ, ਤਾਂ ਵੱਖ-ਵੱਖ ਮਿਉਚੁਅਲ ਫੰਡ ਕੰਪਨੀਆਂ ਦੁਆਰਾ ਪੇਸ਼ ਕੀਤੀ ਗਈ ਸਭ ਤੋਂ ਵਧੀਆ ਮਾਸਿਕ ਆਮਦਨ ਯੋਜਨਾ ਦੀ ਸੂਚੀ 'ਤੇ ਵਿਚਾਰ ਕਰਨ ਦੀ ਸਲਾਹ ਦਿੱਤੀ ਜਾਂਦੀ ਹੈ।
ਮਾਸਿਕ ਆਮਦਨ ਯੋਜਨਾ (MIP) ਵਿੱਚ ਕਿਸਨੂੰ ਨਿਵੇਸ਼ ਕਰਨਾ ਚਾਹੀਦਾ ਹੈ?
ਕੋਈ ਵੀ ਮੱਧਮ ਖਤਰੇ ਤੋਂ ਬਚਣ ਲਈਨਿਵੇਸ਼ਕ ਜੋ ਇੱਕ ਨਿਸ਼ਚਿਤ ਆਮਦਨ ਦੇ ਨਾਲ ਇਕੁਇਟੀ ਬਜ਼ਾਰਾਂ ਵਿੱਚ ਕੁਝ ਐਕਸਪੋਜਰ ਦੀ ਤਲਾਸ਼ ਕਰ ਰਿਹਾ ਹੈ, ਇੱਕ ਮਹੀਨਾਵਾਰ ਆਮਦਨ ਯੋਜਨਾ ਵਿੱਚ ਨਿਵੇਸ਼ ਕਰ ਸਕਦਾ ਹੈ। ਨਿਸ਼ਚਤ ਆਮਦਨੀ ਪ੍ਰਦਾਨ ਕਰਨ ਤੋਂ ਇਲਾਵਾ, ਮਹੀਨਾਵਾਰ ਆਮਦਨ ਸਕੀਮ ਮਾਰਕੀਟ ਲਿੰਕਡ ਰਿਟਰਨ ਦੀ ਪੇਸ਼ਕਸ਼ ਕਰਦੀ ਹੈ। ਇਸ ਤੋਂ ਇਲਾਵਾ, ਇੱਕ ਮਹੀਨਾਵਾਰ ਆਮਦਨ ਯੋਜਨਾ ਬਜ਼ੁਰਗ ਨਾਗਰਿਕਾਂ ਲਈ ਵੀ ਢੁਕਵੀਂ ਹੈ, ਜਿਹੜੇ ਨੇੜੇ ਹਨਸੇਵਾਮੁਕਤੀ.
ਇਸ ਲਈ, ਜੇਕਰ ਤੁਸੀਂ ਮਾਸਿਕ ਆਮਦਨ ਦੀ ਤਲਾਸ਼ ਕਰ ਰਹੇ ਹੋ, ਤਾਂ ਹੁਣੇ ਇੱਕ ਵਧੀਆ ਮਾਸਿਕ ਆਮਦਨ ਯੋਜਨਾ ਵਿੱਚ ਨਿਵੇਸ਼ ਕਰੋ!
ਭਾਰਤ ਵਿੱਚ ਵਿੱਤੀ ਸਾਲ 22 - 23 ਵਿੱਚ 6 ਸਭ ਤੋਂ ਵਧੀਆ ਪ੍ਰਦਰਸ਼ਨ ਕਰਨ ਵਾਲੇ ਮਹੀਨਾਵਾਰ ਆਮਦਨੀ ਮਿਉਚੁਅਲ ਫੰਡ
Fund NAV Net Assets (Cr) 3 MO (%) 6 MO (%) 1 YR (%) 3 YR (%) 5 YR (%) 2025 (%) Since launch (%) Baroda Pioneer Conservative Hybrid Fund Growth ₹30.2092
↑ 0.02 ₹33 -1.7 -1.2 3.3 9.1 7.8 6.5 ICICI Prudential MIP 25 Growth ₹77.7812
↓ -0.25 ₹3,270 -1.8 -0.3 0.5 7.5 7.1 7.9 9.5 DSP Regular Savings Fund Growth ₹60.1147
↓ -0.13 ₹175 -1.4 -0.1 1.1 7.4 6.5 7.2 8.4 Aditya Birla Sun Life Regular Savings Fund Growth ₹68.9741
↓ -0.20 ₹1,467 -1.8 0.8 7.2 6.6 7.1 9 Note: Returns up to 1 year are on absolute basis & more than 1 year are on CAGR basis. as on 11 Mar 22 Research Highlights & Commentary of 4 Funds showcased
Commentary Baroda Pioneer Conservative Hybrid Fund ICICI Prudential MIP 25 DSP Regular Savings Fund Aditya Birla Sun Life Regular Savings Fund Point 1 Bottom quartile AUM (₹33 Cr). Highest AUM (₹3,270 Cr). Lower mid AUM (₹175 Cr). Upper mid AUM (₹1,467 Cr). Point 2 Oldest track record among peers (22 yrs). Established history (22+ yrs). Established history (22+ yrs). Established history (22+ yrs). Point 3 Rating: 2★ (bottom quartile). Top rated. Rating: 3★ (lower mid). Rating: 5★ (upper mid). Point 4 Risk profile: Moderate. Risk profile: Moderately High. Risk profile: Moderately High. Risk profile: Moderately High. Point 5 5Y return: 7.83% (top quartile). 5Y return: 7.05% (upper mid). 5Y return: 6.52% (bottom quartile). 5Y return: 6.64% (lower mid). Point 6 3Y return: 9.05% (top quartile). 3Y return: 7.51% (upper mid). 3Y return: 7.37% (lower mid). 3Y return: 7.25% (bottom quartile). Point 7 1Y return: 3.31% (top quartile). 1Y return: 0.51% (bottom quartile). 1Y return: 1.12% (upper mid). 1Y return: 0.77% (lower mid). Point 8 1M return: -1.08% (top quartile). 1M return: -1.31% (lower mid). 1M return: -1.17% (upper mid). 1M return: -1.59% (bottom quartile). Point 9 Alpha: 0.25 (top quartile). Alpha: 0.00 (lower mid). Alpha: -0.32 (bottom quartile). Alpha: 0.11 (upper mid). Point 10 Sharpe: 0.85 (top quartile). Sharpe: -0.76 (bottom quartile). Sharpe: -0.58 (lower mid). Sharpe: -0.49 (upper mid). Baroda Pioneer Conservative Hybrid Fund
ICICI Prudential MIP 25
DSP Regular Savings Fund
Aditya Birla Sun Life Regular Savings Fund
(Erstwhile Baroda Pioneer MIP Fund) To generate regular income through investment in debt and money market instruments and also to generate long term capital appreciation by investing a portion in equity and equity related instruments. Research Highlights for Baroda Pioneer Conservative Hybrid Fund Below is the key information for Baroda Pioneer Conservative Hybrid Fund Returns up to 1 year are on The Scheme seeks to generate regular income through investments primarily in debt and money market instruments. As a secondary objective, the Scheme also seeks to generate long term capital appreciation from the portion of equity investments under the Scheme. However, there can be no assurance that the investment objectives of the Scheme will be realized. Research Highlights for ICICI Prudential MIP 25 Below is the key information for ICICI Prudential MIP 25 Returns up to 1 year are on (Erstwhile DSP BlackRock MIP Fund) The scheme is seeking to generate an attractive return, consistent with prudent risk, from a portfolio which is substantially constituted of quality debt securities. The scheme will also seek to generate capital appreciation by investing a smaller portion of its corpus in equity and equity related securities of the 100 largest corporates by market capitalisation, listed in India. Research Highlights for DSP Regular Savings Fund Below is the key information for DSP Regular Savings Fund Returns up to 1 year are on (Erstwhile Aditya Birla Sun Life MIP II - Wealth 25 Plan) An Open-ended income scheme with the objective to generate regular income so as to make monthly payment or distribution to unit holders with the secondary objective being growth of capital. Monthly Income is not assured and is subject to availability of distributable surplus. Research Highlights for Aditya Birla Sun Life Regular Savings Fund Below is the key information for Aditya Birla Sun Life Regular Savings Fund Returns up to 1 year are on 1. Baroda Pioneer Conservative Hybrid Fund
Baroda Pioneer Conservative Hybrid Fund
Growth Launch Date 8 Sep 04 NAV (11 Mar 22) ₹30.2092 ↑ 0.02 (0.06 %) Net Assets (Cr) ₹33 on 31 Jan 22 Category Hybrid - Hybrid Debt AMC Baroda Pioneer Asset Management Co. Ltd. Rating ☆☆ Risk Moderate Expense Ratio 2.08 Sharpe Ratio 0.85 Information Ratio -0.38 Alpha Ratio 0.25 Min Investment 5,000 Min SIP Investment 500 Exit Load NIL Growth of 10,000 investment over the years.
Date Value Returns for Baroda Pioneer Conservative Hybrid Fund
absolute basis & more than 1 year are on CAGR (Compound Annual Growth Rate) basis. as on 11 Mar 22 Duration Returns 1 Month -1.1% 3 Month -1.7% 6 Month -1.2% 1 Year 3.3% 3 Year 9.1% 5 Year 7.8% 10 Year 15 Year Since launch 6.5% Historical performance (Yearly) on absolute basis
Year Returns 2025 2024 2023 2022 2021 2020 2019 2018 2017 2016 Fund Manager information for Baroda Pioneer Conservative Hybrid Fund
Name Since Tenure Data below for Baroda Pioneer Conservative Hybrid Fund as on 31 Jan 22
Asset Allocation
Asset Class Value Equity Sector Allocation
Sector Value Debt Sector Allocation
Sector Value Credit Quality
Rating Value Top Securities Holdings / Portfolio
Name Holding Value Quantity 2. ICICI Prudential MIP 25
ICICI Prudential MIP 25
Growth Launch Date 30 Mar 04 NAV (21 Oct 26) ₹77.7812 ↓ -0.25 (-0.32 %) Net Assets (Cr) ₹3,270 on 30 Sep 26 Category Hybrid - Hybrid Debt AMC ICICI Prudential Asset Management Company Limited Rating ☆☆☆☆☆ Risk Moderately High Expense Ratio 1.72 Sharpe Ratio -0.76 Information Ratio 0 Alpha Ratio 0 Min Investment 5,000 Min SIP Investment 100 Exit Load 0-1 Years (1%),1 Years and above(NIL) Growth of 10,000 investment over the years.
Date Value 30 Sep 21 ₹10,000 30 Sep 22 ₹10,388 30 Sep 23 ₹11,356 30 Sep 24 ₹13,138 30 Sep 25 ₹13,913 30 Sep 26 ₹14,214 Returns for ICICI Prudential MIP 25
absolute basis & more than 1 year are on CAGR (Compound Annual Growth Rate) basis. as on 11 Mar 22 Duration Returns 1 Month -1.3% 3 Month -1.8% 6 Month -0.3% 1 Year 0.5% 3 Year 7.5% 5 Year 7.1% 10 Year 15 Year Since launch 9.5% Historical performance (Yearly) on absolute basis
Year Returns 2025 7.9% 2024 11.4% 2023 11.4% 2022 5.1% 2021 9.9% 2020 10.9% 2019 9.6% 2018 5.1% 2017 12.9% 2016 10.9% Fund Manager information for ICICI Prudential MIP 25
Name Since Tenure Manish Banthia 19 Sep 13 12.96 Yr. Akhil Kakkar 22 Jan 24 2.61 Yr. Roshan Chutkey 2 May 22 4.34 Yr. Sharmila D'Silva 31 Jul 22 4.09 Yr. Data below for ICICI Prudential MIP 25 as on 30 Sep 26
Asset Allocation
Asset Class Value Cash 7.15% Equity 23.16% Debt 69.39% Other 0.31% Equity Sector Allocation
Sector Value Financial Services 8.16% Consumer Cyclical 3.14% Health Care 2.89% Consumer Defensive 2.17% Basic Materials 1.38% Communication Services 1.29% Technology 1.06% Industrials 0.96% Utility 0.93% Energy 0.75% Real Estate 0.44% Debt Sector Allocation
Sector Value Corporate 49.5% Government 22.11% Cash Equivalent 4.93% Credit Quality
Rating Value A 2.89% AA 56.76% AAA 40.36% Top Securities Holdings / Portfolio
Name Holding Value Quantity 6.9% Govt Stock 2065
Sovereign Bonds | -4% ₹135 Cr 15,000,000 Adani Enterprises Limited
Debentures | -3% ₹100 Cr 10,000 Manappuram Finance Limited
Debentures | -3% ₹99 Cr 10,000 6.94% Govt Stock 2036
Sovereign Bonds | -3% ₹99 Cr 9,964,700 Godrej Properties Limited
Debentures | -2% ₹75 Cr 7,500 National Bank For Agriculture And Rural Development
Debentures | -2% ₹75 Cr 7,500 Yes Bank Limited
Debentures | -2% ₹65 Cr 650 6.45% Govt Stock 2034
Sovereign Bonds | -2% ₹55 Cr 5,369,910 Vedanta Limited
Debentures | -2% ₹50 Cr 5,000 Eris Lifesciences Limited
Debentures | -2% ₹50 Cr 5,000 3. DSP Regular Savings Fund
DSP Regular Savings Fund
Growth Launch Date 11 Jun 04 NAV (21 Oct 26) ₹60.1147 ↓ -0.13 (-0.21 %) Net Assets (Cr) ₹175 on 30 Sep 26 Category Hybrid - Hybrid Debt AMC DSP BlackRock Invmt Managers Pvt. Ltd. Rating ☆☆☆ Risk Moderately High Expense Ratio 1.19 Sharpe Ratio -0.58 Information Ratio 0.46 Alpha Ratio -0.32 Min Investment 1,000 Min SIP Investment 500 Exit Load 0-12 Months (1%),12 Months and above(NIL) Growth of 10,000 investment over the years.
Date Value 30 Sep 21 ₹10,000 30 Sep 22 ₹10,013 30 Sep 23 ₹10,987 30 Sep 24 ₹12,798 30 Sep 25 ₹13,389 30 Sep 26 ₹13,742 Returns for DSP Regular Savings Fund
absolute basis & more than 1 year are on CAGR (Compound Annual Growth Rate) basis. as on 11 Mar 22 Duration Returns 1 Month -1.2% 3 Month -1.4% 6 Month -0.1% 1 Year 1.1% 3 Year 7.4% 5 Year 6.5% 10 Year 15 Year Since launch 8.4% Historical performance (Yearly) on absolute basis
Year Returns 2025 7.2% 2024 11% 2023 12% 2022 3.5% 2021 7.8% 2020 9.3% 2019 6.9% 2018 -5.3% 2017 11% 2016 10.7% Fund Manager information for DSP Regular Savings Fund
Name Since Tenure Abhishek Singh 31 May 21 5.26 Yr. Shantanu Godambe 1 Aug 24 2.08 Yr. Data below for DSP Regular Savings Fund as on 30 Sep 26
Asset Allocation
Asset Class Value Cash 18.27% Equity 21.34% Debt 60.39% Equity Sector Allocation
Sector Value Financial Services 9.42% Health Care 2.62% Consumer Cyclical 2.59% Energy 1.69% Basic Materials 1.11% Consumer Defensive 1.09% Utility 1.01% Communication Services 0.83% Technology 0.49% Real Estate 0.33% Industrials 0.16% Debt Sector Allocation
Sector Value Government 52.59% Corporate 21.66% Cash Equivalent 4.41% Credit Quality
Rating Value AA 9.65% AAA 90.35% Top Securities Holdings / Portfolio
Name Holding Value Quantity 7.32% Govt Stock 2030
Sovereign Bonds | -12% ₹21 Cr 2,000,000 6.75% Govt Stock 2033
Sovereign Bonds | -9% ₹16 Cr 1,500,000 7.03% Maharashtra Sgs 2038
Sovereign Bonds | -8% ₹14 Cr 1,500,000 7.06% Govt Stock 2028
Sovereign Bonds | -6% ₹10 Cr 1,000,000 6.48% Govt Stock 2035
Sovereign Bonds | -6% ₹10 Cr 1,000,000 Muthoot Finance Limited
Debentures | -4% ₹8 Cr 750 Cholamandalam Investment And Finance Company Limited
Debentures | -3% ₹5 Cr 500 6.64% Govt Stock 2031
Sovereign Bonds | -3% ₹5 Cr 500,000 7.1% Govt Stock 2029
Sovereign Bonds | -3% ₹5 Cr 500,000 7.1% Govt Stock 2034
Sovereign Bonds | -3% ₹5 Cr 500,000 4. Aditya Birla Sun Life Regular Savings Fund
Aditya Birla Sun Life Regular Savings Fund
Growth Launch Date 22 May 04 NAV (21 Oct 26) ₹68.9741 ↓ -0.20 (-0.28 %) Net Assets (Cr) ₹1,467 on 30 Sep 26 Category Hybrid - Hybrid Debt AMC Birla Sun Life Asset Management Co Ltd Rating ☆☆☆☆☆ Risk Moderately High Expense Ratio 1.86 Sharpe Ratio -0.49 Information Ratio 0.28 Alpha Ratio 0.11 Min Investment 1,000 Min SIP Investment 500 Exit Load 0-365 Days (1%),365 Days and above(NIL) Growth of 10,000 investment over the years.
Date Value 30 Sep 21 ₹10,000 30 Sep 22 ₹10,403 30 Sep 23 ₹11,259 30 Sep 24 ₹12,816 30 Sep 25 ₹13,551 30 Sep 26 ₹13,956 Returns for Aditya Birla Sun Life Regular Savings Fund
absolute basis & more than 1 year are on CAGR (Compound Annual Growth Rate) basis. as on 11 Mar 22 Duration Returns 1 Month -1.6% 3 Month -1.8% 6 Month 1 Year 0.8% 3 Year 7.2% 5 Year 6.6% 10 Year 15 Year Since launch 9% Historical performance (Yearly) on absolute basis
Year Returns 2025 7.1% 2024 10.5% 2023 9.6% 2022 5.3% 2021 13.4% 2020 9.2% 2019 5.8% 2018 -2.2% 2017 15.5% 2016 13.1% Fund Manager information for Aditya Birla Sun Life Regular Savings Fund
Name Since Tenure Mohit Sharma 31 Oct 24 1.84 Yr. Harshil Suvarnkar 22 Mar 21 5.45 Yr. Data below for Aditya Birla Sun Life Regular Savings Fund as on 30 Sep 26
Asset Allocation
Asset Class Value Cash 10.56% Equity 23.02% Debt 66.08% Other 0.34% Equity Sector Allocation
Sector Value Financial Services 7.8% Health Care 2.84% Consumer Cyclical 2.39% Industrials 1.98% Basic Materials 1.94% Real Estate 1.43% Technology 1.16% Communication Services 1.11% Utility 0.91% Consumer Defensive 0.83% Energy 0.63% Debt Sector Allocation
Sector Value Corporate 52.56% Government 19.65% Cash Equivalent 4.42% Credit Quality
Rating Value A 5.77% AA 32.85% AAA 61.39% Top Securities Holdings / Portfolio
Name Holding Value Quantity Cholamandalam Investment And Finance Company Limited
Debentures | -4% ₹55 Cr 5,500 Muthoot Finance Limited
Debentures | -3% ₹50 Cr 5,000 India (Republic of)
- | -3% ₹50 Cr 5,000,000 Tata Capital Housing Finance Limited
Debentures | -3% ₹49 Cr 4,982 Jtpm Metal TRaders Limited
Debentures | -3% ₹47 Cr 4,316 Adani Power Limited
Debentures | -2% ₹35 Cr 3,500 Nuvama Wealth Finance Limited
Debentures | -2% ₹30 Cr 3,000 Bharti Telecom Limited
Debentures | -2% ₹30 Cr 3,000 Jubilant Bevco Limited
Debentures | -2% ₹28 Cr 2,500 ICICI Bank Ltd (Financial Services)
Equity, Since 31 Oct 18 | ICICIBANK2% ₹28 Cr 206,000
MIP ਮਿਉਚੁਅਲ ਫੰਡ ਸਕੀਮ ਵਿੱਚ ਜੋਖਮ
ਅੱਗੇਨਿਵੇਸ਼ ਉੱਪਰ ਦੱਸੇ ਗਏ ਸਭ ਤੋਂ ਵਧੀਆ ਮਾਸਿਕ ਆਮਦਨੀ ਯੋਜਨਾਵਾਂ ਵਿੱਚੋਂ ਕਿਸੇ ਵਿੱਚ, ਤੁਹਾਨੂੰ ਮਾਸਿਕ ਆਮਦਨ ਯੋਜਨਾ ਦੇ ਜੋਖਮਾਂ ਨੂੰ ਜਾਣਨਾ ਚਾਹੀਦਾ ਹੈ।
ਕੋਈ ਪੱਕਾ ਭਰੋਸਾ ਨਹੀਂ
ਇਹ ਇੱਕ ਆਮ ਧਾਰਨਾ ਹੈ ਕਿ ਮਹੀਨਾਵਾਰ ਆਮਦਨ ਯੋਜਨਾ ਮਹੀਨਾਵਾਰ ਨਿਸ਼ਚਿਤ ਆਮਦਨ ਪ੍ਰਦਾਨ ਕਰਦੀ ਹੈ। ਪਰ, ਅਜਿਹੇ ਮਿਉਚੁਅਲ ਫੰਡਾਂ ਵਿੱਚ ਯਕੀਨੀ ਰਿਟਰਨ ਦੀ ਕੋਈ ਗਰੰਟੀ ਨਹੀਂ ਹੈ। ਕਿਉਂਕਿ ਇਹ ਸਕੀਮ ਵੀ ਨਿਵੇਸ਼ ਕਰਦੀ ਹੈਇਕੁਇਟੀ, ਰਿਟਰਨ ਫੰਡ ਦੀ ਕਾਰਗੁਜ਼ਾਰੀ ਅਤੇ ਮਾਰਕੀਟ ਸਥਿਤੀ 'ਤੇ ਨਿਰਭਰ ਕਰਦਾ ਹੈ।
Talk to our investment specialist
ਲਾਭਅੰਸ਼ ਮੁਨਾਫੇ ਦੁਆਰਾ ਘੋਸ਼ਿਤ ਕੀਤੇ ਜਾਂਦੇ ਹਨ ਨਾ ਕਿ ਪੂੰਜੀ ਦੁਆਰਾ
ਮਹੀਨਾਵਾਰ ਆਮਦਨ ਸਕੀਮ ਲਈ ਲਾਭਅੰਸ਼ ਦਾ ਭੁਗਤਾਨ ਸਿਰਫ਼ ਵਾਧੂ ਆਮਦਨ ਤੋਂ ਕੀਤਾ ਜਾ ਸਕਦਾ ਹੈ ਨਾ ਕਿ ਤੋਂਪੂੰਜੀ ਨਿਵੇਸ਼. ਉਦਾਹਰਨ ਲਈ, ਜੇਕਰ ਸ਼ੁੱਧ ਸੰਪਤੀ ਮੁੱਲ (ਨਹੀ ਹਨ) ਤੋਂ ਫੰਡ ਵਧਦਾ ਹੈINR 10 ਤੋਂ INR 13, ਸਕੀਮ ਸਿਰਫ INR 3 ਵਿੱਚੋਂ ਹੀ ਘੋਸ਼ਿਤ ਕਰ ਸਕਦੀ ਹੈ ਜੋ ਇਸਨੇ ਪੂੰਜੀ ਪ੍ਰਸ਼ੰਸਾ ਵਿੱਚ ਕਮਾਏ ਹਨ। ਇਸ ਲਈ, ਜੇਕਰ ਸਕੀਮ ਦੀ NAV ਹੌਲੀ-ਹੌਲੀ ਵਧਦੀ ਹੈ ਜਾਂ ਮਾਰਕੀਟ ਦੀ ਚਾਲ ਦੇ ਕਾਰਨ ਘਟਦੀ ਹੈ, ਤਾਂ ਇਹ ਲਾਭਅੰਸ਼ ਦਾ ਐਲਾਨ ਨਹੀਂ ਕਰ ਸਕਦੀ।
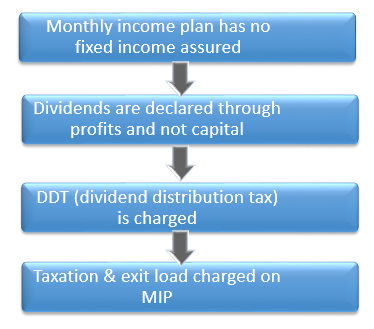
ਡੀਡੀਟੀ ਚਾਰਜ ਕੀਤਾ ਜਾਂਦਾ ਹੈ
ਜੇਕਰ ਤੁਸੀਂ ਲਾਭਅੰਸ਼ ਵਿਕਲਪ ਦੇ ਨਾਲ MIP ਦੀ ਚੋਣ ਕਰਦੇ ਹੋ, ਤਾਂ ਜੋ ਆਮਦਨ ਤੁਸੀਂ ਸਮੇਂ-ਸਮੇਂ 'ਤੇ ਲਾਭਅੰਸ਼ ਦੇ ਰੂਪ ਵਿੱਚ ਕਮਾਉਂਦੇ ਹੋ, ਉਸ 'ਤੇ ਲਾਭਅੰਸ਼ ਵੰਡ ਟੈਕਸ (DDT) ਲਗਾਇਆ ਜਾਂਦਾ ਹੈ। ਇਸ ਲਈ, ਰਿਟਰਨ ਪੂਰੀ ਤਰ੍ਹਾਂ ਟੈਕਸ-ਮੁਕਤ ਨਹੀਂ ਹਨ।
MIP 'ਤੇ ਟੈਕਸੇਸ਼ਨ ਅਤੇ ਐਗਜ਼ਿਟ ਲੋਡ
ਕੁਝ ਮਾਸਿਕ ਆਮਦਨੀ ਸਕੀਮਾਂ ਦੀ ਲਾਕ-ਇਨ ਪੀਰੀਅਡ ਵੱਧ ਤੋਂ ਵੱਧ ਤਿੰਨ ਸਾਲਾਂ ਤੱਕ ਹੁੰਦੀ ਹੈ, ਇਸ ਲਈ ਜੇਕਰ ਸਕੀਮ ਮਿਆਦ ਪੂਰੀ ਹੋਣ ਤੋਂ ਪਹਿਲਾਂ ਵੇਚੀ ਜਾਂਦੀ ਹੈ ਤਾਂ ਇੱਕ ਨਿਸ਼ਚਿਤ ਐਗਜ਼ਿਟ ਲੋਡ ਲਾਗੂ ਹੁੰਦਾ ਹੈ। ਨਾਲ ਹੀ, MIP ਆਪਣੀ ਜ਼ਿਆਦਾਤਰ ਸੰਪਤੀਆਂ ਨੂੰ ਕਰਜ਼ੇ ਦੇ ਯੰਤਰਾਂ ਵਿੱਚ ਨਿਵੇਸ਼ ਕਰਦੇ ਹਨ, ਇਸਲਈ ਕਰਜ਼ੇ ਦੇ ਨਿਵੇਸ਼ ਦੇ ਅਨੁਸਾਰ ਉਹਨਾਂ 'ਤੇ ਟੈਕਸ ਲਗਾਇਆ ਜਾਂਦਾ ਹੈ।
ਮਹੀਨਾਵਾਰ ਆਮਦਨੀ ਯੋਜਨਾਵਾਂ ਵਿੱਚ ਔਨਲਾਈਨ ਨਿਵੇਸ਼ ਕਿਵੇਂ ਕਰੀਏ?
Fincash.com 'ਤੇ ਜੀਵਨ ਭਰ ਲਈ ਮੁਫਤ ਨਿਵੇਸ਼ ਖਾਤਾ ਖੋਲ੍ਹੋ।
ਆਪਣੀ ਰਜਿਸਟ੍ਰੇਸ਼ਨ ਅਤੇ ਕੇਵਾਈਸੀ ਪ੍ਰਕਿਰਿਆ ਨੂੰ ਪੂਰਾ ਕਰੋ
ਦਸਤਾਵੇਜ਼ (ਪੈਨ, ਆਧਾਰ, ਆਦਿ) ਅੱਪਲੋਡ ਕਰੋ।ਅਤੇ, ਤੁਸੀਂ ਨਿਵੇਸ਼ ਕਰਨ ਲਈ ਤਿਆਰ ਹੋ!
ਇਹ ਯਕੀਨੀ ਬਣਾਉਣ ਲਈ ਸਾਰੇ ਯਤਨ ਕੀਤੇ ਗਏ ਹਨ ਕਿ ਇੱਥੇ ਦਿੱਤੀ ਗਈ ਜਾਣਕਾਰੀ ਸਹੀ ਹੈ। ਹਾਲਾਂਕਿ, ਡੇਟਾ ਦੀ ਸ਼ੁੱਧਤਾ ਬਾਰੇ ਕੋਈ ਗਾਰੰਟੀ ਨਹੀਂ ਦਿੱਤੀ ਗਈ ਹੈ। ਕਿਰਪਾ ਕਰਕੇ ਕੋਈ ਵੀ ਨਿਵੇਸ਼ ਕਰਨ ਤੋਂ ਪਹਿਲਾਂ ਸਕੀਮ ਜਾਣਕਾਰੀ ਦਸਤਾਵੇਜ਼ ਨਾਲ ਤਸਦੀਕ ਕਰੋ।
You Might Also Like








AMFI Registration No. 112358 | CIN: U74999MH2016PTC282153
Shepard Technologies Pvt. Ltd. (with ARN code 112358) makes no warranties or representations, express or implied, on products offered through the platform. It accepts no liability for any damages or losses, however caused, in connection with the use of, or on the reliance of its product or related services. Terms and conditions of the website are applicable.
©2026 Shepard Technologies Private Limited. All Rights Reserved
You clarified nicely that MIP is not about regular monthly income as its returns works like regular mutual fund schemes. But is this MIP having risk with the capital too. Do we lose capital in case market performance is poor ie same as MFs
Best information is given for investment
Please advise for investment regards
Excellent understand ing