Know Different Types of Technical Charts
You must have heard the phrase, “A picture speaks a thousand words.” But, when you would look at a technical chart, you can figure out more information than expected. For an experienced analyst, understanding this chart can help significantly when it comes to Investing in stocks and shares.
Being an integral part of Technical Analysis, charts can help acquire necessary information, valuable enough to make a better decision. In this post, let’s find out more about the technical chart and its varying aspects.
Importance of Technical Chart
Generally, the stock chart analysis aims to discover market trends and patterns with the help of different chart types and functions. These can help you identify what could be expected out of the movement of specific stocks and shares; thus, helping you save significantly from losses.
Types of Technical Charts
There are three primary types of technical charts. Although all of them are generated with similar price data, however, the information that they display comes in the varying method. Hence, all three of them require different technical analysis to assist traders to make cautious decisions across stocks, forex, commodities market, and indices.
Line Charts
When it comes to technical chart analysis of Indian stock, a line chart displays nothing but a closing price. Every closing price is associated with the last closing price to form a consistent line that turns out to be easy to track. Often, this chart type is used for web articles, newspapers, and televisions, courtesy to its simplified way of providing information.
Appropriate for beginners who wish to trade stocks, the line chart can help regulate the trading emotion by choosing a more neutral colour, just as blue signified in the chart mentioned above. The reason behind it is that this chart type eradicates choppy movements that are displayed in different colours in a candlestick or a bar chart.
Talk to our investment specialist
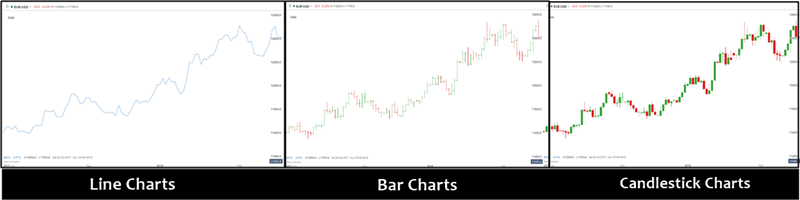
Bar Charts
A bar chart practically showcases the open and closing, high and low prices for every period designated to the bar. As shown above, the vertical line signifies the highest and lowest price. And, the dash towards the left shows the opening price while the dash towards the right shows the closing price
This chart is perfect for intermediate traders who wish to trade in commodities, indices, stocks, and forex. Being able to figure out whether the bar is going up or down towards its end indicates the sentiment of the market (bearish or bullish) for that time.
This one helps traders get more detailed information while executing technical chart analysis of Indian stock, helpful in comprehending the essential data and levels to make a successful trade.
Candlestick Charts
This one chart helps by displaying the opening and closing, high and low price for every period that has been designated to the candle. The body of every candle signifies the closing and opening prices while the wicks tell about the low and high.
However, in this one, the colour of every candle majorly depends upon the applied settings; however, most of the charts would use red and green as default colours.
This one is also good enough for intermediate people who wish to trade commodities, indices, stocks, and forex. By far, this is the popular chart type that is used in technical forex analysis, considering that it offers traders more information while being easy to look at.
Analyzing Technical Charts
Technical chart analysis technique can vary based on the traded market and the strategies implemented. It is essential to be comfortable and familiar with these strategies before executing anything. Ultimately, once you have learned how to analyze these charts, establishing trading consistency will become quite easier.
Also, before you move forward, ask yourself whether you would like to trade for a short, medium, or long time period. Getting this answer will then help you figure out which chart should you be refereeing to when it comes to acquiring relevant information.
All efforts have been made to ensure the information provided here is accurate. However, no guarantees are made regarding correctness of data. Please verify with scheme information document before making any investment.


AMFI Registration No. 112358 | CIN: U74999MH2016PTC282153
Shepard Technologies Pvt. Ltd. (with ARN code 112358) makes no warranties or representations, express or implied, on products offered through the platform. It accepts no liability for any damages or losses, however caused, in connection with the use of, or on the reliance of its product or related services. Terms and conditions of the website are applicable.
©2026 Shepard Technologies Private Limited. All Rights Reserved