லம்ப்சம் கால்குலேட்டர்
லம்ப்சம் கால்குலேட்டர் முதலீட்டாளர்கள் தங்கள் லம்ப்சம் முதலீடு ஒரு குறிப்பிட்ட காலக்கட்டத்தில் எவ்வாறு வளர்கிறது என்பதைச் சரிபார்க்க உதவுகிறது. மொத்த முதலீட்டு முறையில், மக்கள் திட்டத்தில் ஒரு முறை முன்பணமாக கணிசமான தொகையை முதலீடு செய்கிறார்கள். மியூச்சுவல் ஃபண்ட் முதலீடு பற்றி பேசும் போதெல்லாம், நம் மனதில் முதலில் ஒலிக்கும் விஷயம், “எவ்வளவு தொகை முதலீடு செய்ய வேண்டும்?” என்பதுதான். எதிர்பார்க்கப்படும் வருமானம், ஆபத்து-பசி, முதலீட்டு காலம் மற்றும் பலவற்றுடன் தொடர்புடைய பல கேள்விகள் இருந்தாலும்; நம் காதுகளில் எப்போதும் ஒலிக்கும் முதல் எண்ணம் முதலீட்டுத் தொகை.
எனவே, ஒரு முறை முதலீட்டின் வளர்ச்சியை மதிப்பிடுவதற்கு லம்ப்சம் கால்குலேட்டர் எவ்வாறு உதவுகிறது என்பதைப் பார்ப்போம்பரஸ்பர நிதி.
லம்ப்சம் கால்குலேட்டர் விளக்கம்
பின்வரும் தரவுகளின் உதவியுடன் உங்கள் லம்ப்சம் முதலீட்டின் வருமானத்தைக் கணக்கிடுங்கள்.
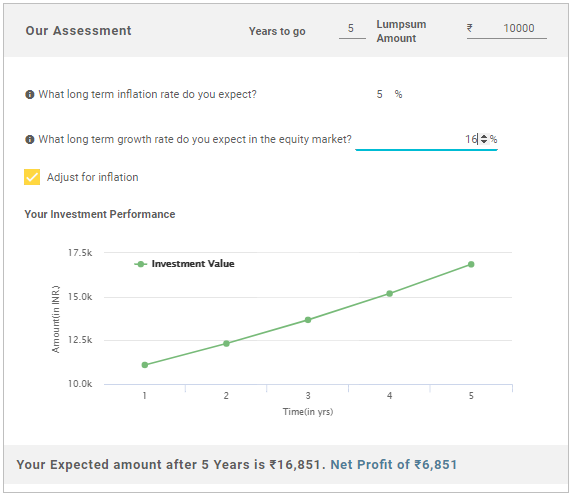
முதலீட்டு காலம்: 5 ஆண்டுகள்
லம்ப்சம் முதலீட்டுத் தொகை: ₹10,000
நீண்ட காலவீக்கம் (%): 5 (தோராயமாக)
நீண்ட கால வருமானம் (%): 16 (தோராயமாக)
லம்ப்சம் கால்குலேட்டரின்படி எதிர்பார்க்கப்படும் வருமானம்: ₹6,851
5 ஆண்டுகளுக்குப் பிறகு மொத்தத் தொகை: ₹16,851
Talk to our investment specialist
2018 ஆம் ஆண்டில் லம்ப்சம் முதலீட்டிற்கான சிறந்த 10 மியூச்சுவல் ஃபண்டுகள்
Fund NAV Net Assets (Cr) Min Investment 3 MO (%) 6 MO (%) 1 YR (%) 3 YR (%) 5 YR (%) 2025 (%) Sundaram Rural and Consumption Fund Growth ₹91.4109
↓ -0.12 ₹1,388 5,000 3.8 -3.6 -6.4 9.3 10.7 -0.1 Franklin Asian Equity Fund Growth ₹44.415
↓ -0.56 ₹870 5,000 14.4 20.7 45.1 19.3 7 23.7 Franklin Build India Fund Growth ₹145.465
↓ -0.21 ₹3,160 5,000 -0.1 3.6 0.9 20.7 19.7 3.7 DSP Natural Resources and New Energy Fund Growth ₹106.16
↑ 0.16 ₹2,457 1,000 -2.4 3.5 18.1 19.6 15.8 17.5 DSP Equity Opportunities Fund Growth ₹623.748
↓ -2.87 ₹17,370 1,000 2.6 -1.8 0.1 15.9 12.7 7.1 DSP US Flexible Equity Fund Growth ₹94.2682
↓ -0.06 ₹1,323 1,000 12.4 20.9 48.3 27 18.3 33.8 Bandhan Infrastructure Fund Growth ₹50.125
↓ -0.10 ₹1,495 5,000 6.3 7.5 -2.8 18.8 17.3 -6.9 Tata India Tax Savings Fund Growth ₹46.4266
↓ -0.09 ₹4,516 500 4.1 2.8 3.7 13.2 12.9 4.9 Aditya Birla Sun Life Banking And Financial Services Fund Growth ₹63.65
↓ -0.55 ₹3,466 1,000 4.3 0 3.5 12 11.5 17.5 Aditya Birla Sun Life Small Cap Fund Growth ₹96.1074
↑ 0.04 ₹5,453 1,000 13.9 15.1 8.6 16.1 12.7 -3.7 Note: Returns up to 1 year are on absolute basis & more than 1 year are on CAGR basis. as on 16 Jul 26 Research Highlights & Commentary of 10 Funds showcased
Commentary Sundaram Rural and Consumption Fund Franklin Asian Equity Fund Franklin Build India Fund DSP Natural Resources and New Energy Fund DSP Equity Opportunities Fund DSP US Flexible Equity Fund Bandhan Infrastructure Fund Tata India Tax Savings Fund Aditya Birla Sun Life Banking And Financial Services Fund Aditya Birla Sun Life Small Cap Fund Point 1 Bottom quartile AUM (₹1,388 Cr). Bottom quartile AUM (₹870 Cr). Upper mid AUM (₹3,160 Cr). Lower mid AUM (₹2,457 Cr). Highest AUM (₹17,370 Cr). Bottom quartile AUM (₹1,323 Cr). Lower mid AUM (₹1,495 Cr). Upper mid AUM (₹4,516 Cr). Upper mid AUM (₹3,466 Cr). Top quartile AUM (₹5,453 Cr). Point 2 Established history (20+ yrs). Established history (18+ yrs). Established history (16+ yrs). Established history (18+ yrs). Oldest track record among peers (26 yrs). Established history (13+ yrs). Established history (15+ yrs). Established history (11+ yrs). Established history (12+ yrs). Established history (19+ yrs). Point 3 Top rated. Rating: 5★ (top quartile). Rating: 5★ (upper mid). Rating: 5★ (upper mid). Rating: 5★ (upper mid). Rating: 5★ (lower mid). Rating: 5★ (lower mid). Rating: 5★ (bottom quartile). Rating: 5★ (bottom quartile). Rating: 5★ (bottom quartile). Point 4 Risk profile: Moderately High. Risk profile: High. Risk profile: High. Risk profile: High. Risk profile: Moderately High. Risk profile: High. Risk profile: High. Risk profile: Moderately High. Risk profile: High. Risk profile: Moderately High. Point 5 5Y return: 10.73% (bottom quartile). 5Y return: 7.04% (bottom quartile). 5Y return: 19.73% (top quartile). 5Y return: 15.75% (upper mid). 5Y return: 12.71% (lower mid). 5Y return: 18.35% (top quartile). 5Y return: 17.26% (upper mid). 5Y return: 12.86% (upper mid). 5Y return: 11.45% (bottom quartile). 5Y return: 12.65% (lower mid). Point 6 3Y return: 9.33% (bottom quartile). 3Y return: 19.27% (upper mid). 3Y return: 20.66% (top quartile). 3Y return: 19.61% (upper mid). 3Y return: 15.90% (lower mid). 3Y return: 26.97% (top quartile). 3Y return: 18.79% (upper mid). 3Y return: 13.20% (bottom quartile). 3Y return: 11.97% (bottom quartile). 3Y return: 16.11% (lower mid). Point 7 1Y return: -6.38% (bottom quartile). 1Y return: 45.05% (top quartile). 1Y return: 0.94% (lower mid). 1Y return: 18.11% (upper mid). 1Y return: 0.11% (bottom quartile). 1Y return: 48.34% (top quartile). 1Y return: -2.83% (bottom quartile). 1Y return: 3.74% (upper mid). 1Y return: 3.46% (lower mid). 1Y return: 8.57% (upper mid). Point 8 Alpha: -7.81 (bottom quartile). Alpha: 0.00 (upper mid). Alpha: 0.00 (upper mid). Alpha: 0.00 (upper mid). Alpha: -4.38 (bottom quartile). Alpha: -3.23 (bottom quartile). Alpha: 0.00 (lower mid). Alpha: 3.02 (top quartile). Alpha: 3.78 (top quartile). Alpha: 0.00 (lower mid). Point 9 Sharpe: -0.65 (bottom quartile). Sharpe: 1.73 (top quartile). Sharpe: 0.01 (upper mid). Sharpe: 1.33 (upper mid). Sharpe: -0.33 (bottom quartile). Sharpe: 2.57 (top quartile). Sharpe: -0.26 (bottom quartile). Sharpe: -0.04 (lower mid). Sharpe: -0.15 (lower mid). Sharpe: 0.23 (upper mid). Point 10 Information ratio: -0.55 (bottom quartile). Information ratio: 0.00 (upper mid). Information ratio: 0.00 (lower mid). Information ratio: 0.00 (lower mid). Information ratio: 0.03 (upper mid). Information ratio: 0.13 (upper mid). Information ratio: 0.00 (bottom quartile). Information ratio: 0.21 (top quartile). Information ratio: 0.28 (top quartile). Information ratio: 0.00 (bottom quartile). Sundaram Rural and Consumption Fund
Franklin Asian Equity Fund
Franklin Build India Fund
DSP Natural Resources and New Energy Fund
DSP Equity Opportunities Fund
DSP US Flexible Equity Fund
Bandhan Infrastructure Fund
Tata India Tax Savings Fund
Aditya Birla Sun Life Banking And Financial Services Fund
Aditya Birla Sun Life Small Cap Fund
லம்ப்சம் கால்குலேட்டரைப் புரிந்துகொள்வது
புதிதாக முதலீடு செய்ய விரும்பும் நபர்கள், லம்ப்சம் கால்குலேட்டரின் கருத்தையும் அதன் செயல்பாட்டையும் புரிந்துகொள்வது கடினம். எனவே, சிக்கல்களை எளிதாக்க, கணக்கீடு பற்றிய விரிவான தகவல்கள் கொடுக்கப்பட்டுள்ளன. செயல்முறையைப் புரிந்து கொள்ள இந்தத் தகவலைப் பார்க்கவும். லம்ப்சம் கால்குலேட்டரில் வழங்கப்பட வேண்டிய உள்ளீட்டுத் தரவு பின்வருவனவற்றை உள்ளடக்குகிறது:
- லம்ப்சம் முதலீட்டின் காலம்
- பணத்தின் அளவு லம்ப்சம் முறையில் முதலீடு செய்யப்படுகிறது
- ஈக்விட்டி சந்தைகளில் இருந்து நீண்ட கால வருமானம் எதிர்பார்க்கப்படுகிறது
- எதிர்பார்க்கப்படும் ஆண்டு பணவீக்கம்
இது எப்படி வேலை செய்கிறது?
எந்தவொரு முதலீட்டு நோக்கத்திற்கும் எப்போதும் பயனுள்ள திட்டமிடல் தேவைப்படுகிறது. இருப்பினும், அதன் கடந்தகால செயல்திறன் மற்றும் பிற தொடர்புடைய காரணிகளின் அடிப்படையில் மக்கள் சிறந்த திட்டங்களைத் தேர்ந்தெடுக்கலாம்; இந்த லம்ப்சம் கால்குலேட்டரின் உதவியால், மக்கள் தங்கள் முதலீடு ஒரு குறிப்பிட்ட காலத்தில் எப்படி வளர்கிறது என்பதை தீர்மானிக்க உதவுகிறது. முன்னர் குறிப்பிட்டபடி, இந்த கால்குலேட்டரின் உள்ளீட்டு கூறுகள் முதலீட்டின் காலம், முதலீடு செய்யப்பட்ட தொகை மற்றும் பிறவற்றை உள்ளடக்கியது. எனவே, கீழே கொடுக்கப்பட்டுள்ள உதாரணத்துடன் கணக்கீடு எவ்வாறு செயல்படுகிறது என்பதைப் பார்ப்போம்.
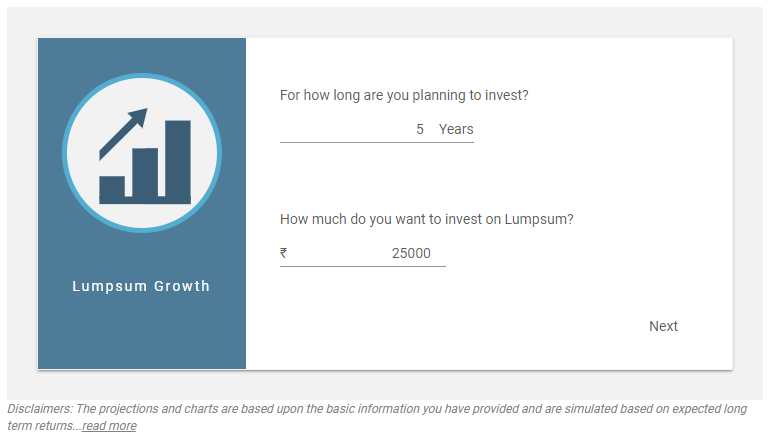
லம்ப்சம் முதலீட்டுத் தொகை: ₹25,000
முதலீட்டு காலம்: 5 ஆண்டுகள்
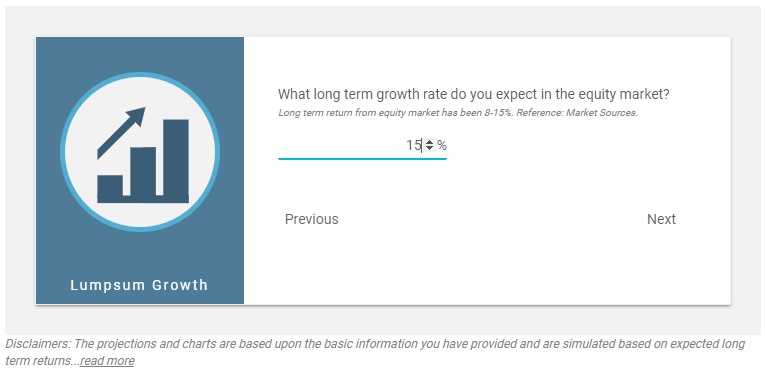
எதிர்பார்க்கப்படும் வருமானம் (%) (தோராயமாக): 15
எதிர்பார்க்கப்படும் பணவீக்கம் (%) (தோராயமாக): 5
1. உங்கள் லம்ப்சம் முதலீட்டுத் தொகை மற்றும் முதலீட்டு காலத்தை உள்ளிடவும்
நீங்கள் கேட்க வேண்டிய முதல் கேள்வி இதுதான், நான் எனது நோக்கத்தை அடைய எவ்வளவு தொகை முதலீடு செய்ய வேண்டும். அதனுடன், முதலீட்டின் காலத்தையும் குறிப்பிடவும். எனவே, சுமார் ₹25,000 மற்றும் 5 வருட பதவிக்காலம் குறிப்பிடப்பட்ட தொகையின் உதவியுடன், படம் பின்வருமாறு கொடுக்கப்பட்டுள்ளது. இங்கே, முதலீட்டுத் தொகை மற்றும் பதவிக்காலத்தை உள்ளிட்ட பிறகு, நீங்கள் கிளிக் செய்ய வேண்டும்அடுத்த பொத்தான் படத்தில் காட்டப்பட்டுள்ளபடி திரையின் அடிப்பகுதியில் உள்ளது.
2. உங்கள் முதலீட்டில் எதிர்பார்க்கப்படும் நீண்ட கால வளர்ச்சியை உள்ளிடவும்
நீங்கள் பதிலளிக்க வேண்டிய இரண்டாவது கேள்வி இது. இங்கே, நீங்கள் லம்ப்சம் முதலீட்டில் எதிர்பார்க்கப்படும் வருமான விகிதத்தை உள்ளிட வேண்டும். எடுத்துக்காட்டாக, இந்த வழக்கில் வருமான விகிதம் 15% என்று வைத்துக்கொள்வோம். அதற்கான படம் பின்வருமாறு பட்டியலிடப்பட்டுள்ளது. எதிர்பார்க்கப்படும் வருமான விகிதத்தை உள்ளிட்ட பிறகு, நீங்கள் கிளிக் செய்ய வேண்டும்அடுத்த பொத்தான் இது கீழே கொடுக்கப்பட்டுள்ளபடி உள்ளது.
3. பணவீக்கத்தை சரிசெய்யவும்
எதிர்பார்க்கப்படும் வருமானத்தின் சதவீதத்தை உள்ளிட்டு, அடுத்து என்பதைக் கிளிக் செய்தால், முடிவைப் பெறுவீர்கள். இங்கே, நீங்கள் அருகிலுள்ள பெட்டியைத் தேர்ந்தெடுக்க வேண்டும்பணவீக்கத்தை சரிசெய்யவும் மற்றும் நீண்ட கால பணவீக்க விகிதத்தை உள்ளிடவும். எங்கள் எடுத்துக்காட்டில், பணவீக்க விகிதத்தை 5% ஆகக் கொண்டுள்ளோம். நீங்கள் பணவீக்க விகிதத்தை உள்ளிட்டவுடன்; நீங்கள் முதலீட்டு மதிப்பு. இந்த படிநிலைக்கான படம் பின்வருமாறு.
4. முடிவு முடிவு
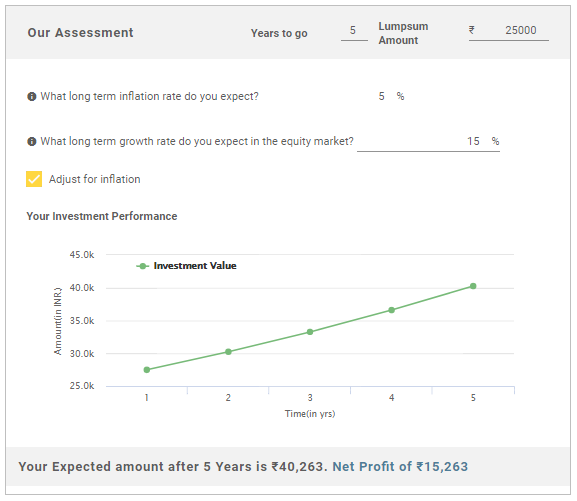
எனவே, ஐந்தாம் ஆண்டு முடிவில், முதலீட்டின் நிகர லாபம் ₹15,263 என்றும் மொத்த முதலீட்டு மதிப்பு ₹40,263 என்றும் முடிவு செய்யலாம்.
எனவே, மேலே குறிப்பிட்டுள்ள படிகளிலிருந்து, Fincash Lumpsum கால்குலேட்டரைப் பயன்படுத்துவது எளிது என்பதைக் காணலாம்.
மேலும் கேள்விகள் இருந்தால், எங்கள் வாடிக்கையாளர் பராமரிப்பு துறையை தொடர்பு கொள்ளலாம்.
2022க்கான சிறந்த நிதிகள்
* 3 ஆண்டு செயல்திறன் அடிப்படையில் சிறந்த நிதி.
"The primary investment objective of the Scheme is to seek capital appreciation by investing predominantly in units of MLIIF - WGF. The Scheme may, at the discretion of the Investment Manager, also invest in the units of other similar overseas mutual fund schemes, which may constitute a significant part of its corpus. The Scheme may also invest a certain portion of its corpus in money market securities and/or units of money market/liquid schemes of DSP Merrill Lynch Mutual Fund, in order to meet liquidity requirements from time to time. However, there is no assurance that the investment objective of the Scheme will be realized." Below is the key information for DSP World Gold Fund Returns up to 1 year are on The primary investment objective of the Scheme is to seek capital appreciation by investing predominantly in units of BGF – USFEF. The Scheme may, at the discretion of the Investment Manager also invest in the units of other similar overseas mutual fund schemes, which may constitute a significant part of its corpus. The Scheme may also invest a certain portion of its corpus in money market securities and/or money market/liquid schemes of DSP BlackRock Mutual Fund, in order to meet liquidity requirements from time to time. However, there is no assurance that the investment objective of the Scheme will be realized. It shall be noted ‘similar overseas mutual fund schemes’ shall have investment objective, investment strategy and risk profile/consideration similar to those of BGF – USFEF. Research Highlights for DSP US Flexible Equity Fund Below is the key information for DSP US Flexible Equity Fund Returns up to 1 year are on (Erstwhile UTI Pharma & Healthcare Fund) The Investment objective of the Scheme is capital appreciation through investments in equities and equity related instruments of the Pharma & Healthcare sectors. Research Highlights for UTI Healthcare Fund Below is the key information for UTI Healthcare Fund Returns up to 1 year are on 1. DSP World Gold Fund
DSP World Gold Fund
Growth Launch Date 14 Sep 07 NAV (15 Jul 26) ₹49.6706 ↓ -0.65 (-1.29 %) Net Assets (Cr) ₹1,679 on 31 May 26 Category Equity - Global AMC DSP BlackRock Invmt Managers Pvt. Ltd. Rating ☆☆☆ Risk High Expense Ratio 1.41 Sharpe Ratio 1.77 Information Ratio -0.78 Alpha Ratio -0.46 Min Investment 1,000 Min SIP Investment 500 Exit Load 0-12 Months (1%),12 Months and above(NIL) Growth of 10,000 investment over the years.
Date Value 30 Jun 21 ₹10,000 30 Jun 22 ₹8,181 30 Jun 23 ₹9,294 30 Jun 24 ₹10,640 30 Jun 25 ₹16,808 30 Jun 26 ₹27,693 Returns for DSP World Gold Fund
absolute basis & more than 1 year are on CAGR (Compound Annual Growth Rate) basis. as on 15 Jul 26 Duration Returns 1 Month -11.6% 3 Month -21.9% 6 Month -16.1% 1 Year 63.3% 3 Year 40.7% 5 Year 21.9% 10 Year 15 Year Since launch 8.9% Historical performance (Yearly) on absolute basis
Year Returns 2025 167.1% 2024 15.9% 2023 7% 2022 -7.7% 2021 -9% 2020 31.4% 2019 35.1% 2018 -10.7% 2017 -4% 2016 52.7% Fund Manager information for DSP World Gold Fund
Name Since Tenure Kaivalya Nadkarni 1 May 25 1.17 Yr. Data below for DSP World Gold Fund as on 31 May 26
Equity Sector Allocation
Sector Value Basic Materials 94.47% Asset Allocation
Asset Class Value Cash 3.62% Equity 94.47% Debt 0% Other 1.91% Top Securities Holdings / Portfolio
Name Holding Value Quantity BGF World Gold I2
Investment Fund | -68% ₹1,141 Cr 1,005,044 VanEck Gold Miners ETF
- | GDX29% ₹490 Cr 573,719 Treps / Reverse Repo Investments
CBLO/Reverse Repo | -3% ₹54 Cr Net Receivables/Payables
Net Current Assets | -0% -₹6 Cr 2. DSP US Flexible Equity Fund
DSP US Flexible Equity Fund
Growth Launch Date 3 Aug 12 NAV (15 Jul 26) ₹94.2682 ↓ -0.06 (-0.07 %) Net Assets (Cr) ₹1,323 on 31 May 26 Category Equity - Global AMC DSP BlackRock Invmt Managers Pvt. Ltd. Rating ☆☆☆☆☆ Risk High Expense Ratio 1.55 Sharpe Ratio 2.57 Information Ratio 0.13 Alpha Ratio -3.23 Min Investment 1,000 Min SIP Investment 500 Exit Load 0-12 Months (1%),12 Months and above(NIL) Growth of 10,000 investment over the years.
Date Value 30 Jun 21 ₹10,000 30 Jun 22 ₹9,273 30 Jun 23 ₹11,265 30 Jun 24 ₹13,557 30 Jun 25 ₹15,785 30 Jun 26 ₹23,371 Returns for DSP US Flexible Equity Fund
absolute basis & more than 1 year are on CAGR (Compound Annual Growth Rate) basis. as on 15 Jul 26 Duration Returns 1 Month 0.4% 3 Month 12.4% 6 Month 20.9% 1 Year 48.3% 3 Year 27% 5 Year 18.3% 10 Year 15 Year Since launch 17.5% Historical performance (Yearly) on absolute basis
Year Returns 2025 33.8% 2024 17.8% 2023 22% 2022 -5.9% 2021 24.2% 2020 22.6% 2019 27.5% 2018 -1.1% 2017 15.5% 2016 9.8% Fund Manager information for DSP US Flexible Equity Fund
Name Since Tenure Kaivalya Nadkarni 1 May 25 1.17 Yr. Data below for DSP US Flexible Equity Fund as on 31 May 26
Equity Sector Allocation
Sector Value Technology 33.05% Industrials 13.62% Financial Services 12.17% Communication Services 12.05% Consumer Cyclical 9.62% Health Care 7.65% Basic Materials 2.45% Energy 2.43% Asset Allocation
Asset Class Value Cash 6.96% Equity 93.02% Debt 0.01% Top Securities Holdings / Portfolio
Name Holding Value Quantity BGF US Flexible Equity I2
Investment Fund | -96% ₹1,265 Cr 1,784,131
↓ -32,921 Treps / Reverse Repo Investments
CBLO/Reverse Repo | -4% ₹59 Cr Net Receivables/Payables
Net Current Assets | -0% -₹2 Cr 3. UTI Healthcare Fund
UTI Healthcare Fund
Growth Launch Date 28 Jun 99 NAV (16 Jul 26) ₹335.106 ↑ 1.17 (0.35 %) Net Assets (Cr) ₹1,217 on 31 May 26 Category Equity - Sectoral AMC UTI Asset Management Company Ltd Rating ☆ Risk High Expense Ratio 2.26 Sharpe Ratio 0.42 Information Ratio 0.08 Alpha Ratio 0.91 Min Investment 5,000 Min SIP Investment 500 Exit Load 0-1 Years (1%),1 Years and above(NIL) Growth of 10,000 investment over the years.
Date Value 30 Jun 21 ₹10,000 30 Jun 22 ₹8,478 30 Jun 23 ₹10,006 30 Jun 24 ₹14,264 30 Jun 25 ₹17,337 30 Jun 26 ₹19,764 Returns for UTI Healthcare Fund
absolute basis & more than 1 year are on CAGR (Compound Annual Growth Rate) basis. as on 15 Jul 26 Duration Returns 1 Month 7.2% 3 Month 17.5% 6 Month 19% 1 Year 13.6% 3 Year 25.8% 5 Year 14.6% 10 Year 15 Year Since launch 15% Historical performance (Yearly) on absolute basis
Year Returns 2025 -3.1% 2024 42.9% 2023 38.2% 2022 -12.3% 2021 19.1% 2020 67.4% 2019 1.2% 2018 -7.5% 2017 6.2% 2016 -9.7% Fund Manager information for UTI Healthcare Fund
Name Since Tenure Kamal Gada 2 May 22 4.17 Yr. Data below for UTI Healthcare Fund as on 31 May 26
Equity Sector Allocation
Sector Value Health Care 94.45% Asset Allocation
Asset Class Value Cash 5.55% Equity 94.45% Top Securities Holdings / Portfolio
Name Holding Value Quantity Sun Pharmaceuticals Industries Ltd (Healthcare)
Equity, Since 31 Oct 06 | SUNPHARMA9% ₹108 Cr 600,000 Divi's Laboratories Ltd (Healthcare)
Equity, Since 30 Sep 17 | DIVISLAB5% ₹59 Cr 88,814
↑ 28,076 Ajanta Pharma Ltd (Healthcare)
Equity, Since 31 Jul 17 | AJANTPHARM5% ₹57 Cr 195,295
↓ -41,216 Gland Pharma Ltd (Healthcare)
Equity, Since 30 Nov 20 | GLAND4% ₹48 Cr 215,251 Lupin Ltd (Healthcare)
Equity, Since 28 Feb 25 | LUPIN4% ₹46 Cr 203,834
↓ -6,166 Apollo Hospitals Enterprise Ltd (Healthcare)
Equity, Since 30 Apr 21 | APOLLOHOSP4% ₹43 Cr 53,000 Dr Reddy's Laboratories Ltd (Healthcare)
Equity, Since 28 Feb 18 | DRREDDY3% ₹38 Cr 290,000 Caplin Point Laboratories Ltd (Healthcare)
Equity, Since 31 Dec 23 | CAPLIPOINT3% ₹37 Cr 185,000
↑ 39,847 Alkem Laboratories Ltd (Healthcare)
Equity, Since 31 May 21 | ALKEM3% ₹37 Cr 68,000 Fortis Healthcare Ltd (Healthcare)
Equity, Since 31 Dec 20 | FORTIS3% ₹37 Cr 400,000
இங்கு வழங்கப்பட்ட தகவல்கள் துல்லியமானவை என்பதை உறுதிப்படுத்த அனைத்து முயற்சிகளும் மேற்கொள்ளப்பட்டுள்ளன. இருப்பினும், தரவுகளின் சரியான தன்மை குறித்து எந்த உத்தரவாதமும் அளிக்கப்படவில்லை. முதலீடு செய்வதற்கு முன் திட்டத் தகவல் ஆவணத்துடன் சரிபார்க்கவும்.


AMFI Registration No. 112358 | CIN: U74999MH2016PTC282153
Shepard Technologies Pvt. Ltd. (with ARN code 112358) makes no warranties or representations, express or implied, on products offered through the platform. It accepts no liability for any damages or losses, however caused, in connection with the use of, or on the reliance of its product or related services. Terms and conditions of the website are applicable.
©2026 Shepard Technologies Private Limited. All Rights Reserved
Research Highlights for DSP World Gold Fund