অ্যাক্সিস ব্যাঙ্কে এসআইপি লেনদেনের জন্য বিলার কীভাবে যোগ করবেন?
জন্যচুমুক বা পদ্ধতিগতবিনিয়োগ পরিকল্পনা, অল্প পরিমাণ নিয়মিত বিরতিতে কাটা হয় এবং মিউচুয়াল ফান্ড স্কিমে জমা করা হয়। যেহেতু এসআইপি-তে লেনদেনটি নিয়মিত বিরতিতে বিনিয়োগ করা হয়, তাই ব্যক্তিরা তাদের প্রথম লেনদেনের পরে এসআইপি অর্থপ্রদানের জন্য বিলার যোগ করতে পারেন যাতে পরে স্বয়ংক্রিয়ভাবে অর্থ কেটে যায়।
একবার প্রাথমিক অর্থ প্রদান করা হয়ে গেলে, লোকেরা একটি অনন্য নিবন্ধন নম্বর (ইউআরএন) পায় যা তাদের নিজ নিজ বিলারদের সাথে যোগ করতে হবে যাতে তাদের এসআইপি কিস্তি নিজেই সম্পন্ন হয়। শুধুমাত্র আপনার অ্যাকাউন্টে পর্যাপ্ত তহবিল আছে তা নিশ্চিত করুন।
তাহলে, আসুন দেখি কিভাবে Axis-এ SIP লেনদেনের জন্য Biller যোগ করা যায়ব্যাংক. Axis Bank-এর ক্ষেত্রে বিলার যোগ করার প্রক্রিয়ায় চারটি ধাপ রয়েছে। চিত্র সহ এই পদক্ষেপগুলি নিম্নরূপ ব্যাখ্যা করা হয়েছে।
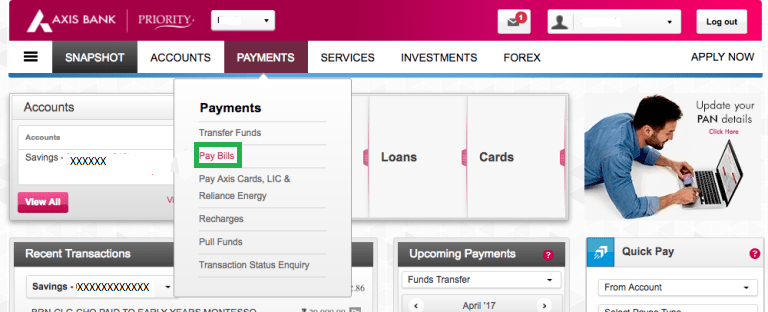
অ্যাক্সিস ব্যাঙ্ক অ্যাকাউন্টে লগ ইন করুন এবং বিল পরিশোধ করতে যান
বিলার যোগ করার সময় এটি প্রথম ধাপ। ব্যক্তিদের প্রথমে তাদের Axis Bank অ্যাকাউন্টে লগ ইন করতে হবে। একবার তারা লগ ইন করলে, তাদের ক্লিক করতে হবেপেমেন্ট ট্যাব যা স্ক্রিনের শীর্ষে রয়েছে। চালুপেমেন্ট ট্যাব, আপনাকে নির্বাচন করতে হবেবিল পরিশোধ বিকল্প
এই ধাপের চিত্রটি নীচে দেওয়া হয়েছে যেখানে পে বিল বিকল্পটি সবুজ রঙে হাইলাইট করা হয়েছে।
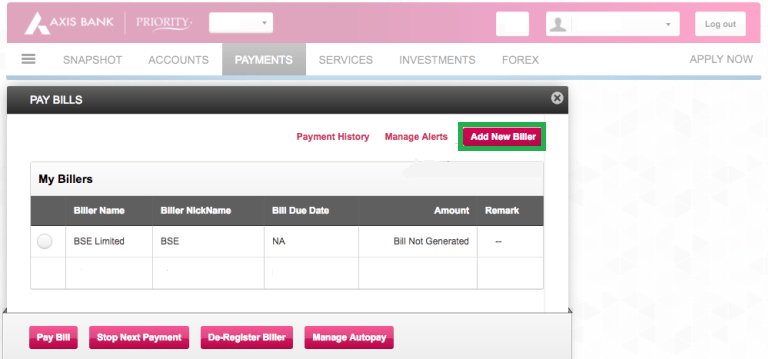
নতুন বিলার যোগ করুন বিকল্প নির্বাচন করুন
একবার আপনি ক্লিক করুনবিল পরিশোধ বিকল্প; একটি নতুন পর্দা পপ আউট. এখানে, আপনাকে নির্বাচন করতে হবেবিলার যোগ করুন বিকল্প। এই ধাপের জন্য চিত্রটি নীচে দেওয়া হয়েছে যেখানে বিলার যোগ করুন বোতামটি সবুজ রঙে হাইলাইট করা হয়েছে।
বিলার যোগ করুন
একবার আপনি ক্লিক করুনবিলার যোগ করুন বিভাগে, একটি নতুন উইন্ডো খোলে যেখানে; আপনি বাম দিকে বিভিন্ন বিকল্প দেখতে পারেন পেতে. এখানে, আপনাকে নির্বাচন করতে হবেযৌথ পুঁজি আইকন নির্বাচন করার পরযৌথ পুঁজি বিকল্প, একটি ড্রপ-ডাউন বিবৃতিকোম্পানি নির্বাচন করুন সক্রিয় হয় যেখানে আপনাকে নির্বাচন করতে হবেবিএসই লিমিটেড. এই ধাপের জন্য চিত্রটি নীচে দেওয়া হয়েছে যেখানে; মিউচুয়াল ফান্ড এবং বিএসই লিমিটেড সবুজ রঙে হাইলাইট করা হয়েছে।

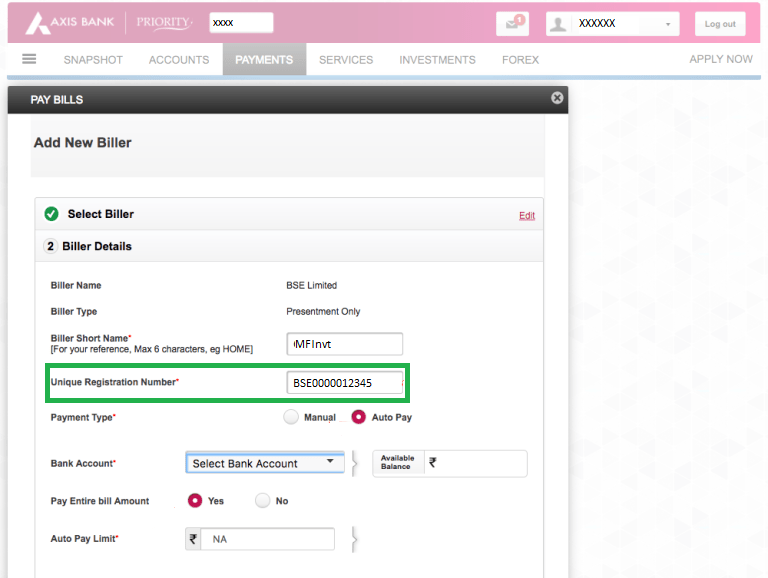
URN যোগ করুন এবং অন্যান্য বিবরণ পূরণ করুন
Axis Bank-এ SIP পেমেন্টের জন্য বিলার যোগ করার প্রক্রিয়ার এটি একটি গুরুত্বপূর্ণ ধাপ। একবার আপনি নির্বাচন করুনবিএসই লিমিটেড এবং প্রবেশ করুন, একটি নতুন স্ক্রীন খোলে যেখানে আপনাকে আপনার প্রবেশ করতে হবেSIP এর জন্য URN নম্বর. আগেই উল্লিখিত হিসাবে, গ্রাহকরা তাদের URN পাবেন একবার তারা fincash.com থেকে ইমেলের মাধ্যমে প্রাথমিক এসআইপি অর্থপ্রদান করে। যদি আপনি ইমেল না পান তবে আপনি ভিজিট করে ইউআরএন পেতে পারেনআমার SIPs বিভাগ এর ওয়েবসাইটেFincash.com. পাশাপাশি, URN নম্বরের সাথে তাদের অন্যান্য বিকল্প যেমন যোগ করতে হবেশোধের ধরণ,ব্যাংক একাউন্ট নম্বর,পুরো বিলের পরিমাণ পরিশোধ করবেন কিনা, এবং অন্যান্য বিকল্প। সমস্ত প্রয়োজনীয় কলাম পূরণ এবং ফর্ম জমা দেওয়ার পরে, আপনি আপনার বিলার নিশ্চিতকরণ পাবেন। এই ধাপের জন্য এই চিত্রগুলি নীচে দেওয়া হয়েছে যেখানে URN বক্সটি সবুজ রঙে হাইলাইট করা হয়েছে।
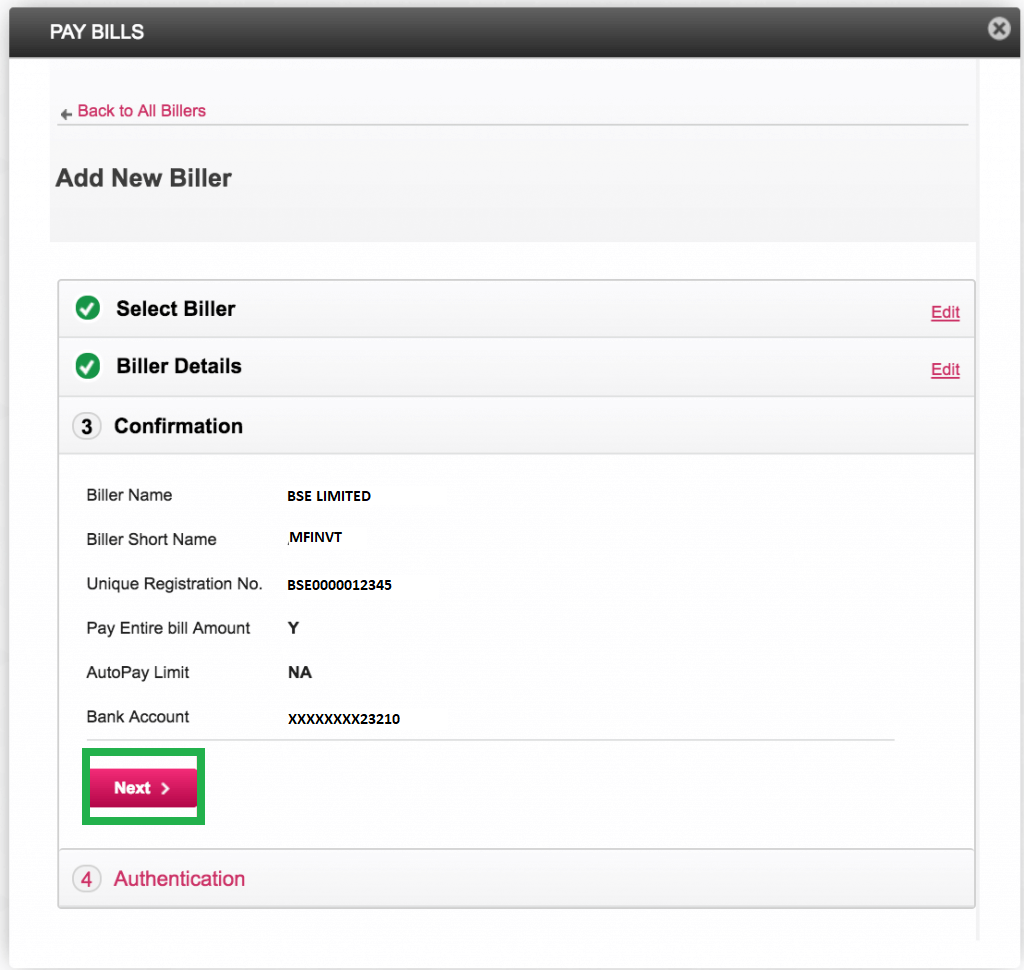
প্রবেশ করা বিবরণ যাচাই করুন
একবার আপনি ক্লিক করুনপরবর্তী পূর্ববর্তী ধাপে, একটি নতুন স্ক্রীন খোলে যেখানে আপনি প্রবেশ করা বিশদ যাচাই করতে পারবেন। একবার আপনি চেক এবং সমস্ত বিবরণ যাচাই, তারপর আপনি ক্লিক করতে হবেপরবর্তী স্ক্রিনের নীচে বোতাম। এই ধাপের চিত্রটি নীচে দেওয়া হয়েছে যেখানে নেক্সট বোতামটি সবুজ রঙে হাইলাইট করা হয়েছে।
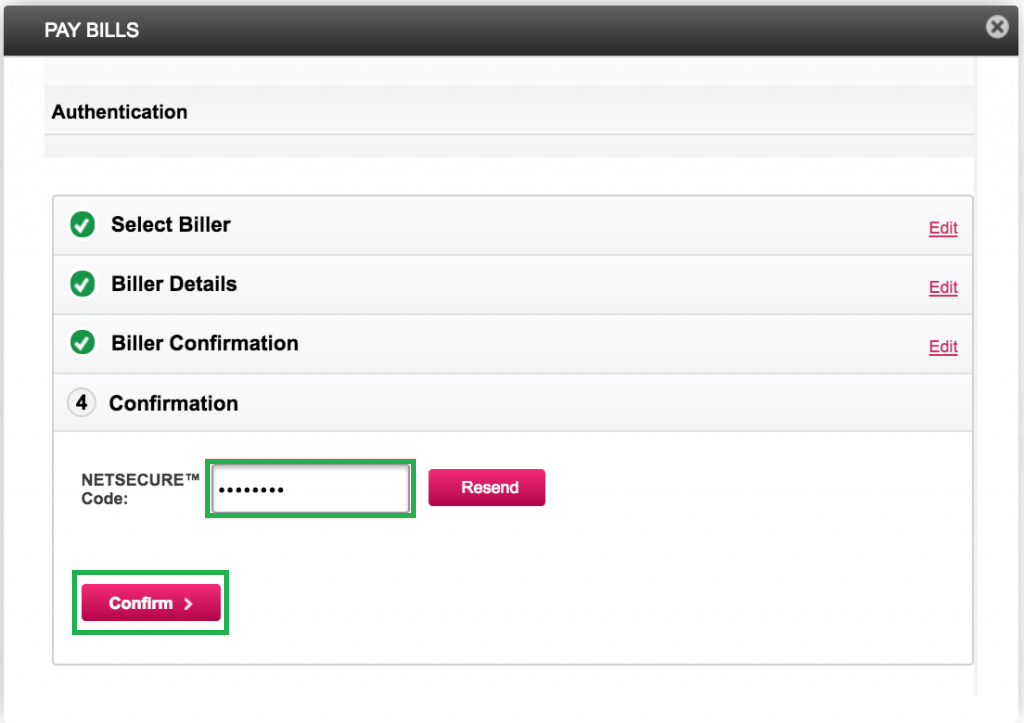
OTP লিখুন
একবার আপনি ক্লিক করুনপরবর্তী পূর্ববর্তী ধাপে বোতাম, আপনাকে একটি নতুন পৃষ্ঠায় পুনঃনির্দেশিত করা হবে যেখানে আপনাকে আপনার প্রবেশ করতে হবেOTP বা NETSECURE কোড. আপনি আপনার নিবন্ধিত মোবাইল নম্বর বা আপনার নিবন্ধিত ইমেল ঠিকানায় এই কোডটি পাবেন। একবার আপনি এই কোডটি প্রবেশ করান, আপনাকে ক্লিক করতে হবেনিশ্চিত করুন স্ক্রিনের নীচে বোতাম। এই স্ক্রিনের চিত্রটি নীচে দেওয়া হয়েছে যেখানে NETSECURE কোড বক্স এবং নিশ্চিত করুন বোতাম উভয়ই সবুজ রঙে হাইলাইট করা হয়েছে।
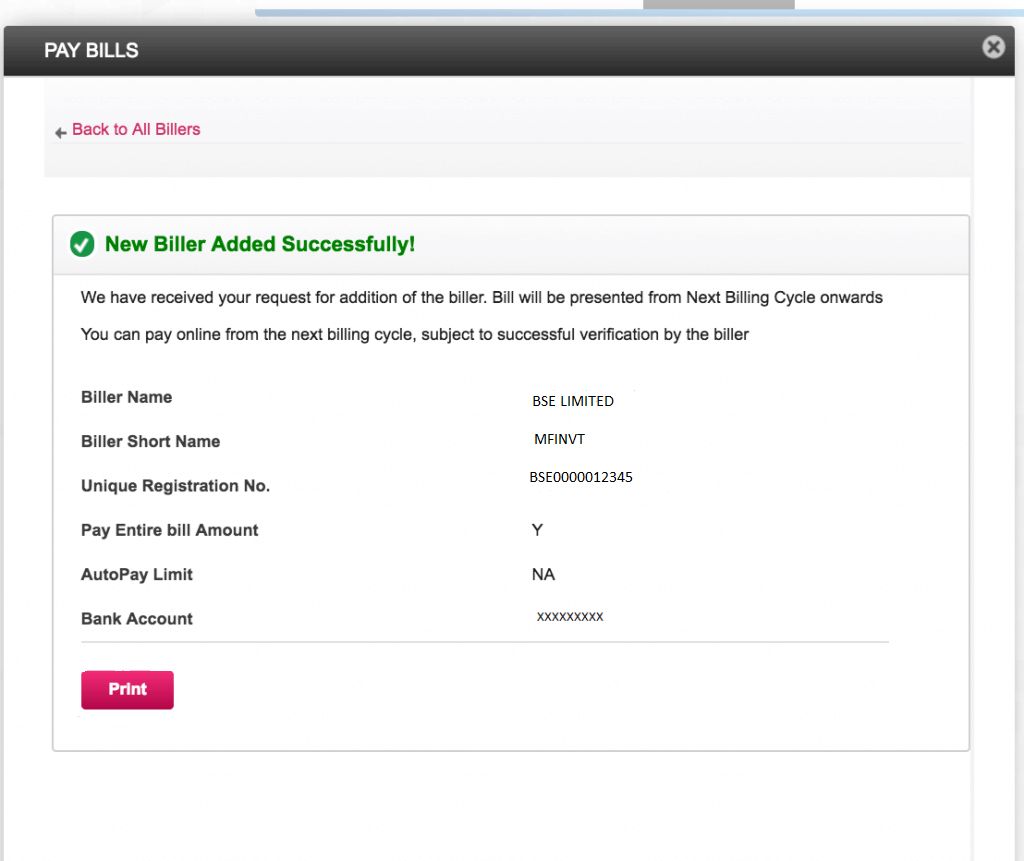
চূড়ান্ত নিশ্চিতকরণ
এই ধাপে আপনি চূড়ান্ত নিশ্চিতকরণ পাবেন যে বিলার সফলভাবে যোগ করা হয়েছে। এটি Axis Bank-এর বিলার সংযোজন প্রক্রিয়ার চূড়ান্ত ধাপ। ব্যক্তি, যদি প্রয়োজন হয়, এই পদক্ষেপের একটি প্রিন্ট নিতে পারেন এবং তাদের নিশ্চিতকরণের জন্য রাখতে পারেন। এই ধাপের জন্য চিত্রটি নীচে দেওয়া হল।
এইভাবে, উপরে উল্লিখিত পদক্ষেপগুলি থেকে, আমরা বলতে পারি যে SIP পেমেন্টের জন্য Axis Bank-এ একজন বিলার যোগ করা সহজ।
ভাল রিটার্নের জন্য বিনিয়োগের জন্য সেরা এসআইপি
এখানে কিছু সুপারিশকৃত এসআইপি রয়েছে5 বছর এর থেকে বেশি রিটার্ন এবং AUMINR 500 কোটি:
Fund NAV Net Assets (Cr) Min SIP Investment 3 MO (%) 6 MO (%) 1 YR (%) 3 YR (%) 5 YR (%) 2025 (%) DSP World Gold Fund Growth ₹50.5929
↑ 0.21 ₹1,433 500 -16.1 -23.5 60.9 43.8 23.4 167.1 SBI PSU Fund Growth ₹33.9945
↓ -0.30 ₹6,684 500 -6.9 -2.5 8.1 22.5 23 11.3 ICICI Prudential Infrastructure Fund Growth ₹200.44
↓ -1.19 ₹8,550 100 -0.8 5.4 3.7 18.6 22.9 6.7 SBI Gold Fund Growth ₹41.1608
↓ -0.63 ₹15,294 500 -4.8 -14 42.4 32 22.9 71.5 IDBI Gold Fund Growth ₹36.5397
↓ -0.39 ₹757 500 -4.6 -13.3 42 31.9 22.8 79 Note: Returns up to 1 year are on absolute basis & more than 1 year are on CAGR basis. as on 27 Jul 26 Research Highlights & Commentary of 5 Funds showcased
Commentary DSP World Gold Fund SBI PSU Fund ICICI Prudential Infrastructure Fund SBI Gold Fund IDBI Gold Fund Point 1 Bottom quartile AUM (₹1,433 Cr). Lower mid AUM (₹6,684 Cr). Upper mid AUM (₹8,550 Cr). Highest AUM (₹15,294 Cr). Bottom quartile AUM (₹757 Cr). Point 2 Established history (18+ yrs). Established history (16+ yrs). Oldest track record among peers (20 yrs). Established history (14+ yrs). Established history (13+ yrs). Point 3 Top rated. Rating: 2★ (lower mid). Rating: 3★ (upper mid). Rating: 2★ (bottom quartile). Not Rated. Point 4 Risk profile: High. Risk profile: High. Risk profile: High. Risk profile: Moderately High. Risk profile: Moderately High. Point 5 5Y return: 23.36% (top quartile). 5Y return: 22.96% (upper mid). 5Y return: 22.92% (lower mid). 5Y return: 22.91% (bottom quartile). 5Y return: 22.81% (bottom quartile). Point 6 3Y return: 43.83% (top quartile). 3Y return: 22.52% (bottom quartile). 3Y return: 18.59% (bottom quartile). 3Y return: 31.97% (upper mid). 3Y return: 31.95% (lower mid). Point 7 1Y return: 60.94% (top quartile). 1Y return: 8.08% (bottom quartile). 1Y return: 3.73% (bottom quartile). 1Y return: 42.42% (upper mid). 1Y return: 42.03% (lower mid). Point 8 Alpha: 2.12 (top quartile). Alpha: -0.30 (bottom quartile). Alpha: 0.00 (upper mid). 1M return: 1.80% (upper mid). 1M return: 1.45% (lower mid). Point 9 Sharpe: 1.22 (lower mid). Sharpe: 0.12 (bottom quartile). Sharpe: -0.07 (bottom quartile). Alpha: 0.00 (lower mid). Alpha: 0.00 (bottom quartile). Point 10 Information ratio: -0.50 (bottom quartile). Information ratio: -0.11 (bottom quartile). Information ratio: 0.00 (top quartile). Sharpe: 1.29 (top quartile). Sharpe: 1.22 (upper mid). DSP World Gold Fund
SBI PSU Fund
ICICI Prudential Infrastructure Fund
SBI Gold Fund
IDBI Gold Fund
"The primary investment objective of the Scheme is to seek capital appreciation by investing predominantly in units of MLIIF - WGF. The Scheme may, at the discretion of the Investment Manager, also invest in the units of other similar overseas mutual fund schemes, which may constitute a significant part of its corpus. The Scheme may also invest a certain portion of its corpus in money market securities and/or units of money market/liquid schemes of DSP Merrill Lynch Mutual Fund, in order to meet liquidity requirements from time to time. However, there is no assurance that the investment objective of the Scheme will be realized." Below is the key information for DSP World Gold Fund Returns up to 1 year are on The objective of the scheme would be to provide investors with opportunities for long-term growth in capital along with the liquidity of an open-ended scheme through an active management of investments in a diversified basket of equity stocks of domestic Public Sector Undertakings and in debt and money market instruments issued by PSUs AND others. Research Highlights for SBI PSU Fund Below is the key information for SBI PSU Fund Returns up to 1 year are on To generate capital appreciation and income distribution to unit holders by investing predominantly in equity/equity related securities of the companies belonging to the infrastructure development and balance in debt securities and money market instruments. Research Highlights for ICICI Prudential Infrastructure Fund Below is the key information for ICICI Prudential Infrastructure Fund Returns up to 1 year are on The scheme seeks to provide returns that closely correspond to returns provided by SBI - ETF Gold (Previously known as SBI GETS). Research Highlights for SBI Gold Fund Below is the key information for SBI Gold Fund Returns up to 1 year are on The investment objective of the Scheme will be to generate returns that correspond closely to the returns generated by IDBI Gold Exchange Traded Fund (IDBI GOLD ETF). Research Highlights for IDBI Gold Fund Below is the key information for IDBI Gold Fund Returns up to 1 year are on 1. DSP World Gold Fund
DSP World Gold Fund
Growth Launch Date 14 Sep 07 NAV (27 Jul 26) ₹50.5929 ↑ 0.21 (0.42 %) Net Assets (Cr) ₹1,433 on 30 Jun 26 Category Equity - Global AMC DSP BlackRock Invmt Managers Pvt. Ltd. Rating ☆☆☆ Risk High Expense Ratio 1.41 Sharpe Ratio 1.22 Information Ratio -0.5 Alpha Ratio 2.12 Min Investment 1,000 Min SIP Investment 500 Exit Load 0-12 Months (1%),12 Months and above(NIL) Growth of 10,000 investment over the years.
Date Value 30 Jun 21 ₹10,000 30 Jun 22 ₹8,181 30 Jun 23 ₹9,294 30 Jun 24 ₹10,640 30 Jun 25 ₹16,808 30 Jun 26 ₹27,693 Returns for DSP World Gold Fund
absolute basis & more than 1 year are on CAGR (Compound Annual Growth Rate) basis. as on 27 Jul 26 Duration Returns 1 Month 2.9% 3 Month -16.1% 6 Month -23.5% 1 Year 60.9% 3 Year 43.8% 5 Year 23.4% 10 Year 15 Year Since launch 9% Historical performance (Yearly) on absolute basis
Year Returns 2025 167.1% 2024 15.9% 2023 7% 2022 -7.7% 2021 -9% 2020 31.4% 2019 35.1% 2018 -10.7% 2017 -4% 2016 52.7% Fund Manager information for DSP World Gold Fund
Name Since Tenure Kaivalya Nadkarni 1 May 25 1.17 Yr. Data below for DSP World Gold Fund as on 30 Jun 26
Equity Sector Allocation
Sector Value Basic Materials 94.47% Asset Allocation
Asset Class Value Cash 3.62% Equity 94.47% Debt 0% Other 1.91% Top Securities Holdings / Portfolio
Name Holding Value Quantity BGF World Gold I2
Investment Fund | -68% ₹1,141 Cr 1,005,044 VanEck Gold Miners ETF
- | GDX29% ₹490 Cr 573,719 Treps / Reverse Repo Investments
CBLO/Reverse Repo | -3% ₹54 Cr Net Receivables/Payables
Net Current Assets | -0% -₹6 Cr 2. SBI PSU Fund
SBI PSU Fund
Growth Launch Date 7 Jul 10 NAV (28 Jul 26) ₹33.9945 ↓ -0.30 (-0.88 %) Net Assets (Cr) ₹6,684 on 30 Jun 26 Category Equity - Sectoral AMC SBI Funds Management Private Limited Rating ☆☆ Risk High Expense Ratio 1.89 Sharpe Ratio 0.12 Information Ratio -0.11 Alpha Ratio -0.3 Min Investment 5,000 Min SIP Investment 500 Exit Load 0-1 Years (1%),1 Years and above(NIL) Growth of 10,000 investment over the years.
Date Value 30 Jun 21 ₹10,000 30 Jun 22 ₹9,973 30 Jun 23 ₹13,609 30 Jun 24 ₹26,792 30 Jun 25 ₹26,602 30 Jun 26 ₹28,255 Returns for SBI PSU Fund
absolute basis & more than 1 year are on CAGR (Compound Annual Growth Rate) basis. as on 27 Jul 26 Duration Returns 1 Month -1.9% 3 Month -6.9% 6 Month -2.5% 1 Year 8.1% 3 Year 22.5% 5 Year 23% 10 Year 15 Year Since launch 7.9% Historical performance (Yearly) on absolute basis
Year Returns 2025 11.3% 2024 23.5% 2023 54% 2022 29% 2021 32.4% 2020 -10% 2019 6% 2018 -23.8% 2017 21.9% 2016 16.2% Fund Manager information for SBI PSU Fund
Name Since Tenure Rohit Shimpi 1 Jun 24 2.08 Yr. Data below for SBI PSU Fund as on 30 Jun 26
Equity Sector Allocation
Sector Value Financial Services 32.54% Utility 31.22% Industrials 14.07% Energy 11.97% Basic Materials 6.94% Asset Allocation
Asset Class Value Cash 3.18% Equity 96.74% Debt 0.07% Top Securities Holdings / Portfolio
Name Holding Value Quantity State Bank of India (Financial Services)
Equity, Since 31 Jul 10 | SBIN17% ₹1,112 Cr 11,527,500
↑ 1,000,000 GAIL (India) Ltd (Utilities)
Equity, Since 31 May 24 | GAIL10% ₹628 Cr 38,150,000 NTPC Ltd (Utilities)
Equity, Since 31 Jul 10 | NTPC9% ₹597 Cr 15,443,244 Bharat Electronics Ltd (Industrials)
Equity, Since 30 Jun 24 | BEL9% ₹583 Cr 14,185,000
↑ 800,000 Power Grid Corp Of India Ltd (Utilities)
Equity, Since 31 Jul 10 | POWERGRID9% ₹579 Cr 19,935,554 Oil & Natural Gas Corp Ltd (Energy)
Equity, Since 31 May 20 | ONGC6% ₹389 Cr 14,655,000 Bank of Baroda (Financial Services)
Equity, Since 31 Aug 24 | BANKBARODA5% ₹352 Cr 13,100,000 Bharat Petroleum Corp Ltd (Energy)
Equity, Since 31 Aug 24 | BPCL4% ₹289 Cr 9,700,000 Bharat Heavy Electricals Ltd (Industrials)
Equity, Since 30 Jun 25 | BHEL4% ₹271 Cr 6,500,000 NMDC Ltd (Basic Materials)
Equity, Since 31 Oct 23 | NMDC4% ₹245 Cr 27,900,000 3. ICICI Prudential Infrastructure Fund
ICICI Prudential Infrastructure Fund
Growth Launch Date 31 Aug 05 NAV (28 Jul 26) ₹200.44 ↓ -1.19 (-0.59 %) Net Assets (Cr) ₹8,550 on 30 Jun 26 Category Equity - Sectoral AMC ICICI Prudential Asset Management Company Limited Rating ☆☆☆ Risk High Expense Ratio 1.89 Sharpe Ratio -0.07 Information Ratio 0 Alpha Ratio 0 Min Investment 5,000 Min SIP Investment 100 Exit Load 0-1 Years (1%),1 Years and above(NIL) Growth of 10,000 investment over the years.
Date Value 30 Jun 21 ₹10,000 30 Jun 22 ₹11,534 30 Jun 23 ₹16,346 30 Jun 24 ₹27,296 30 Jun 25 ₹28,743 30 Jun 26 ₹29,425 Returns for ICICI Prudential Infrastructure Fund
absolute basis & more than 1 year are on CAGR (Compound Annual Growth Rate) basis. as on 27 Jul 26 Duration Returns 1 Month -2.3% 3 Month -0.8% 6 Month 5.4% 1 Year 3.7% 3 Year 18.6% 5 Year 22.9% 10 Year 15 Year Since launch 15.4% Historical performance (Yearly) on absolute basis
Year Returns 2025 6.7% 2024 27.4% 2023 44.6% 2022 28.8% 2021 50.1% 2020 3.6% 2019 2.6% 2018 -14% 2017 40.8% 2016 2% Fund Manager information for ICICI Prudential Infrastructure Fund
Name Since Tenure Ihab Dalwai 3 Jun 17 9.08 Yr. Sharmila D’mello 30 Jun 22 4.01 Yr. Data below for ICICI Prudential Infrastructure Fund as on 30 Jun 26
Equity Sector Allocation
Sector Value Industrials 47.57% Financial Services 10.57% Utility 10.32% Basic Materials 9.74% Real Estate 8.09% Energy 5.04% Consumer Cyclical 1.98% Communication Services 0.09% Asset Allocation
Asset Class Value Cash 5.83% Equity 94.17% Top Securities Holdings / Portfolio
Name Holding Value Quantity InterGlobe Aviation Ltd (Industrials)
Equity, Since 28 Feb 23 | INDIGO9% ₹745 Cr 1,691,985
↑ 50,000 Larsen & Toubro Ltd (Industrials)
Equity, Since 30 Nov 09 | LT7% ₹614 Cr 1,505,704 Oberoi Realty Ltd (Real Estate)
Equity, Since 31 May 23 | OBEROIRLTY4% ₹365 Cr 2,139,426 Gujarat Energy Ltd (Utilities)
Equity, Since 31 Jan 23 | GUJGASLTD4% ₹340 Cr 8,482,024
↑ 156,557 NTPC Ltd (Utilities)
Equity, Since 29 Feb 16 | NTPC4% ₹334 Cr 8,626,448 Shree Cement Ltd (Basic Materials)
Equity, Since 30 Apr 24 | SHREECEM3% ₹270 Cr 106,892
↑ 3,387 Kalpataru Projects International Ltd (Industrials)
Equity, Since 30 Sep 06 | KPIL3% ₹262 Cr 2,005,608 AIA Engineering Ltd (Industrials)
Equity, Since 28 Feb 21 | AIAENG3% ₹258 Cr 572,697 HDFC Bank Ltd (Financial Services)
Equity, Since 31 Jan 22 | HDFCBANK3% ₹250 Cr 3,357,506
↑ 1,057,506 Container Corporation of India Ltd (Industrials)
Equity, Since 31 Jan 16 | CONCOR3% ₹227 Cr 4,885,153 4. SBI Gold Fund
SBI Gold Fund
Growth Launch Date 12 Sep 11 NAV (28 Jul 26) ₹41.1608 ↓ -0.63 (-1.50 %) Net Assets (Cr) ₹15,294 on 30 Jun 26 Category Gold - Gold AMC SBI Funds Management Private Limited Rating ☆☆ Risk Moderately High Expense Ratio 0.3 Sharpe Ratio 1.29 Information Ratio 0 Alpha Ratio 0 Min Investment 5,000 Min SIP Investment 500 Exit Load 0-1 Years (1%),1 Years and above(NIL) Growth of 10,000 investment over the years.
Date Value 30 Jun 21 ₹10,000 30 Jun 22 ₹10,828 30 Jun 23 ₹12,154 30 Jun 24 ₹14,949 30 Jun 25 ₹19,644 30 Jun 26 ₹28,455 Returns for SBI Gold Fund
absolute basis & more than 1 year are on CAGR (Compound Annual Growth Rate) basis. as on 27 Jul 26 Duration Returns 1 Month 1.8% 3 Month -4.8% 6 Month -14% 1 Year 42.4% 3 Year 32% 5 Year 22.9% 10 Year 15 Year Since launch 10% Historical performance (Yearly) on absolute basis
Year Returns 2025 71.5% 2024 19.6% 2023 14.1% 2022 12.6% 2021 -5.7% 2020 27.4% 2019 22.8% 2018 6.4% 2017 3.5% 2016 10% Fund Manager information for SBI Gold Fund
Name Since Tenure Viral Chhadva 1 Mar 26 0.33 Yr. Data below for SBI Gold Fund as on 30 Jun 26
Asset Allocation
Asset Class Value Cash 1.64% Other 98.36% Top Securities Holdings / Portfolio
Name Holding Value Quantity SBI Gold ETF
- | -100% ₹16,542 Cr 1,246,686,194
↑ 13,950,000 Net Receivable / Payable
CBLO | -0% -₹55 Cr Treps
CBLO/Reverse Repo | -0% ₹45 Cr 5. IDBI Gold Fund
IDBI Gold Fund
Growth Launch Date 14 Aug 12 NAV (28 Jul 26) ₹36.5397 ↓ -0.39 (-1.04 %) Net Assets (Cr) ₹757 on 30 Jun 26 Category Gold - Gold AMC IDBI Asset Management Limited Rating Risk Moderately High Expense Ratio 0.64 Sharpe Ratio 1.22 Information Ratio 0 Alpha Ratio 0 Min Investment 5,000 Min SIP Investment 500 Exit Load 0-12 Months (1%),12 Months and above(NIL) Growth of 10,000 investment over the years.
Date Value 30 Jun 21 ₹10,000 30 Jun 22 ₹10,739 30 Jun 23 ₹12,175 30 Jun 24 ₹14,979 30 Jun 25 ₹19,637 30 Jun 26 ₹28,198 Returns for IDBI Gold Fund
absolute basis & more than 1 year are on CAGR (Compound Annual Growth Rate) basis. as on 27 Jul 26 Duration Returns 1 Month 1.5% 3 Month -4.6% 6 Month -13.3% 1 Year 42% 3 Year 31.9% 5 Year 22.8% 10 Year 15 Year Since launch 9.7% Historical performance (Yearly) on absolute basis
Year Returns 2025 79% 2024 18.7% 2023 14.8% 2022 12% 2021 -4% 2020 24.2% 2019 21.6% 2018 5.8% 2017 1.4% 2016 8.3% Fund Manager information for IDBI Gold Fund
Name Since Tenure Sumit Bhatnagar 1 Jun 24 2.08 Yr. Data below for IDBI Gold Fund as on 30 Jun 26
Asset Allocation
Asset Class Value Cash 1.65% Other 98.35% Top Securities Holdings / Portfolio
Name Holding Value Quantity LIC MF Gold ETF
- | -100% ₹823 Cr 58,774,200
↑ 705,000 Treps
CBLO/Reverse Repo | -0% ₹3 Cr Net Receivables / (Payables)
CBLO | -0% -₹2 Cr
আরও কোনো প্রশ্নের ক্ষেত্রে, আপনি আমাদের সাথে 8451864111 নম্বরে যোগাযোগ করতে পারেন যে কোনো কার্যদিবসে সকাল 9.30 থেকে সন্ধ্যা 6.30 টার মধ্যে অথবা যে কোনো সময় আমাদের কাছে একটি মেইল লিখতে পারেনsupport@fincash.com অথবা আমাদের ওয়েবসাইটে লগইন করে আমাদের সাথে চ্যাট করুনwww.fincash.com.
এখানে প্রদত্ত তথ্য সঠিক কিনা তা নিশ্চিত করার জন্য সমস্ত প্রচেষ্টা করা হয়েছে। যাইহোক, তথ্যের সঠিকতা সম্পর্কে কোন গ্যারান্টি দেওয়া হয় না। কোনো বিনিয়োগ করার আগে স্কিমের তথ্য নথির সাথে যাচাই করুন।
")


AMFI Registration No. 112358 | CIN: U74999MH2016PTC282153
Shepard Technologies Pvt. Ltd. (with ARN code 112358) makes no warranties or representations, express or implied, on products offered through the platform. It accepts no liability for any damages or losses, however caused, in connection with the use of, or on the reliance of its product or related services. Terms and conditions of the website are applicable.
©2026 Shepard Technologies Private Limited. All Rights Reserved
Research Highlights for DSP World Gold Fund