ইউনিয়ন ব্যাঙ্ক অফ ইন্ডিয়াতে এসআইপি লেনদেনের জন্য বিলারকে কীভাবে যুক্ত করবেন?
মানুষ যারামিউচুয়াল ফান্ডে বিনিয়োগ করুন পছন্দ করতে পারচুমুক বা পদ্ধতিগতবিনিয়োগ পরিকল্পনা বিনিয়োগের একটি মোড হিসাবে। এই মোডে, লোকেদের তাদের লক্ষ্য অর্জনের জন্য স্কিমে নিয়মিত বিরতিতে অল্প পরিমাণ অর্থ প্রদান করতে হবে। SIP এর মাধ্যমে, লোকেরা নিশ্চিত করতে পারে যে তাদের বর্তমান বাজেট বাধাগ্রস্ত না হয় এবং তাদের উদ্দেশ্যগুলিও অর্জিত হয়। প্রযুক্তির অগ্রগতির সাথে, লোকেরা তাদের SIP এর মাধ্যমে করতে পারেনেট ব্যাঙ্কিং চ্যানেল
নেট ব্যাঙ্কিং বেছে নেওয়ার ক্ষেত্রে, ব্যক্তিরা তাদের প্রথম অর্থপ্রদানের পরে একটি অনন্য নিবন্ধন নম্বর বা URN পান। তাদের নেট ব্যাঙ্কিংয়ের মাধ্যমে বিলারের সাথে এই ইউআরএন যোগ করতে হবে যাতে তাদের ভবিষ্যতের এসআইপি পেমেন্ট স্বয়ংক্রিয় হয়ে যায়। শুধুমাত্র, আপনাকে নিশ্চিত করতে হবে যে সেখানে পর্যাপ্ত তহবিল রয়েছেব্যাংক অ্যাকাউন্ট নেট ব্যাঙ্কিংয়ে বিলার যোগ করার প্রক্রিয়া প্রতিটি ব্যাঙ্কের জন্য আলাদা। সুতরাং, আসুন আমরা ইউনিয়ন ব্যাঙ্ক অফ ইন্ডিয়ার ক্ষেত্রে এসআইপি লেনদেনের জন্য বিলার যোগ করার প্রক্রিয়াটি পরীক্ষা করি যা ছয়টি সহজ ধাপে করা যেতে পারে।
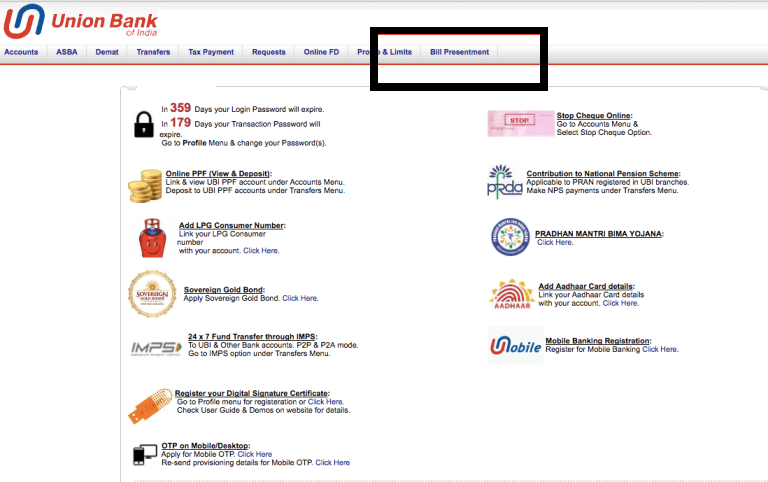
লগইন করুন এবং বিল উপস্থাপনা ট্যাব নির্বাচন করুন
এটি একটি বিলার যোগ করার ক্ষেত্রে প্রাথমিক পদক্ষেপ। প্রথমে, আপনাকে আপনার শংসাপত্রগুলি প্রবেশ করে আপনার নেট ব্যাঙ্কিংয়ে লগ ইন করতে হবে। একবার আপনি লগ ইন করলে, আপনি আপনার হোম স্ক্রীন দেখতে পাবেন। এখানে, স্ক্রিনের উপরে, আপনি বিভিন্ন ট্যাব দেখতে পাবেন যেমন অ্যাকাউন্ট, ডিম্যাট, স্থানান্তর এবং আরও অনেক কিছু। এর মধ্যে থেকে আপনাকে অন নির্বাচন করতে হবেবিল উপস্থাপনা ট্যাব এই ধাপের চিত্রটি নীচে দেওয়া হয়েছে যেখানে বিল প্রেজেন্টমেন্ট ট্যাবটি কালো রঙে হাইলাইট করা হয়েছে।
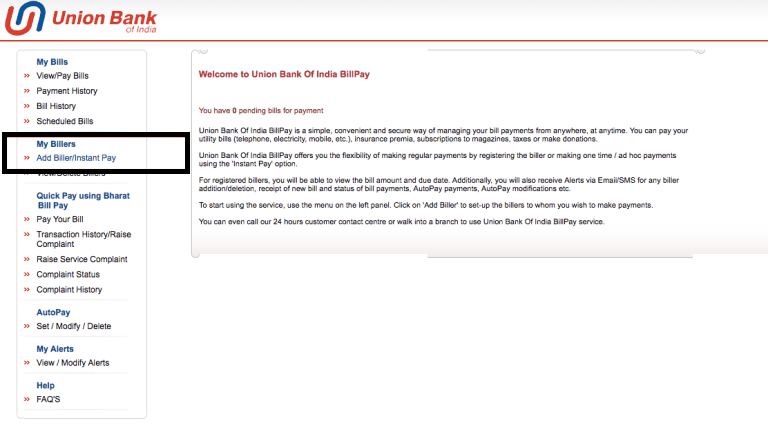
বিলার/তাত্ক্ষণিক বেতন যোগ করুন বিকল্পটি নির্বাচন করুন
একবার আপনি ক্লিক করুনবিল উপস্থাপনা ট্যাব, একটি নতুন পর্দা খোলে। এই স্ক্রিনে, আপনি স্ক্রিনের বাম দিকে বিভিন্ন বিকল্প খুঁজে পেতে পারেন। এখানে, আপনাকে বিকল্পটি পরীক্ষা করতে হবেবিলার/ ইনস্ট্যান্ট পে যোগ করুন আমার বিলার্স শিরোনামের অধীনে। এই পর্দার জন্য ইমেজ নীচে দেওয়া হয় যেখানেবিলার/ ইনস্ট্যান্ট পে যোগ করুন এবংআমার বিলার্স উভয় বিকল্প কালো হাইলাইট করা হয়.
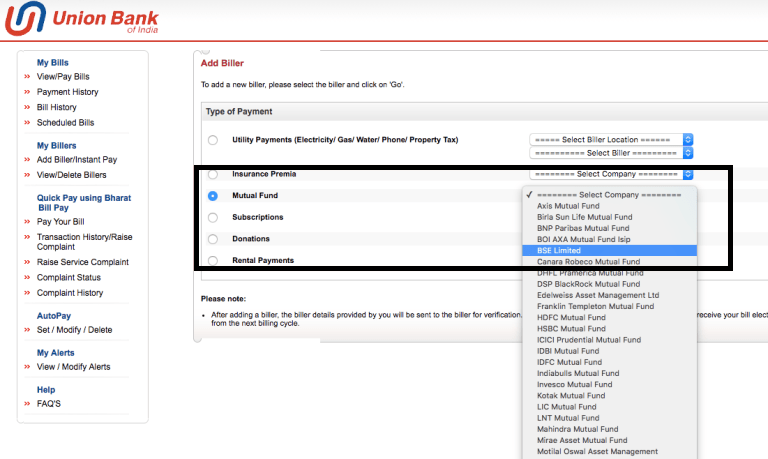
মিউচুয়াল ফান্ডের অধীনে বিএসই লিমিটেড বেছে নিন
এটি বিলার যোগ করার প্রক্রিয়ার তৃতীয় ধাপ। এই ধাপে, একবার আপনি ক্লিক করুনবিলার/ ইনস্ট্যান্ট পে যোগ করুন বিকল্প; একটি নতুন পপ আপ খোলে যেখানে বিভিন্ন অর্থপ্রদানের বিকল্প রয়েছে যেমন ইউটিলিটি পেমেন্ট,বীমা প্রিমিয়া এবং অন্যান্য। এখানে, আপনাকে নির্বাচন করতে হবেপারস্পরিক তহবিল বিকল্প। একবার আপনি মিউচুয়াল ফান্ড বিকল্পে ক্লিক করলে, এটির পাশে একটি ড্রপ-ডাউন সক্ষম হবে যেখানে আপনাকে বিকল্পটি নির্বাচন করতে হবেবিএসই লিমিটেড. একবার আপনি BSE লিমিটেডে ক্লিক করলে, আপনাকে ক্লিক করতে হবেযাওয়া. এই ধাপের জন্য ইমেজ নীচে দেওয়া হয় যেখানেযৌথ পুঁজি এবং BSE লিমিটেড বিকল্পটি কালো রঙে হাইলাইট করা হয়েছে।
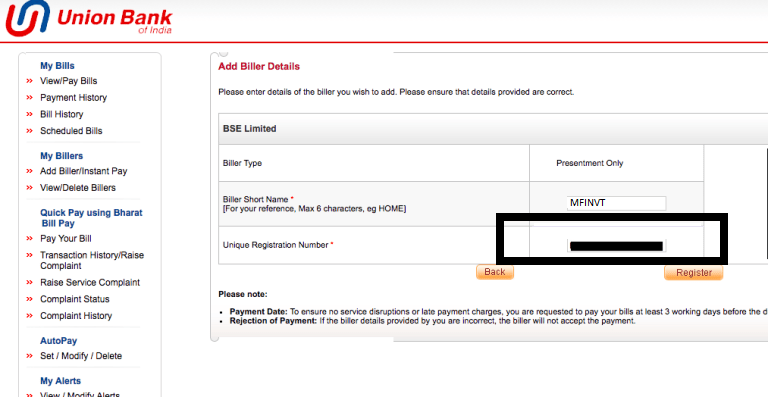
অনন্য নিবন্ধন নম্বর যোগ করুন
ক্লিক করার পরযাওয়া পূর্ববর্তী ধাপে, একটি নতুন স্ক্রীন খোলে যেখানে আপনাকে আপনার ইউআরএন নম্বর লিখতে হবে। এই URN নম্বরটি হল প্রথম SIP-এর অর্থপ্রদান করার পরে আপনার ইমেলে যেটি আপনি পাবেন। আপনি যদি এসআইপি নিবন্ধনের জন্য ইমেল না পান তবে চিন্তা করবেন না। আপনি ওয়েবসাইট থেকে একই অ্যাক্সেস করতে পারেনwww.fincash.com লগ ইন করে এবং পরিদর্শন করেআমার SIPs বিভাগ. এছাড়াও আপনাকে আপনার বিলারের সাথে একটি ছোট নাম যোগ করতে হবে। একবার আপনি উভয় ডেটা যোগ করলে, আপনাকে রেজিস্টারে ক্লিক করতে হবে। এর জন্য চিত্রটি নীচে দেওয়া হয়েছে যেখানে URN কালো রঙে হাইলাইট করা হয়েছে।
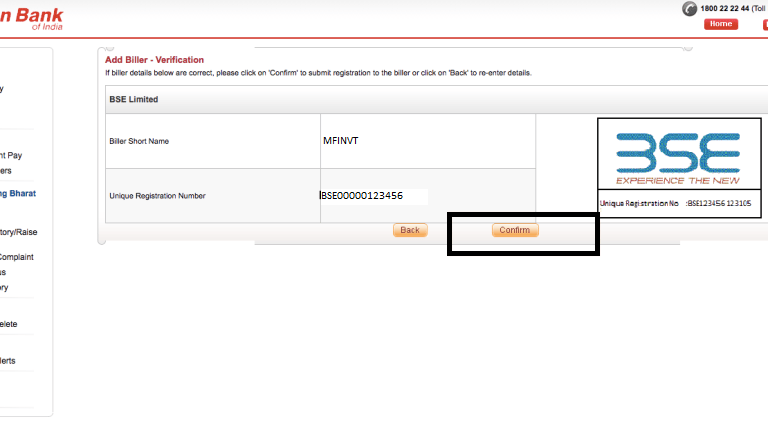
ডেটা পূরণের সারাংশ
একবার আপনি ক্লিক করুননিবন্ধন, একটি নতুন স্ক্রীন খোলা হয় যেখানে আপনি প্রাসঙ্গিক ভরা তথ্য দেখতে পাবেন। একবার আপনি যাচাই করে চেক করলে, আপনি ক্লিক করতে পারেননিশ্চিত করুন. আপনি যদি মনে করেন যে ডেটাতে কিছু ভুল আছে, তাহলে আপনাকে ক্লিক করতে হবেপেছনে. এই ধাপের জন্য চিত্রটি নীচে দেওয়া হয়েছে যেখানে নিশ্চিত বোতামটি কালো রঙে হাইলাইট করা হয়েছে।
নিশ্চিতকরণ
ইউনিয়ন ব্যাঙ্ক অফ ইন্ডিয়াতে বিলার যোগ করার প্রক্রিয়ার শেষ ধাপ এটি। একবার আপনি ক্লিক করুননিশ্চিত করুন বিকল্প একটি নতুন স্ক্রীন পপ আউট যা দেখায় যে বিলার সফলভাবে নিবন্ধিত হয়েছে। এই ধাপের চিত্রটি নিম্নরূপ যেখানে অভিনন্দন বার্তাটি সবুজ রঙে হাইলাইট করা হয়েছে।

অতএব, উপরে উল্লিখিত পদক্ষেপের মাধ্যমে, আমরা উপসংহারে পৌঁছাতে পারি যে ইউনিয়ন ব্যাঙ্ক অফ ইন্ডিয়ার ক্ষেত্রে বিলার যোগ করা সহজ।
ভাল রিটার্ন উপার্জনের জন্য বিনিয়োগের জন্য সেরা এসআইপি
এখানে কিছু সুপারিশকৃত এসআইপি রয়েছে5 বছর এর থেকে বেশি রিটার্ন এবং AUMINR 500 কোটি:
Fund NAV Net Assets (Cr) Min SIP Investment 3 MO (%) 6 MO (%) 1 YR (%) 3 YR (%) 5 YR (%) 2024 (%) DSP World Gold Fund Growth ₹50.1271
↓ -1.40 ₹1,433 500 -16.7 -23.5 57.5 42.3 23.2 167.1 SBI Gold Fund Growth ₹41.5386
↓ -0.29 ₹15,294 500 -4.9 -7.6 43.2 32.3 23.1 71.5 IDBI Gold Fund Growth ₹36.8274
↓ -0.23 ₹757 500 -4.3 -8.3 42.6 32 23 79 ICICI Prudential Regular Gold Savings Fund Growth ₹43.8748
↓ -0.31 ₹6,265 100 -5 -7.9 42.8 32.2 23 72 Axis Gold Fund Growth ₹41.1825
↓ -0.31 ₹2,828 1,000 -4.9 -7.8 42.8 31.8 22.9 69.8 Note: Returns up to 1 year are on absolute basis & more than 1 year are on CAGR basis. as on 23 Jul 26 Research Highlights & Commentary of 5 Funds showcased
Commentary DSP World Gold Fund SBI Gold Fund IDBI Gold Fund ICICI Prudential Regular Gold Savings Fund Axis Gold Fund Point 1 Bottom quartile AUM (₹1,433 Cr). Highest AUM (₹15,294 Cr). Bottom quartile AUM (₹757 Cr). Upper mid AUM (₹6,265 Cr). Lower mid AUM (₹2,828 Cr). Point 2 Oldest track record among peers (18 yrs). Established history (14+ yrs). Established history (13+ yrs). Established history (14+ yrs). Established history (14+ yrs). Point 3 Top rated. Rating: 2★ (upper mid). Not Rated. Rating: 1★ (lower mid). Rating: 1★ (bottom quartile). Point 4 Risk profile: High. Risk profile: Moderately High. Risk profile: Moderately High. Risk profile: Moderately High. Risk profile: Moderately High. Point 5 5Y return: 23.23% (top quartile). 5Y return: 23.10% (upper mid). 5Y return: 22.98% (lower mid). 5Y return: 22.98% (bottom quartile). 5Y return: 22.93% (bottom quartile). Point 6 3Y return: 42.34% (top quartile). 3Y return: 32.32% (upper mid). 3Y return: 31.97% (bottom quartile). 3Y return: 32.20% (lower mid). 3Y return: 31.83% (bottom quartile). Point 7 1Y return: 57.48% (top quartile). 1Y return: 43.17% (upper mid). 1Y return: 42.56% (bottom quartile). 1Y return: 42.83% (lower mid). 1Y return: 42.80% (bottom quartile). Point 8 Alpha: 2.12 (top quartile). 1M return: 0.28% (bottom quartile). 1M return: 0.53% (top quartile). 1M return: 0.33% (lower mid). 1M return: 0.38% (upper mid). Point 9 Sharpe: 1.22 (bottom quartile). Alpha: 0.00 (upper mid). Alpha: 0.00 (lower mid). Alpha: 0.00 (bottom quartile). Alpha: 0.00 (bottom quartile). Point 10 Information ratio: -0.50 (bottom quartile). Sharpe: 1.29 (upper mid). Sharpe: 1.22 (bottom quartile). Sharpe: 1.22 (lower mid). Sharpe: 1.35 (top quartile). DSP World Gold Fund
SBI Gold Fund
IDBI Gold Fund
ICICI Prudential Regular Gold Savings Fund
Axis Gold Fund
"The primary investment objective of the Scheme is to seek capital appreciation by investing predominantly in units of MLIIF - WGF. The Scheme may, at the discretion of the Investment Manager, also invest in the units of other similar overseas mutual fund schemes, which may constitute a significant part of its corpus. The Scheme may also invest a certain portion of its corpus in money market securities and/or units of money market/liquid schemes of DSP Merrill Lynch Mutual Fund, in order to meet liquidity requirements from time to time. However, there is no assurance that the investment objective of the Scheme will be realized." Below is the key information for DSP World Gold Fund Returns up to 1 year are on The scheme seeks to provide returns that closely correspond to returns provided by SBI - ETF Gold (Previously known as SBI GETS). Research Highlights for SBI Gold Fund Below is the key information for SBI Gold Fund Returns up to 1 year are on The investment objective of the Scheme will be to generate returns that correspond closely to the returns generated by IDBI Gold Exchange Traded Fund (IDBI GOLD ETF). Research Highlights for IDBI Gold Fund Below is the key information for IDBI Gold Fund Returns up to 1 year are on ICICI Prudential Regular Gold Savings Fund (the Scheme) is a fund of funds scheme with the primary objective to generate returns by investing in units of ICICI Prudential Gold Exchange Traded Fund (IPru Gold ETF).
However, there can be no assurance that the investment objectives of the Scheme will be realized. Research Highlights for ICICI Prudential Regular Gold Savings Fund Below is the key information for ICICI Prudential Regular Gold Savings Fund Returns up to 1 year are on To generate returns that closely correspond to returns generated by Axis Gold ETF. Research Highlights for Axis Gold Fund Below is the key information for Axis Gold Fund Returns up to 1 year are on 1. DSP World Gold Fund
DSP World Gold Fund
Growth Launch Date 14 Sep 07 NAV (23 Jul 26) ₹50.1271 ↓ -1.40 (-2.72 %) Net Assets (Cr) ₹1,433 on 30 Jun 26 Category Equity - Global AMC DSP BlackRock Invmt Managers Pvt. Ltd. Rating ☆☆☆ Risk High Expense Ratio 1.41 Sharpe Ratio 1.22 Information Ratio -0.5 Alpha Ratio 2.12 Min Investment 1,000 Min SIP Investment 500 Exit Load 0-12 Months (1%),12 Months and above(NIL) Growth of 10,000 investment over the years.
Date Value 30 Jun 21 ₹10,000 30 Jun 22 ₹8,181 30 Jun 23 ₹9,294 30 Jun 24 ₹10,640 30 Jun 25 ₹16,808 30 Jun 26 ₹27,693 Returns for DSP World Gold Fund
absolute basis & more than 1 year are on CAGR (Compound Annual Growth Rate) basis. as on 23 Jul 26 Duration Returns 1 Month -5.9% 3 Month -16.7% 6 Month -23.5% 1 Year 57.5% 3 Year 42.3% 5 Year 23.2% 10 Year 15 Year Since launch 8.9% Historical performance (Yearly) on absolute basis
Year Returns 2024 167.1% 2023 15.9% 2022 7% 2021 -7.7% 2020 -9% 2019 31.4% 2018 35.1% 2017 -10.7% 2016 -4% 2015 52.7% Fund Manager information for DSP World Gold Fund
Name Since Tenure Kaivalya Nadkarni 1 May 25 1.17 Yr. Data below for DSP World Gold Fund as on 30 Jun 26
Equity Sector Allocation
Sector Value Basic Materials 94.47% Asset Allocation
Asset Class Value Cash 3.62% Equity 94.47% Debt 0% Other 1.91% Top Securities Holdings / Portfolio
Name Holding Value Quantity BGF World Gold I2
Investment Fund | -68% ₹1,141 Cr 1,005,044 VanEck Gold Miners ETF
- | GDX29% ₹490 Cr 573,719 Treps / Reverse Repo Investments
CBLO/Reverse Repo | -3% ₹54 Cr Net Receivables/Payables
Net Current Assets | -0% -₹6 Cr 2. SBI Gold Fund
SBI Gold Fund
Growth Launch Date 12 Sep 11 NAV (24 Jul 26) ₹41.5386 ↓ -0.29 (-0.70 %) Net Assets (Cr) ₹15,294 on 30 Jun 26 Category Gold - Gold AMC SBI Funds Management Private Limited Rating ☆☆ Risk Moderately High Expense Ratio 0.3 Sharpe Ratio 1.29 Information Ratio 0 Alpha Ratio 0 Min Investment 5,000 Min SIP Investment 500 Exit Load 0-1 Years (1%),1 Years and above(NIL) Growth of 10,000 investment over the years.
Date Value 30 Jun 21 ₹10,000 30 Jun 22 ₹10,828 30 Jun 23 ₹12,154 30 Jun 24 ₹14,949 30 Jun 25 ₹19,644 30 Jun 26 ₹28,455 Returns for SBI Gold Fund
absolute basis & more than 1 year are on CAGR (Compound Annual Growth Rate) basis. as on 23 Jul 26 Duration Returns 1 Month 0.3% 3 Month -4.9% 6 Month -7.6% 1 Year 43.2% 3 Year 32.3% 5 Year 23.1% 10 Year 15 Year Since launch 10.1% Historical performance (Yearly) on absolute basis
Year Returns 2024 71.5% 2023 19.6% 2022 14.1% 2021 12.6% 2020 -5.7% 2019 27.4% 2018 22.8% 2017 6.4% 2016 3.5% 2015 10% Fund Manager information for SBI Gold Fund
Name Since Tenure Viral Chhadva 1 Mar 26 0.33 Yr. Data below for SBI Gold Fund as on 30 Jun 26
Asset Allocation
Asset Class Value Cash 1.64% Other 98.36% Top Securities Holdings / Portfolio
Name Holding Value Quantity SBI Gold ETF
- | -100% ₹16,542 Cr 1,246,686,194
↑ 13,950,000 Net Receivable / Payable
CBLO | -0% -₹55 Cr Treps
CBLO/Reverse Repo | -0% ₹45 Cr 3. IDBI Gold Fund
IDBI Gold Fund
Growth Launch Date 14 Aug 12 NAV (24 Jul 26) ₹36.8274 ↓ -0.23 (-0.62 %) Net Assets (Cr) ₹757 on 30 Jun 26 Category Gold - Gold AMC IDBI Asset Management Limited Rating Risk Moderately High Expense Ratio 0.64 Sharpe Ratio 1.22 Information Ratio 0 Alpha Ratio 0 Min Investment 5,000 Min SIP Investment 500 Exit Load 0-12 Months (1%),12 Months and above(NIL) Growth of 10,000 investment over the years.
Date Value 30 Jun 21 ₹10,000 30 Jun 22 ₹10,739 30 Jun 23 ₹12,175 30 Jun 24 ₹14,979 30 Jun 25 ₹19,637 30 Jun 26 ₹28,198 Returns for IDBI Gold Fund
absolute basis & more than 1 year are on CAGR (Compound Annual Growth Rate) basis. as on 23 Jul 26 Duration Returns 1 Month 0.5% 3 Month -4.3% 6 Month -8.3% 1 Year 42.6% 3 Year 32% 5 Year 23% 10 Year 15 Year Since launch 9.8% Historical performance (Yearly) on absolute basis
Year Returns 2024 79% 2023 18.7% 2022 14.8% 2021 12% 2020 -4% 2019 24.2% 2018 21.6% 2017 5.8% 2016 1.4% 2015 8.3% Fund Manager information for IDBI Gold Fund
Name Since Tenure Sumit Bhatnagar 1 Jun 24 2.08 Yr. Data below for IDBI Gold Fund as on 30 Jun 26
Asset Allocation
Asset Class Value Cash 1.65% Other 98.35% Top Securities Holdings / Portfolio
Name Holding Value Quantity LIC MF Gold ETF
- | -100% ₹823 Cr 58,774,200
↑ 705,000 Treps
CBLO/Reverse Repo | -0% ₹3 Cr Net Receivables / (Payables)
CBLO | -0% -₹2 Cr 4. ICICI Prudential Regular Gold Savings Fund
ICICI Prudential Regular Gold Savings Fund
Growth Launch Date 11 Oct 11 NAV (24 Jul 26) ₹43.8748 ↓ -0.31 (-0.70 %) Net Assets (Cr) ₹6,265 on 30 Jun 26 Category Gold - Gold AMC ICICI Prudential Asset Management Company Limited Rating ☆ Risk Moderately High Expense Ratio 0.38 Sharpe Ratio 1.22 Information Ratio 0 Alpha Ratio 0 Min Investment 5,000 Min SIP Investment 100 Exit Load 0-15 Months (2%),15 Months and above(NIL) Growth of 10,000 investment over the years.
Date Value 30 Jun 21 ₹10,000 30 Jun 22 ₹10,811 30 Jun 23 ₹12,106 30 Jun 24 ₹14,939 30 Jun 25 ₹19,567 30 Jun 26 ₹28,290 Returns for ICICI Prudential Regular Gold Savings Fund
absolute basis & more than 1 year are on CAGR (Compound Annual Growth Rate) basis. as on 23 Jul 26 Duration Returns 1 Month 0.3% 3 Month -5% 6 Month -7.9% 1 Year 42.8% 3 Year 32.2% 5 Year 23% 10 Year 15 Year Since launch 10.5% Historical performance (Yearly) on absolute basis
Year Returns 2024 72% 2023 19.5% 2022 13.5% 2021 12.7% 2020 -5.4% 2019 26.6% 2018 22.7% 2017 7.4% 2016 0.8% 2015 8.9% Fund Manager information for ICICI Prudential Regular Gold Savings Fund
Name Since Tenure Manish Banthia 27 Sep 12 13.77 Yr. Nishit Patel 29 Dec 20 5.51 Yr. Ashwini Bharucha 1 Nov 25 0.66 Yr. Venus Ahuja 1 Nov 25 0.66 Yr. Data below for ICICI Prudential Regular Gold Savings Fund as on 30 Jun 26
Asset Allocation
Asset Class Value Cash 1.86% Other 98.14% Top Securities Holdings / Portfolio
Name Holding Value Quantity ICICI Pru Gold ETF
- | -100% ₹6,851 Cr 514,675,516
↑ 10,666,563 Treps
CBLO/Reverse Repo | -0% ₹22 Cr Net Current Assets
Net Current Assets | -0% -₹18 Cr 5. Axis Gold Fund
Axis Gold Fund
Growth Launch Date 20 Oct 11 NAV (24 Jul 26) ₹41.1825 ↓ -0.31 (-0.75 %) Net Assets (Cr) ₹2,828 on 30 Jun 26 Category Gold - Gold AMC Axis Asset Management Company Limited Rating ☆ Risk Moderately High Expense Ratio 0.5 Sharpe Ratio 1.35 Information Ratio 0 Alpha Ratio 0 Min Investment 5,000 Min SIP Investment 1,000 Exit Load 0-1 Years (1%),1 Years and above(NIL) Growth of 10,000 investment over the years.
Date Value 30 Jun 21 ₹10,000 30 Jun 22 ₹10,819 30 Jun 23 ₹12,177 30 Jun 24 ₹14,959 30 Jun 25 ₹19,547 30 Jun 26 ₹28,179 Returns for Axis Gold Fund
absolute basis & more than 1 year are on CAGR (Compound Annual Growth Rate) basis. as on 23 Jul 26 Duration Returns 1 Month 0.4% 3 Month -4.9% 6 Month -7.8% 1 Year 42.8% 3 Year 31.8% 5 Year 22.9% 10 Year 15 Year Since launch 10.1% Historical performance (Yearly) on absolute basis
Year Returns 2024 69.8% 2023 19.2% 2022 14.7% 2021 12.5% 2020 -4.7% 2019 26.9% 2018 23.1% 2017 8.3% 2016 0.7% 2015 10.7% Fund Manager information for Axis Gold Fund
Name Since Tenure Aditya Pagaria 9 Nov 21 4.64 Yr. Pratik Tibrewal 1 Feb 25 1.41 Yr. Data below for Axis Gold Fund as on 30 Jun 26
Asset Allocation
Asset Class Value Cash 1.81% Other 98.19% Top Securities Holdings / Portfolio
Name Holding Value Quantity Axis Gold ETF
- | -100% ₹3,091 Cr 238,687,058
↑ 2,659,572 Clearing Corporation Of India Ltd
CBLO | -0% ₹6 Cr Net Receivables / (Payables)
CBLO | -0% -₹5 Cr
আরও কোনো প্রশ্নের ক্ষেত্রে, আপনি আমাদের সাথে 8451864111 নম্বরে যোগাযোগ করতে পারেন যে কোনো কার্যদিবসে সকাল 9.30 থেকে সন্ধ্যা 6.30 টার মধ্যে অথবা যে কোনো সময় আমাদের কাছে একটি মেইল লিখতে পারেনsupport@fincash.com অথবা আমাদের ওয়েবসাইটে লগইন করে আমাদের সাথে চ্যাট করুনwww.fincash.com.
এখানে প্রদত্ত তথ্য সঠিক কিনা তা নিশ্চিত করার জন্য সমস্ত প্রচেষ্টা করা হয়েছে। যাইহোক, তথ্যের সঠিকতা সম্পর্কে কোন গ্যারান্টি দেওয়া হয় না। কোনো বিনিয়োগ করার আগে স্কিমের তথ্য নথির সাথে যাচাই করুন।
")


AMFI Registration No. 112358 | CIN: U74999MH2016PTC282153
Shepard Technologies Pvt. Ltd. (with ARN code 112358) makes no warranties or representations, express or implied, on products offered through the platform. It accepts no liability for any damages or losses, however caused, in connection with the use of, or on the reliance of its product or related services. Terms and conditions of the website are applicable.
©2026 Shepard Technologies Private Limited. All Rights Reserved
Research Highlights for DSP World Gold Fund