ಲೈಫ್ ಟೈಮ್ ಫ್ರೀ ಮ್ಯೂಚುಯಲ್ ಫಂಡ್ಸ್ ಹೂಡಿಕೆ ಖಾತೆ
ಫಿನ್ಕಾಶ್.ಕಾಮ್ ಜಗತ್ತಿಗೆ ಸುಸ್ವಾಗತ !!! ಮೊದಲನೆಯದಾಗಿ, ನಿಮ್ಮ ಮ್ಯೂಚುಯಲ್ ಫಂಡ್ ಹೂಡಿಕೆ ಚಾನಲ್ ಆಗಿ ನಮ್ಮನ್ನು ಆಯ್ಕೆ ಮಾಡಿದ್ದಕ್ಕಾಗಿ ನಾವು ನಿಮಗೆ ಧನ್ಯವಾದ ಹೇಳಲು ಬಯಸುತ್ತೇವೆ.
ನೀವು ಹರಿಕಾರರಾ? ನೀವು ಮಸಾಲೆಹೂಡಿಕೆದಾರ? ಚಿಂತಿಸಬೇಡಿ, ನಿಮ್ಮ ಎಲ್ಲಾ ಅಗತ್ಯಗಳನ್ನು ಪೂರೈಸಲಾಗುತ್ತದೆ. ಹೂಡಿಕೆಗಳು, ಉತ್ಪನ್ನ ಆಯ್ಕೆ, ನೋಂದಣಿ ಅಥವಾ ಇನ್ನಾವುದೇ ಪ್ರಶ್ನೆಗೆ ಸಂಬಂಧಿಸಿದ ಪ್ರತಿಯೊಂದು ಹಂತದಲ್ಲೂ ನಿಮಗೆ ಮಾರ್ಗದರ್ಶನ ನೀಡಲು ನಾವು ಯಾವಾಗಲೂ ಇರುವುದರಿಂದ ಖಚಿತವಾಗಿರಿ. ಆದ್ದರಿಂದ, ಇದರ ವೈಶಿಷ್ಟ್ಯಗಳ ಬಗ್ಗೆ ಉತ್ತಮ ತಿಳುವಳಿಕೆಯನ್ನು ಹೊಂದಲು ನಾವು ಮುಂದುವರಿಯೋಣಜೀವನ ಸಮಯ ಉಚಿತಮ್ಯೂಚುಯಲ್ ಫಂಡ್ಗಳು ಹೂಡಿಕೆ ಖಾತೆ ನೋಂದಣಿ ಪ್ರಕ್ರಿಯೆಯ ಜೊತೆಗೆ.
Talk to our investment specialist
ಫಿನ್ಕ್ಯಾಶ್.ಕಾಮ್ ಹೂಡಿಕೆ ಖಾತೆ ಏಕೆ?
ಫಿನ್ಕ್ಯಾಶ್.ಕಾಮ್ ಯಾವಾಗಲೂ “ಗ್ರಾಹಕ ಮೊದಲ” ನೀತಿಯನ್ನು ನಂಬುತ್ತದೆ. ಕ್ಲೈಂಟ್ನ ಅವಶ್ಯಕತೆಗಳನ್ನು ಮತ್ತು ಅದನ್ನು ಎಷ್ಟು ಪರಿಣಾಮಕಾರಿಯಾಗಿ ಪೂರೈಸಬಹುದು ಎಂಬುದನ್ನು ಗಮನದಲ್ಲಿಟ್ಟುಕೊಂಡು ಉನ್ನತ ದರ್ಜೆಯ ಗ್ರಾಹಕ ಸೇವೆಯನ್ನು ಒದಗಿಸಲು ನಾವು ಯಾವಾಗಲೂ ಖಚಿತಪಡಿಸುತ್ತೇವೆ. ನಿಮ್ಮ ಹಣಕ್ಕೆ ಮೌಲ್ಯವನ್ನು ರಚಿಸುವುದು ನಮ್ಮ ಉದ್ದೇಶ, ಇದರಿಂದಾಗಿ ನೀವು ಸಮಯದೊಳಗೆ ನಿಮ್ಮ ಗುರಿಗಳನ್ನು ಸಾಧಿಸಬಹುದು. ಫಿನ್ಕ್ಯಾಶ್.ಕಾಂನ ಕೆಲವು ಹೂಡಿಕೆದಾರ ಸ್ನೇಹಿ ವೈಶಿಷ್ಟ್ಯಗಳು:
- ಬಳಕೆದಾರ ಸ್ನೇಹಿ ವೆಬ್ಸೈಟ್ ಆದ್ದರಿಂದ ನೀವು ಕನಿಷ್ಟ ಕ್ಲಿಕ್ಗಳಲ್ಲಿ ಗರಿಷ್ಠ ಮಾಹಿತಿಯನ್ನು ಪಡೆಯುತ್ತೀರಿ
- ಜೀವಮಾನ ಸಕ್ರಿಯ ಮತ್ತು ಉಚಿತ ಖಾತೆ ಅಲ್ಲಿ ಹೂಡಿಕೆದಾರರು ವ್ಯವಹಾರ ಮಾಡದಿದ್ದರೂ ಯಾವುದೇ ಹಣವನ್ನು ಪಾವತಿಸಬೇಕಾಗಿಲ್ಲ.
- ಸುಲಭ ನೋಂದಣಿ ಪ್ರಕ್ರಿಯೆ ಅಲ್ಲಿ ಜನರು ಹೆಚ್ಚು ಸಮಯ ಕಳೆಯಬೇಕಾಗಿಲ್ಲ.
- ಕೆವೈಸಿ ಅನುಸರಣೆ ಇದನ್ನು ನಮ್ಮ ಚೌಕಟ್ಟಿನೊಳಗೆ ಮಾಡಬಹುದುeKYC ಮತ್ತು ಇದು ಮೊದಲ ಬಾರಿಗೆ ಸಹಾಯ ಮಾಡುತ್ತದೆ.
- ಸುರಕ್ಷತೆ ಮತ್ತು ಸುರಕ್ಷತೆ ಯಾವಾಗಲೂ ನಮ್ಮ ಆದ್ಯತೆಯ ಮೇಲೆ; ಕ್ಲೈಂಟ್ನ ಡೇಟಾ ಮತ್ತು ಅವರ ಎಲ್ಲಾ ವಹಿವಾಟುಗಳನ್ನು ಗೌಪ್ಯವಾಗಿಡಲಾಗಿದೆ ಎಂದು ನಾವು ಖಚಿತಪಡಿಸುತ್ತೇವೆ.
- ಯೋಜನೆಗಳ ವ್ಯಾಪಕ ಶ್ರೇಣಿ ಜನರು ತಮ್ಮ ಅವಶ್ಯಕತೆಗಳಿಗೆ ಅನುಗುಣವಾಗಿ ಆಯ್ಕೆ ಮಾಡಬಹುದು.
- ಕಸ್ಟಮೈಸ್ ಮಾಡಿದ ಪರಿಹಾರಗಳು ಫಿನ್ಕಾಶ್.ಕಾಮ್ನ ಹೂಡಿಕೆದಾರರಿಗೆ ತಮ್ಮ ಉತ್ಪನ್ನ ಆಯ್ಕೆ ಪ್ರಕ್ರಿಯೆಯನ್ನು ಸರಾಗಗೊಳಿಸುವಂತೆ ಸಹಾಯ ಮಾಡುತ್ತದೆELSS, ಎಸ್ಐಪಿಗಳು, ಮತ್ತುತೆರಿಗೆ ಉಳಿತಾಯ ಯೋಜನೆ.
ಫಿನ್ಕ್ಯಾಶ್.ಕಾಮ್ಗಾಗಿ ನೋಂದಣಿ ಪ್ರಕ್ರಿಯೆ
ನಿಮ್ಮ ಲೈಫ್ ಟೈಮ್ ಫ್ರೀ ಮ್ಯೂಚುಯಲ್ ಫಂಡ್ ಹೂಡಿಕೆ ಖಾತೆಯನ್ನು ತೆರೆಯುವ ನೋಂದಣಿ ಪ್ರಕ್ರಿಯೆಯು ತುಂಬಾ ಸರಳವಾಗಿದೆ. ನಿಮ್ಮ ನೋಂದಣಿಯನ್ನು ಪೂರ್ಣಗೊಳಿಸಲು, ನಿಮಗೆ ಇವುಗಳು ಬೇಕಾಗುತ್ತವೆ:
- ಸಕ್ರಿಯ ಮೊಬೈಲ್ ಸಂಖ್ಯೆ
- ಪ್ಯಾನ್ ಸಂಖ್ಯೆ
- ಆಧಾರ್ ಸಂಖ್ಯೆ
- ಸ್ಕ್ಯಾನ್ ಮಾಡಿದ ನಕಲು / ವೈಯಕ್ತಿಕ ರದ್ದಾದ ಚೆಕ್ನ ಚಿತ್ರ, ಬ್ಯಾಂಕ್ಹೇಳಿಕೆ, ಪಾಸ್ಬುಕ್ನ ಮುಂದಿನ ಪುಟ
- ನಿಮ್ಮ ಸಹಿಯ ನಕಲು / ಚಿತ್ರವನ್ನು ಸ್ಕ್ಯಾನ್ ಮಾಡಲಾಗಿದೆ
ನೋಂದಣಿ ಪ್ರಕ್ರಿಯೆಯನ್ನು ನೋಡೋಣ:
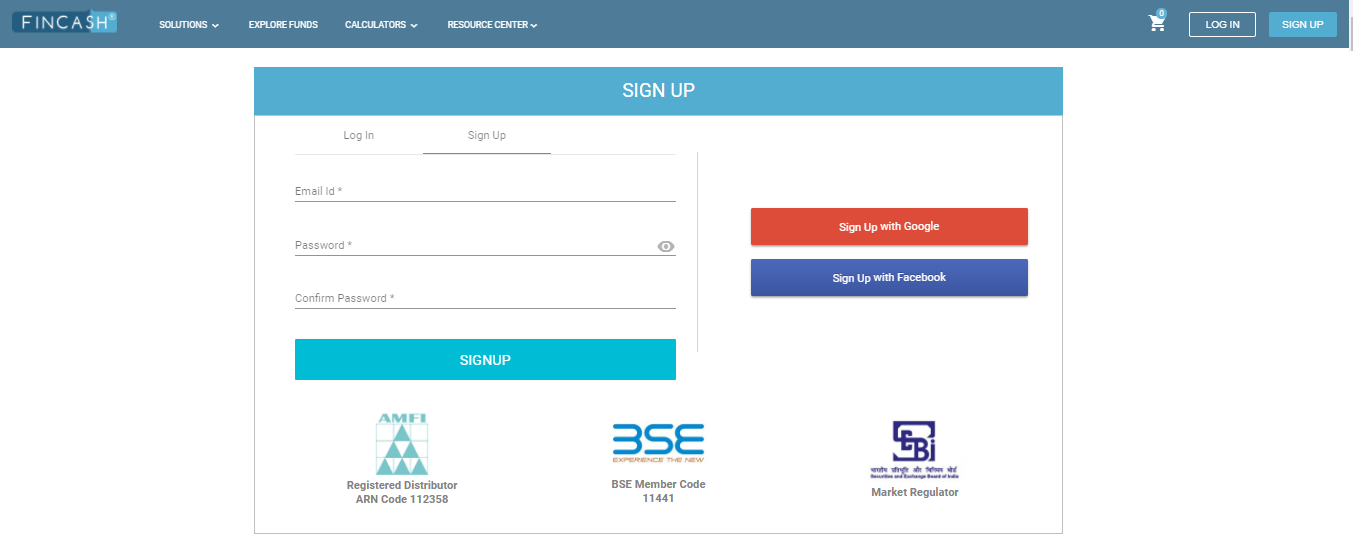
ಹಂತ 1: ನಿಮ್ಮ ಲಾಗಿನ್ ರಚಿಸಿ
ನಿಮ್ಮ ಲಾಗಿನ್ ರಚಿಸುವುದರೊಂದಿಗೆ ಮೊದಲ ಹಂತವು ಪ್ರಾರಂಭವಾಗುತ್ತದೆ. ನಿಮ್ಮ ಲಾಗಿನ್ ಐಡಿ ರಚಿಸಲು, ಮೊದಲು ನೀವು ವೆಬ್ಸೈಟ್ಗೆ ಭೇಟಿ ನೀಡಬೇಕಾಗುತ್ತದೆwww.fincash.com ಮತ್ತು ಕ್ಲಿಕ್ ಮಾಡಿಸೈನ್ ಅಪ್ ಮಾಡಿ ಪರದೆಯ ಮೇಲಿನ ಬಲಭಾಗದಲ್ಲಿರುವ ಬಟನ್ ಈ ಗುಂಡಿಯನ್ನು ಕ್ಲಿಕ್ ಮಾಡಿದ ನಂತರ, ನಿಮ್ಮ ಇಮೇಲ್ ವಿಳಾಸ ಮತ್ತು ಪಾಸ್ವರ್ಡ್ ಅನ್ನು ನೀವು ನಮೂದಿಸಬೇಕಾಗುತ್ತದೆ. ವ್ಯವಹಾರ ಮಾಡುವಾಗಲೆಲ್ಲಾ ಈ ಲಾಗಿನ್ ಐಡಿಯನ್ನು ನೀವು ಬಳಸುತ್ತೀರಿ. ಆದ್ದರಿಂದ, ನಿಮ್ಮ ಸರಿಯಾದ ಮತ್ತು ಮಾನ್ಯ ಇಮೇಲ್ ವಿಳಾಸವನ್ನು ನೀವು ನೀಡಿದ್ದೀರಿ ಎಂದು ಖಚಿತಪಡಿಸಿಕೊಳ್ಳಿ. ನೀವು ಫೇಸ್ಬುಕ್ ಅಥವಾ ಜಿಮೇಲ್ ಐಡಿ ಬಳಸಿ ಸಾಮಾಜಿಕ ಸೈನ್ ಅಪ್ ಮಾಡಬಹುದು. ಲಾಗಿನ್ ಬಟನ್ ಟ್ಯಾಬ್ ಮತ್ತು ಲಾಗಿನ್ ಪರದೆಯನ್ನು ತೋರಿಸುವ ಚಿತ್ರವನ್ನು ಕೆಳಗೆ ತೋರಿಸಲಾಗಿದೆ.
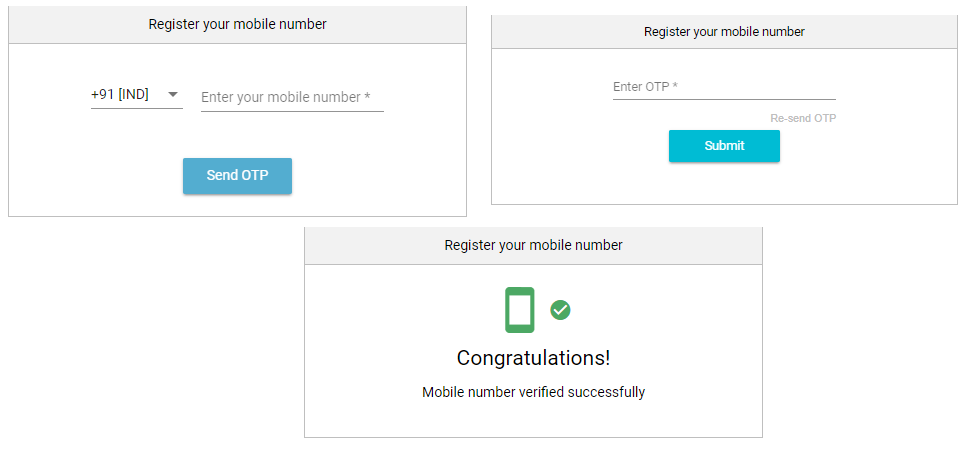
ಹಂತ 2: ಮೊಬೈಲ್ ಪರಿಶೀಲನೆ
ನಿಮ್ಮ ಲಾಗಿನ್ ಐಡಿಯನ್ನು ರಚಿಸಿದ ನಂತರ, ಮುಂದಿನ ಹಂತವು ಮೊಬೈಲ್ ಸಂಖ್ಯೆಯ ಪರಿಶೀಲನೆಯೊಂದಿಗೆ ವ್ಯವಹರಿಸುತ್ತದೆ. ಬೇರೆ ರೀತಿಯಲ್ಲಿ ಹೇಳುವುದಾದರೆ, ಲಾಗಿನ್ ಐಡಿಯ ಪೋಸ್ಟ್ ರಚನೆ, ಜನರು ತಮ್ಮ ಮೊಬೈಲ್ ಸಂಖ್ಯೆಯನ್ನು ನಮೂದಿಸಬೇಕಾದ ಪರದೆಯನ್ನು ಮೊಬೈಲ್ ಸಂಖ್ಯೆ ಪರಿಶೀಲನೆಗೆ ಮರುನಿರ್ದೇಶಿಸಲಾಗುತ್ತದೆ. ಮೊಬೈಲ್ ಸಂಖ್ಯೆಯನ್ನು ನಮೂದಿಸಿದ ನಂತರ, ಅವರು ಎಸ್ಎಂಎಸ್ ಮೂಲಕ ಒನ್ ಟೈಮ್ ಪಾಸ್ವರ್ಡ್ (ಒಟಿಪಿ) ಅನ್ನು ಸ್ವೀಕರಿಸುತ್ತಾರೆ, ಅದನ್ನು ಮತ್ತೆ ಪರದೆಯ ಮೇಲೆ ನಮೂದಿಸಬೇಕಾಗುತ್ತದೆ. ಆದ್ದರಿಂದ, ನಿಮ್ಮ ಸರಿಯಾದ ಮತ್ತು ಸಕ್ರಿಯ ಮೊಬೈಲ್ ಸಂಖ್ಯೆಯನ್ನು ನಮೂದಿಸಲು ಜಾಗರೂಕರಾಗಿರಿ. ಅಲ್ಲದೆ, ಒಟಿಪಿಯನ್ನು ನಮೂದಿಸುವಾಗ, ಎಲ್ಲಾ ಅಕ್ಷರಗಳನ್ನು ಸರಿಯಾಗಿ ನಮೂದಿಸಲಾಗಿದೆಯೆ ಎಂದು ಖಚಿತಪಡಿಸಿಕೊಳ್ಳಿ. ಎರಡನೇ ಹಂತದ ಚಿತ್ರ ಈ ಕೆಳಗಿನಂತಿರುತ್ತದೆ.
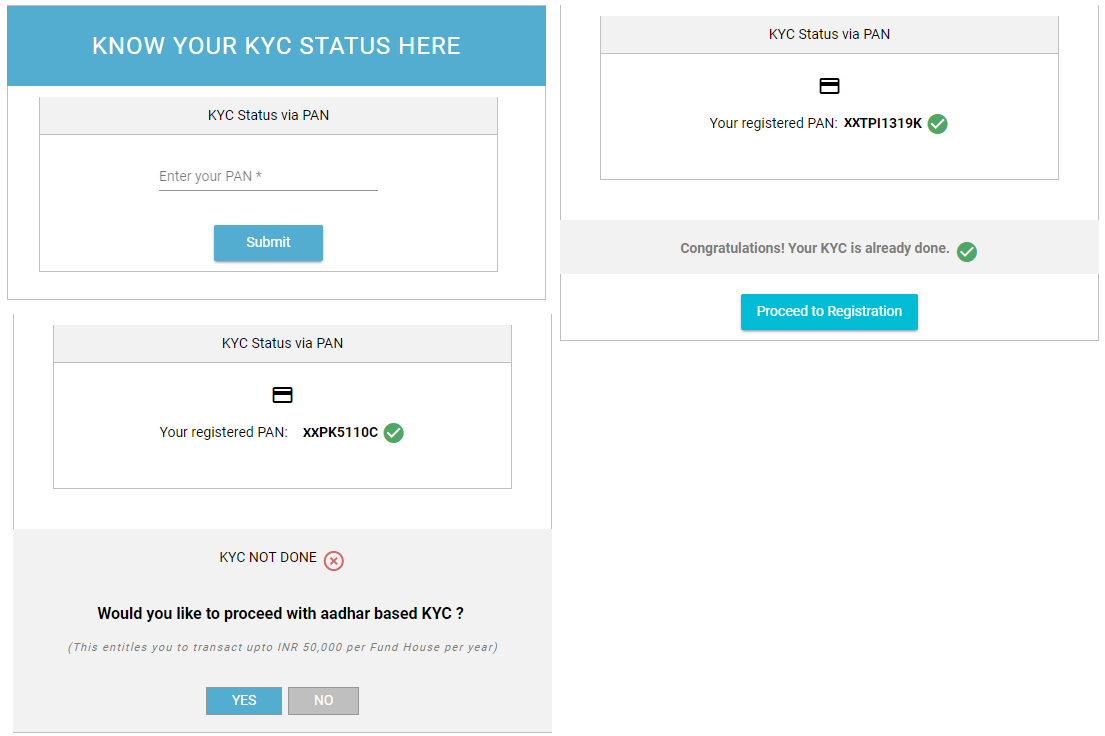
ಹಂತ 3: ಪ್ಯಾನ್ ಎಮ್ಎಫ್ ಕೆವೈಸಿ ಸ್ಥಿತಿ ಪರಿಶೀಲನೆ
ಮೂರನೇ ಹಂತವು ನೀವು ಕೆವೈಸಿ ಕಂಪ್ಲೈಂಟ್ ಹೂಡಿಕೆದಾರರಾಗಿದ್ದೀರಾ ಅಥವಾ ಇಲ್ಲವೇ ಎಂಬುದನ್ನು ಖಾತ್ರಿಗೊಳಿಸುತ್ತದೆ. ಎಮ್ಎಫ್ ಕೆವೈಸಿ ಅಥವಾ ನೋ-ಯುವರ್-ಗ್ರಾಹಕ ಎನ್ನುವುದು ನೀವು ಮೊದಲು ಪೂರ್ಣಗೊಳಿಸಬೇಕಾದ ಒಂದು-ಬಾರಿ ಪ್ರಕ್ರಿಯೆಯಾಗಿದೆಹೂಡಿಕೆ ಮ್ಯೂಚುಯಲ್ ಫಂಡ್ಗಳಲ್ಲಿ ಹಣ. ದಿಕೆವೈಸಿ ಸ್ಥಿತಿ ನಿಮ್ಮ ಪ್ಯಾನ್ ಬಳಸಿ ಪರಿಶೀಲಿಸಲಾಗಿದೆ. ನಿಮ್ಮ ಕೆವೈಸಿ ಪ್ರಕ್ರಿಯೆಯನ್ನು ನೀವು ಈಗಾಗಲೇ ಪೂರ್ಣಗೊಳಿಸಿದ್ದರೆ, ಅದಕ್ಕಾಗಿ ನೀವು ಪಾಪ್ ಅಪ್ ಪಡೆಯುತ್ತೀರಿ ಮತ್ತು ನೋಂದಣಿ ಪ್ರಕ್ರಿಯೆಯೊಂದಿಗೆ ಮುಂದುವರಿಯಬಹುದು. ನಿಮ್ಮ ಕೆವೈಸಿ ಪ್ರಕ್ರಿಯೆಯನ್ನು ಪೂರ್ಣಗೊಳಿಸದವರಿಗೆ, ಪಾಪ್ಅಪ್ “ನೀವು ಆಧಾರ್ ಇಕೆವೈಸಿಯೊಂದಿಗೆ ಮುಂದುವರಿಯಲು ಬಯಸುವಿರಾ?” ಆಗಿರುತ್ತದೆ. ಇದರಲ್ಲಿ, ಇಕೆವೈಸಿ ಕಾರ್ಯವಿಧಾನದೊಂದಿಗೆ ಮುಂದುವರಿಯಲು ಆಯ್ಕೆ ಮಾಡಬೇಕೆ ಅಥವಾ ಬೇಡವೇ ಎಂಬ ಆಯ್ಕೆ ನಿಮಗೆ ಇದೆ. ಕೆಳಗೆ ನೀಡಲಾದ ಚಿತ್ರವು ಪ್ಯಾನ್ ಎಮ್ಎಫ್ ಕೆವೈಸಿ ಸ್ಥಿತಿ ಪರಿಶೀಲನೆಗಾಗಿ ಸ್ಕ್ರೀನ್ ಸ್ನ್ಯಾಪ್ಶಾಟ್ ಅನ್ನು ತೋರಿಸುತ್ತದೆ.
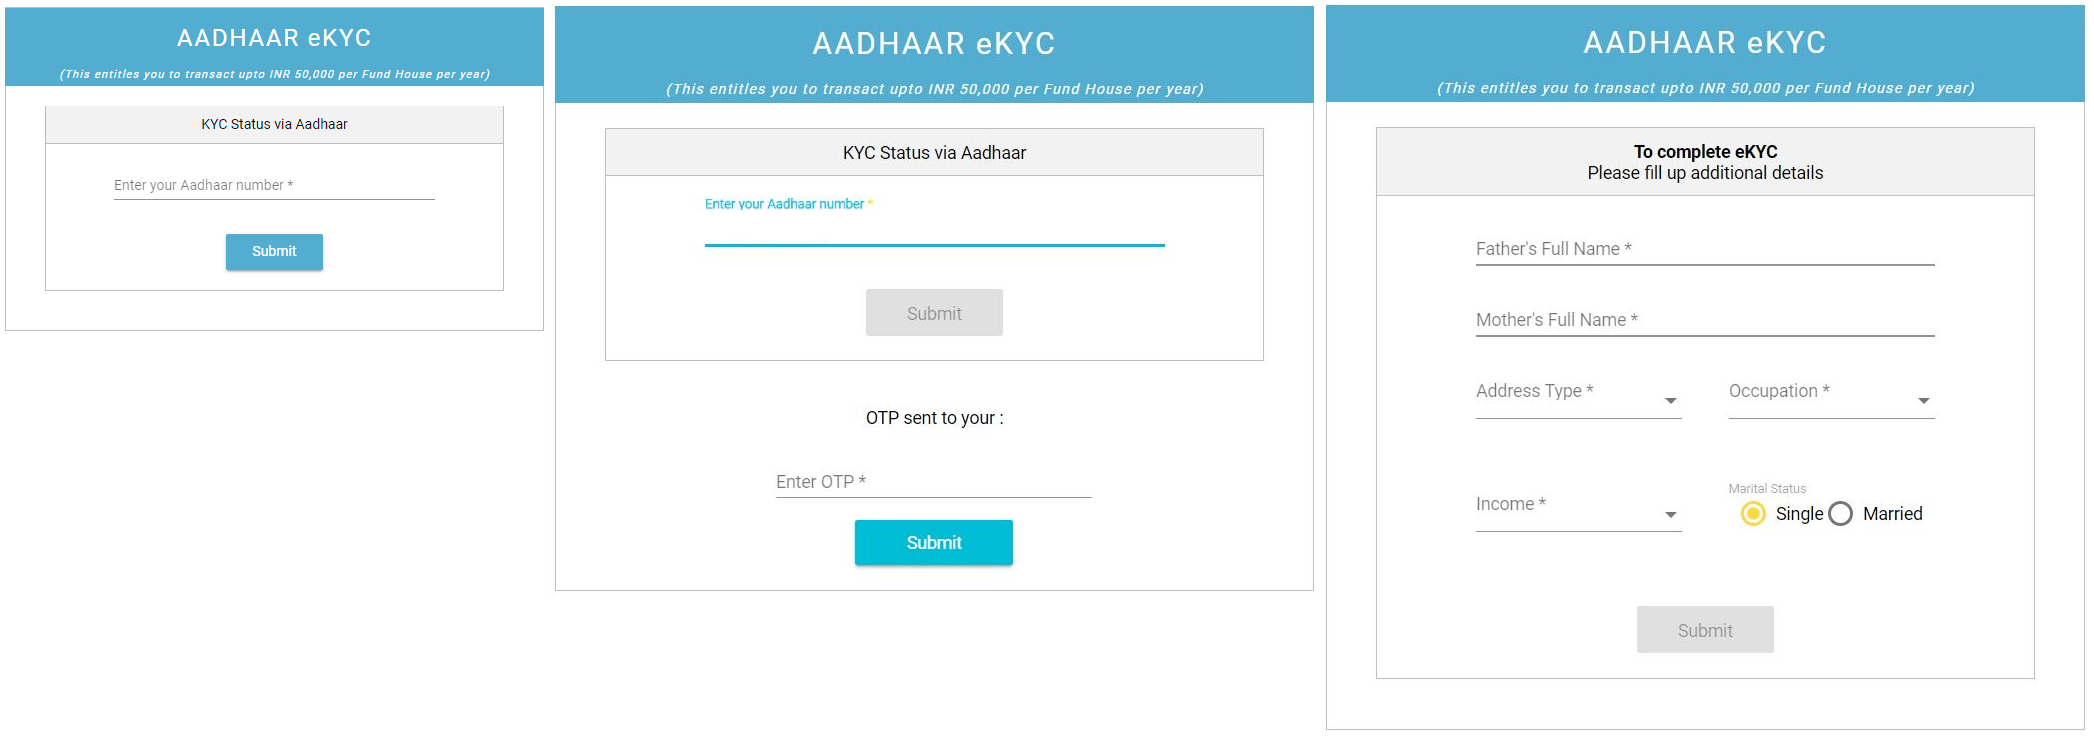
ಹಂತ 4: ಸಂಪೂರ್ಣ ಇಕೆವೈಸಿ ಫಾರ್ಮಲಿಟೀಸ್
ಹಿಂದಿನ ಹಂತದಲ್ಲಿ ಹೇಳಿದಂತೆ, ಆಧಾರ್ ಆಧಾರಿತ ಕೆವೈಸಿ ಅಂದರೆ ಇಕೆವೈಸಿ ಆಯ್ಕೆ ಮಾಡಲು ನಿಮಗೆ ಆಯ್ಕೆ ಇದೆ. ಜನರು ತಮ್ಮ ಆಧಾರ್ ಸಂಖ್ಯೆಯ ಮೂಲಕ ತಮ್ಮ ಇಕೆವೈಸಿ ಪ್ರಕ್ರಿಯೆಯನ್ನು ಪೂರ್ಣಗೊಳಿಸಬಹುದು. ಆದಾಗ್ಯೂ, ಇಕೆವೈಸಿ ಬಳಸುವುದರಿಂದ ಆರ್ಥಿಕ ವರ್ಷದಲ್ಲಿ 50,000 ರೂ. ಒಮ್ಮೆ ನೀವು ಇಕೆವೈಸಿ ಪೂರ್ಣಗೊಳಿಸುವಿಕೆಗಾಗಿ "ಹೌದು" ಆಯ್ಕೆಯನ್ನು ಕ್ಲಿಕ್ ಮಾಡಿದರೆ, ನಂತರ ನಿಮ್ಮನ್ನು ಪರದೆಯತ್ತ ಮರುನಿರ್ದೇಶಿಸಲಾಗುತ್ತದೆ; ನಿಮ್ಮ ಆಧಾರ್ ಸಂಖ್ಯೆಯನ್ನು ನೀವು ನಮೂದಿಸಬೇಕಾಗಿದೆ. ಆಧಾರ್ ಸಂಖ್ಯೆಯನ್ನು ನಮೂದಿಸಿದ ನಂತರ, ನಿಮ್ಮ ನೋಂದಾಯಿತ ಮೊಬೈಲ್ ಸಂಖ್ಯೆಯಲ್ಲಿ ನೀವು ಮತ್ತೆ ಒಟಿಪಿ ಪಡೆಯುತ್ತೀರಿ. ನೀವು ಈ ಒಟಿಪಿಯನ್ನು ನಮೂದಿಸಬೇಕು ಮತ್ತು ಹೆಚ್ಚುವರಿ ವಿವರಗಳ ಫಾರ್ಮ್ ಅನ್ನು ಭರ್ತಿ ಮಾಡಿ. ಇಕೆವೈಸಿ ಪ್ರಕ್ರಿಯೆಯ ಪೂರ್ಣತೆಯನ್ನು ತೋರಿಸುವ ಹಂತದ ಚಿತ್ರ ಈ ಕೆಳಗಿನಂತಿರುತ್ತದೆ.
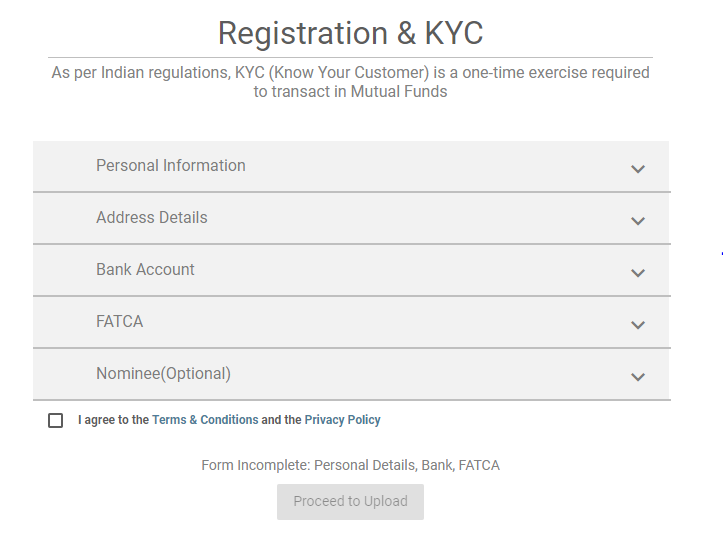
ಹಂತ 5: ನೋಂದಣಿ ಫಾರ್ಮ್
ಈ ಪ್ರಕ್ರಿಯೆಯನ್ನು ಎಲ್ಲಾ ವ್ಯಕ್ತಿಗಳು ಪೂರ್ಣಗೊಳಿಸಬೇಕಾಗಿದೆ. ನೋಂದಣಿ ಉದ್ದೇಶಗಳಿಗಾಗಿ, ನೀವು ಫಾರ್ಮ್ ಅನ್ನು ಭರ್ತಿ ಮಾಡಬೇಕಾಗಿದೆ, ಅದು 5 ವಿಭಿನ್ನ ಟ್ಯಾಬ್ಗಳಾಗಿ ಹರಡಿದೆ. ಈ ಟ್ಯಾಬ್ಗಳಲ್ಲಿ ವೈಯಕ್ತಿಕ ಮಾಹಿತಿ, ವಿಳಾಸ ವಿವರಗಳು, ಬ್ಯಾಂಕ್ ಖಾತೆ, FATCA ವಿವರಗಳು ಮತ್ತು ನಾಮಿನಿಗಳು ಸೇರಿವೆ. ಎಲ್ಲಾ ಟ್ಯಾಬ್ಗಳನ್ನು ಭರ್ತಿ ಮಾಡುವ ಮೂಲಕ ಮತ್ತು ಸಂಬಂಧಿತ ದಾಖಲೆಗಳನ್ನು ಅಪ್ಲೋಡ್ ಮಾಡುವ ಮೂಲಕ, ನೀವು ಸಂಪೂರ್ಣ ಕೆವೈಸಿ ಪ್ರಕ್ರಿಯೆಯನ್ನು ಪೂರ್ಣಗೊಳಿಸುತ್ತೀರಿ ಮತ್ತು ಮ್ಯೂಚುಯಲ್ ಫಂಡ್ಗಳಲ್ಲಿ ಯಾವುದೇ ಮೊತ್ತವನ್ನು ಹೂಡಿಕೆ ಮಾಡಬಹುದು. ಎಲ್ಲಾ ವಿವರಗಳನ್ನು ಭರ್ತಿ ಮಾಡಿದ ನಂತರ, ಮುಂದಿನ ಹಂತಕ್ಕೆ ಮುಂದುವರಿಯಲು ನೀವು ಚೆಕ್ ಬಾಕ್ಸ್ ಅನ್ನು ಕ್ಲಿಕ್ ಮಾಡಬೇಕಾಗುತ್ತದೆ. ಚೆಕ್ ಬಾಕ್ಸ್ ಜೊತೆಗೆ ನೋಂದಣಿ ಫಾರ್ಮ್ನ ವಿವಿಧ ಟ್ಯಾಬ್ಗಳನ್ನು ತೋರಿಸುವ ಚಿತ್ರವನ್ನು ಕೆಳಗೆ ತೋರಿಸಲಾಗಿದೆ.
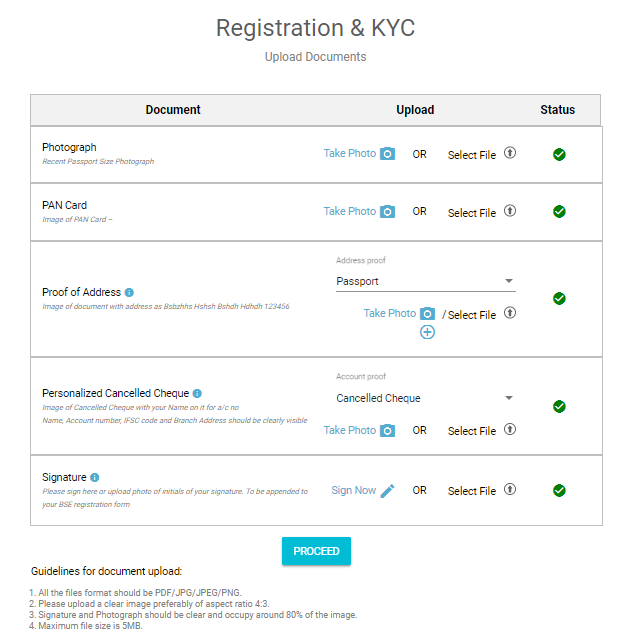
ಹಂತ 6: ದಾಖಲೆಗಳನ್ನು ಅಪ್ಲೋಡ್ ಮಾಡಿ
ನಿಮ್ಮ ನೋಂದಣಿ ಪ್ರಕ್ರಿಯೆಯ ಅಂತಿಮ ಹಂತ ಇದು. ನೀವು ಕೆವೈಸಿ ಪ್ರಕ್ರಿಯೆಯನ್ನು ಪೂರ್ಣಗೊಳಿಸಿದ್ದರೆ, ನೀವು ಅಪ್ಲೋಡ್ ಮಾಡಬೇಕಾಗುತ್ತದೆ:
- ನಿಮ್ಮ ಸಹಿಯ ಸ್ಕ್ಯಾನ್ ಮಾಡಿದ ನಕಲು / ಚಿತ್ರ ಮತ್ತು
- ನಿಮ್ಮ ವೈಯಕ್ತಿಕಗೊಳಿಸಿದ ಚೆಕ್ನ ಸ್ಕ್ಯಾನ್ ಮಾಡಿದ ನಕಲು / ಚಿತ್ರ.
ಆದಾಗ್ಯೂ, ನೀವು ಇಕೆವೈಸಿ ಪೂರ್ಣಗೊಳಿಸದಿದ್ದರೆ ಮತ್ತು ನೀವು ಕೆವೈಸಿ ಕಂಪ್ಲೈಂಟ್ ಆಗಿಲ್ಲದಿದ್ದರೆ ಮೇಲೆ ತಿಳಿಸಿದ ದಾಖಲೆಗಳೊಂದಿಗೆ, ನೀವು ಅಪ್ಲೋಡ್ ಮಾಡಬೇಕಾಗುತ್ತದೆ
- .ಾಯಾಚಿತ್ರ
- ಸ್ಕ್ಯಾನ್ ಮಾಡಿದ ನಕಲು / ಪ್ಯಾನ್ ಕಾರ್ಡ್ನ ಚಿತ್ರ ಮತ್ತು
- ವಿಳಾಸ ಪುರಾವೆಗಳ ಸ್ಕ್ಯಾನ್ ಮಾಡಿದ ಪ್ರತಿ / ಚಿತ್ರ
ಅಪ್ಲೋಡ್ ಡಾಕ್ಯುಮೆಂಟ್ಗಳ ಸಂದರ್ಭದಲ್ಲಿ, ಪರದೆಯ ಪ್ರದರ್ಶನವನ್ನು ಈ ಕೆಳಗಿನಂತೆ ನೀಡಲಾಗಿದೆ.
ಹೀಗಾಗಿ, ನೋಂದಣಿ ಪ್ರಕ್ರಿಯೆಯು ತುಂಬಾ ಸರಳವಾಗಿದೆ ಎಂದು ನಾವು ನೋಡಬಹುದು. ಈಗ ಅಂತಿಮ ಭಾಗವೆಂದರೆ ಫಿನ್ಕ್ಯಾಶ್.ಕಾಂನ ಕಸ್ಟಮೈಸ್ ಮಾಡಿದ ಪರಿಹಾರಗಳು. ಫಿನ್ಕಾಶ್.ಕಾಂನ ಯುಎಸ್ಪಿ ಅದರ ಕಸ್ಟಮೈಸ್ ಮಾಡಿದ ಪರಿಹಾರಗಳಾಗಿದ್ದು ಅದು ಉತ್ಪನ್ನ ಆಯ್ಕೆ ಪ್ರಕ್ರಿಯೆಯನ್ನು ಸರಾಗಗೊಳಿಸುವಲ್ಲಿ ಸಹಾಯ ಮಾಡುತ್ತದೆ.
ಫಿನ್ಕ್ಯಾಶ್ ಪರಿಹಾರಗಳು
ಈ ಮೂರು ಪರಿಹಾರಗಳು ಸಾಮಾನ್ಯ ಹೂಡಿಕೆಯ ಅಗತ್ಯತೆಗಳಾಗಿವೆ:
ಸೇವಿಂಗ್ಸ್ಪ್ಲಸ್
ತಮ್ಮ ಉಳಿತಾಯ ಬ್ಯಾಂಕ್ ಖಾತೆಯಲ್ಲಿ ನಿಷ್ಫಲ ಹಣವನ್ನು ಹೊಂದಿರುವ ಜನರಿಗೆ ಈ ಪರಿಹಾರವು ಸೂಕ್ತವಾಗಿದೆ ಮತ್ತು ಹೆಚ್ಚಿನ ಆದಾಯವನ್ನು ಹೆಚ್ಚಿಸುವ ಮಾರ್ಗಗಳನ್ನು ಹುಡುಕುತ್ತಿದೆ.ಉಳಿತಾಯ ಅಗ್ರ ಮೂರು ಕಟ್ಟುದ್ರವ ನಿಧಿ ಹೋಲಿಸಿದರೆ ಹೆಚ್ಚಿನ ಆದಾಯವನ್ನು ನೀಡುವ ಯೋಜನೆಗಳುಉಳಿತಾಯ ಖಾತೆ. ಹೆಚ್ಚುವರಿಯಾಗಿ, ಈ ಹಣವನ್ನು ಸುರಕ್ಷಿತ ಹೂಡಿಕೆ ಮಾರ್ಗವೆಂದು ಪರಿಗಣಿಸಲಾಗುತ್ತದೆ. ಸೇವಿಂಗ್ಸ್ಪ್ಲಸ್ನ ಕೆಲವು ವೈಶಿಷ್ಟ್ಯಗಳು:
- ಹೆಚ್ಚಿನ ಆದಾಯ
- ತ್ವರಿತ ವಿಮೋಚನೆ
- ಲಾಕ್-ಇನ್ ಅಥವಾ ನಿರ್ಗಮನ ಲೋಡ್ ಇಲ್ಲ
- ಒಂದು ಕ್ಲಿಕ್ನಲ್ಲಿ ಹೂಡಿಕೆ ಮಾಡಿ ಮತ್ತು ರಿಡೀಮ್ ಮಾಡಿ
ಸ್ಮಾರ್ಟ್ ಸಿಪ್
ಸ್ಮಾರ್ಟ್ ಸಿಪ್ ಅಗ್ರ ಮೂರು ಇಕ್ವಿಟಿ ಫಂಡ್ ಯೋಜನೆಗಳ ಒಂದು ಬಂಡಲ್ ಆಗಿದ್ದು ಅದು ಸ್ಥಿರವೆಂದು ಪರಿಗಣಿಸಲಾಗುತ್ತದೆ ಮತ್ತು ಕೆಲವು ಅವಧಿಯಲ್ಲಿ ಉತ್ತಮ ಲಾಭವನ್ನು ಗಳಿಸಿದೆ. ದೀರ್ಘಾವಧಿಯ ಹೂಡಿಕೆಯ ಅವಧಿಯನ್ನು ಹೊಂದಿರುವ ಜನರಿಗೆ ಇದು ಸೂಕ್ತವಾಗಿದೆ. ಹೆಸರೇ ಸೂಚಿಸುವಂತೆಎಸ್ಐಪಿ, ಜನರು ತಮ್ಮ ಉದ್ದೇಶಗಳನ್ನು ಸಾಧಿಸಲು ಈ ಯೋಜನೆಗಳಲ್ಲಿ ಸಣ್ಣ ಮೊತ್ತವನ್ನು ಹೂಡಿಕೆ ಮಾಡಬಹುದು. ಸ್ಮಾರ್ಟ್ಸಿಪ್ನ ವೈಶಿಷ್ಟ್ಯಗಳು:
- ಮೊದಲೇ ಆಯ್ಕೆ ಮಾಡಿದ ಟಾಪ್ 3 ಎಸ್ಐಪಿ ಯೋಜನೆಗಳು
- 20,000 ಯೋಜನೆಗಳ ವಿಶ್ಲೇಷಣೆಯ ನಂತರ ಆಯ್ಕೆ ಮಾಡಲಾದ ಯೋಜನೆಗಳು
- ಆರೋಗ್ಯಕರ ಆದಾಯವನ್ನು ಗಳಿಸಿ
ತೆರಿಗೆ ಸೇವರ್
ಮೂರನೇ ಪರಿಹಾರತೆರಿಗೆದಾರ ಎರಡು ಕಟ್ಟುಇಕ್ವಿಟಿ ಮ್ಯೂಚುಯಲ್ ಫಂಡ್ಗಳು ಅದು ನೀಡುತ್ತದೆಹೂಡಿಕೆಯ ಅನುಕೂಲಗಳು ಮತ್ತು ತೆರಿಗೆ ಪ್ರಯೋಜನಗಳು. ಟ್ಯಾಕ್ಸ್ಸೇವರ್ ಮೂಲಕ, ಜನರು 1,50,000 ರೂಪಾಯಿಗಳವರೆಗೆ ತೆರಿಗೆ ವಿನಾಯಿತಿ ಪಡೆಯಬಹುದುವಿಭಾಗ 80 ಸಿ ನಆದಾಯ ತೆರಿಗೆ ಆಕ್ಟ್, 1961 ನಿರ್ದಿಷ್ಟ ಹಣಕಾಸು ವರ್ಷಕ್ಕೆ. ಬೀಯಿಂಗ್ತೆರಿಗೆ ಉಳಿತಾಯ ಹೂಡಿಕೆಗಳು, ಅವರು ಮೂರು ವರ್ಷಗಳ ಲಾಕ್-ಇನ್ ಅವಧಿಯನ್ನು ಹೊಂದಿದ್ದಾರೆ. ಅವುಗಳ ವೈಶಿಷ್ಟ್ಯಗಳು:
- ELSS ವರ್ಗದಾದ್ಯಂತ ವಿಶ್ಲೇಷಣೆಯ ನಂತರ ಆಯ್ಕೆ ಮಾಡಲಾಗಿದೆ
- ಮೊದಲೇ ಆಯ್ಕೆ ಮಾಡಿದ ಟಾಪ್ 2 ಅತ್ಯುತ್ತಮ ಇಕ್ವಿಟಿ ಲಿಂಕ್ಡ್ ಸೇವಿಂಗ್ ಸ್ಕೀಮ್ಸ್ (ಇಎಲ್ಎಸ್ಎಸ್)
- ತೆರಿಗೆ ಉಳಿಸಿ ಮತ್ತು ಆರೋಗ್ಯಕರ ಆದಾಯವನ್ನು ಗಳಿಸಿ
ಹೂಡಿಕೆಗಳನ್ನು ಪ್ರಾರಂಭಿಸಲು ಅತ್ಯುತ್ತಮ ಮ್ಯೂಚುಯಲ್ ಫಂಡ್ಗಳು
ಕೆಳಗೆ ಪಟ್ಟಿ ಇದೆಅತ್ಯುತ್ತಮ ಮ್ಯೂಚುಯಲ್ ಫಂಡ್ಗಳು ಒಮ್ಮೆ ಮೇಲಿನ ಆಸ್ತಿ / ಎಯುಎಂ ಹೊಂದಿರುವ ಹೂಡಿಕೆ ಮಾಡಬಹುದು500 ಕೋಟಿ ರೂ.
"The primary investment objective of the Scheme is to seek capital appreciation by investing predominantly in units of MLIIF - WGF. The Scheme may, at the discretion of the Investment Manager, also invest in the units of other similar overseas mutual fund schemes, which may constitute a significant part of its corpus. The Scheme may also invest a certain portion of its corpus in money market securities and/or units of money market/liquid schemes of DSP Merrill Lynch Mutual Fund, in order to meet liquidity requirements from time to time. However, there is no assurance that the investment objective of the Scheme will be realized." Below is the key information for DSP World Gold Fund Returns up to 1 year are on The primary investment objective of the Scheme is to seek capital appreciation by investing predominantly in units of BGF – USFEF. The Scheme may, at the discretion of the Investment Manager also invest in the units of other similar overseas mutual fund schemes, which may constitute a significant part of its corpus. The Scheme may also invest a certain portion of its corpus in money market securities and/or money market/liquid schemes of DSP BlackRock Mutual Fund, in order to meet liquidity requirements from time to time. However, there is no assurance that the investment objective of the Scheme will be realized. It shall be noted ‘similar overseas mutual fund schemes’ shall have investment objective, investment strategy and risk profile/consideration similar to those of BGF – USFEF. Research Highlights for DSP US Flexible Equity Fund Below is the key information for DSP US Flexible Equity Fund Returns up to 1 year are on The investment objective of the scheme is to provide long term growth from a portfolio of equity / equity related instruments of companies engaged either directly or indirectly in the infrastructure sector. Research Highlights for LIC MF Infrastructure Fund Below is the key information for LIC MF Infrastructure Fund Returns up to 1 year are on The Scheme seeks to provide long term capital appreciation by investing in a portfolio that is predominantly constituted of equity and equity related instruments of mid cap companies. However, there can be no assurance that the funds objectives will be achieved. Research Highlights for Invesco India Mid Cap Fund Below is the key information for Invesco India Mid Cap Fund Returns up to 1 year are on (Erstwhile UTI Pharma & Healthcare Fund) The Investment objective of the Scheme is capital appreciation through investments in equities and equity related instruments of the Pharma & Healthcare sectors. Research Highlights for UTI Healthcare Fund Below is the key information for UTI Healthcare Fund Returns up to 1 year are on 1. DSP World Gold Fund
DSP World Gold Fund
Growth Launch Date 14 Sep 07 NAV (30 Jul 26) ₹50.4247 ↑ 1.63 (3.33 %) Net Assets (Cr) ₹1,433 on 30 Jun 26 Category Equity - Global AMC DSP BlackRock Invmt Managers Pvt. Ltd. Rating ☆☆☆ Risk High Expense Ratio 1.41 Sharpe Ratio 1.22 Information Ratio -0.5 Alpha Ratio 2.12 Min Investment 1,000 Min SIP Investment 500 Exit Load 0-12 Months (1%),12 Months and above(NIL) Growth of 10,000 investment over the years.
Date Value 31 Jul 21 ₹10,000 31 Jul 22 ₹7,373 31 Jul 23 ₹9,366 31 Jul 24 ₹11,150 31 Jul 25 ₹16,504 31 Jul 26 ₹26,355 Returns for DSP World Gold Fund
absolute basis & more than 1 year are on CAGR (Compound Annual Growth Rate) basis. as on 30 Jul 26 Duration Returns 1 Month 2.3% 3 Month -12.7% 6 Month -17.8% 1 Year 62.8% 3 Year 43.6% 5 Year 22.1% 10 Year 15 Year Since launch 8.9% Historical performance (Yearly) on absolute basis
Year Returns 2024 167.1% 2023 15.9% 2022 7% 2021 -7.7% 2020 -9% 2019 31.4% 2018 35.1% 2017 -10.7% 2016 -4% 2015 52.7% Fund Manager information for DSP World Gold Fund
Name Since Tenure Kaivalya Nadkarni 1 May 25 1.17 Yr. Data below for DSP World Gold Fund as on 30 Jun 26
Equity Sector Allocation
Sector Value Basic Materials 94.47% Asset Allocation
Asset Class Value Cash 3.62% Equity 94.47% Debt 0% Other 1.91% Top Securities Holdings / Portfolio
Name Holding Value Quantity BGF World Gold I2
Investment Fund | -68% ₹1,141 Cr 1,005,044 VanEck Gold Miners ETF
- | GDX29% ₹490 Cr 573,719 Treps / Reverse Repo Investments
CBLO/Reverse Repo | -3% ₹54 Cr Net Receivables/Payables
Net Current Assets | -0% -₹6 Cr 2. DSP US Flexible Equity Fund
DSP US Flexible Equity Fund
Growth Launch Date 3 Aug 12 NAV (30 Jul 26) ₹90.0193 ↑ 0.77 (0.86 %) Net Assets (Cr) ₹1,291 on 30 Jun 26 Category Equity - Global AMC DSP BlackRock Invmt Managers Pvt. Ltd. Rating ☆☆☆☆☆ Risk High Expense Ratio 1.55 Sharpe Ratio 1.93 Information Ratio 0.15 Alpha Ratio -4.1 Min Investment 1,000 Min SIP Investment 500 Exit Load 0-12 Months (1%),12 Months and above(NIL) Growth of 10,000 investment over the years.
Date Value 31 Jul 21 ₹10,000 31 Jul 22 ₹10,023 31 Jul 23 ₹11,458 31 Jul 24 ₹13,332 31 Jul 25 ₹16,454 31 Jul 26 ₹22,370 Returns for DSP US Flexible Equity Fund
absolute basis & more than 1 year are on CAGR (Compound Annual Growth Rate) basis. as on 30 Jul 26 Duration Returns 1 Month -4.1% 3 Month 1.5% 6 Month 11.7% 1 Year 36.9% 3 Year 24.6% 5 Year 17.2% 10 Year 15 Year Since launch 17% Historical performance (Yearly) on absolute basis
Year Returns 2024 33.8% 2023 17.8% 2022 22% 2021 -5.9% 2020 24.2% 2019 22.6% 2018 27.5% 2017 -1.1% 2016 15.5% 2015 9.8% Fund Manager information for DSP US Flexible Equity Fund
Name Since Tenure Kaivalya Nadkarni 1 May 25 1.17 Yr. Data below for DSP US Flexible Equity Fund as on 30 Jun 26
Equity Sector Allocation
Sector Value Technology 33.05% Industrials 13.62% Financial Services 12.17% Communication Services 12.05% Consumer Cyclical 9.62% Health Care 7.65% Basic Materials 2.45% Energy 2.43% Asset Allocation
Asset Class Value Cash 6.96% Equity 93.02% Debt 0.01% Top Securities Holdings / Portfolio
Name Holding Value Quantity BGF US Flexible Equity I2
Investment Fund | -96% ₹1,265 Cr 1,784,131
↓ -32,921 Treps / Reverse Repo Investments
CBLO/Reverse Repo | -4% ₹59 Cr Net Receivables/Payables
Net Current Assets | -0% -₹2 Cr 3. LIC MF Infrastructure Fund
LIC MF Infrastructure Fund
Growth Launch Date 29 Feb 08 NAV (31 Jul 26) ₹54.5662 ↑ 0.75 (1.39 %) Net Assets (Cr) ₹1,137 on 30 Jun 26 Category Equity - Sectoral AMC LIC Mutual Fund Asset Mgmt Co Ltd Rating Risk High Expense Ratio 2.21 Sharpe Ratio 0.22 Information Ratio 0.58 Alpha Ratio 8.41 Min Investment 5,000 Min SIP Investment 1,000 Exit Load 0-1 Years (1%),1 Years and above(NIL) Growth of 10,000 investment over the years.
Date Value 31 Jul 21 ₹10,000 31 Jul 22 ₹11,519 31 Jul 23 ₹14,236 31 Jul 24 ₹26,350 31 Jul 25 ₹25,021 31 Jul 26 ₹27,470 Returns for LIC MF Infrastructure Fund
absolute basis & more than 1 year are on CAGR (Compound Annual Growth Rate) basis. as on 30 Jul 26 Duration Returns 1 Month -0.9% 3 Month 5.3% 6 Month 14.5% 1 Year 9.8% 3 Year 24.5% 5 Year 22.4% 10 Year 15 Year Since launch 9.7% Historical performance (Yearly) on absolute basis
Year Returns 2024 -3.7% 2023 47.8% 2022 44.4% 2021 7.9% 2020 46.6% 2019 -0.1% 2018 13.3% 2017 -14.6% 2016 42.2% 2015 -2.2% Fund Manager information for LIC MF Infrastructure Fund
Name Since Tenure Sumit Bhatnagar 7 Apr 26 0.23 Yr. Mahesh Bendre 1 Jul 24 2 Yr. Data below for LIC MF Infrastructure Fund as on 30 Jun 26
Equity Sector Allocation
Sector Value Industrials 37.05% Consumer Cyclical 20.88% Basic Materials 12.42% Utility 11.88% Communication Services 5.02% Financial Services 3.98% Real Estate 1.97% Health Care 1.89% Technology 1.08% Asset Allocation
Asset Class Value Cash 3.82% Equity 96.18% Top Securities Holdings / Portfolio
Name Holding Value Quantity Larsen & Toubro Ltd (Industrials)
Equity, Since 30 Apr 09 | LT4% ₹44 Cr 106,968
↓ -10,884 Garware Hi-Tech Films Ltd (Basic Materials)
Equity, Since 31 Aug 23 | 5006554% ₹40 Cr 65,325
↓ -7,684 Tata Motors Passenger Vehicles Ltd (Consumer Cyclical)
Equity, Since 28 Feb 26 | TMPV4% ₹39 Cr 982,891
↓ -332,760 Tata Motors Ltd (Consumer Cyclical)
Equity, Since 31 Oct 25 | TMCV4% ₹39 Cr 1,015,933
↑ 26,983 Tata Power Co Ltd (Utilities)
Equity, Since 29 Feb 24 | TATAPOWER3% ₹36 Cr 861,040
↑ 524,312 KSH International Ltd (Industrials)
Equity, Since 31 Dec 25 | KSHINTL3% ₹34 Cr 432,816
↑ 6,280 Siemens Energy India Ltd (Utilities)
Equity, Since 31 Aug 25 | ENRIN3% ₹34 Cr 87,106
↑ 24,800 JSW Infrastructure Ltd (Industrials)
Equity, Since 30 Apr 26 | JSWINFRA3% ₹31 Cr 1,133,858
↑ 745,681 Carraro India Ltd (Consumer Cyclical)
Equity, Since 31 Dec 24 | CARRARO3% ₹31 Cr 572,991 Bharat Dynamics Ltd Ordinary Shares (Industrials)
Equity, Since 31 Jan 26 | BDL3% ₹29 Cr 242,954
↑ 157,744 4. Invesco India Mid Cap Fund
Invesco India Mid Cap Fund
Growth Launch Date 19 Apr 07 NAV (31 Jul 26) ₹197.72 ↑ 0.24 (0.12 %) Net Assets (Cr) ₹13,767 on 30 Jun 26 Category Equity - Mid Cap AMC Invesco Asset Management (India) Private Ltd Rating ☆☆ Risk Moderately High Expense Ratio 1.82 Sharpe Ratio 0.19 Information Ratio 0 Alpha Ratio 0 Min Investment 5,000 Min SIP Investment 500 Exit Load 0-1 Years (1%),1 Years and above(NIL) Growth of 10,000 investment over the years.
Date Value 31 Jul 21 ₹10,000 31 Jul 22 ₹10,219 31 Jul 23 ₹12,600 31 Jul 24 ₹19,551 31 Jul 25 ₹21,829 31 Jul 26 ₹24,059 Returns for Invesco India Mid Cap Fund
absolute basis & more than 1 year are on CAGR (Compound Annual Growth Rate) basis. as on 30 Jul 26 Duration Returns 1 Month 1.3% 3 Month 10.5% 6 Month 14.9% 1 Year 10.2% 3 Year 24.1% 5 Year 19.2% 10 Year 15 Year Since launch 16.7% Historical performance (Yearly) on absolute basis
Year Returns 2024 6.3% 2023 43.1% 2022 34.1% 2021 0.5% 2020 43.1% 2019 24.4% 2018 3.8% 2017 -5.3% 2016 44.3% 2015 1.1% Fund Manager information for Invesco India Mid Cap Fund
Name Since Tenure Aditya Khemani 9 Nov 23 2.64 Yr. Data below for Invesco India Mid Cap Fund as on 30 Jun 26
Equity Sector Allocation
Sector Value Financial Services 30.63% Health Care 18.1% Consumer Cyclical 16.29% Industrials 15.05% Real Estate 8.55% Technology 4.13% Basic Materials 3.85% Utility 1.93% Asset Allocation
Asset Class Value Cash 1.46% Equity 98.54% Top Securities Holdings / Portfolio
Name Holding Value Quantity BSE Ltd (Financial Services)
Equity, Since 31 Dec 23 | BSE6% ₹750 Cr 1,809,521
↓ -89,716 Prestige Estates Projects Ltd (Real Estate)
Equity, Since 30 Nov 23 | PRESTIGE6% ₹725 Cr 5,296,606
↑ 150,291 The Federal Bank Ltd (Financial Services)
Equity, Since 31 Oct 22 | FEDERALBNK5% ₹644 Cr 22,304,132 AU Small Finance Bank Ltd (Financial Services)
Equity, Since 31 Jul 25 | AUBANK5% ₹585 Cr 5,936,790 Eternal Ltd (Consumer Cyclical)
Equity, Since 31 Aug 25 | ETERNAL4% ₹555 Cr 22,166,702
↑ 799,446 Global Health Ltd (Healthcare)
Equity, Since 30 Nov 23 | MEDANTA4% ₹544 Cr 4,577,395 InterGlobe Aviation Ltd (Industrials)
Equity, Since 30 Apr 24 | INDIGO4% ₹523 Cr 1,186,438
↑ 53,285 Max Healthcare Institute Ltd Ordinary Shares (Healthcare)
Equity, Since 31 Dec 22 | MAXHEALTH4% ₹506 Cr 5,241,044 L&T Finance Ltd (Financial Services)
Equity, Since 31 Dec 23 | LTF4% ₹483 Cr 16,854,973 IndusInd Bank Ltd (Financial Services)
Equity, Since 31 Jan 26 | INDUSINDBK4% ₹472 Cr 5,164,015 5. UTI Healthcare Fund
UTI Healthcare Fund
Growth Launch Date 28 Jun 99 NAV (31 Jul 26) ₹334.51 ↑ 0.45 (0.14 %) Net Assets (Cr) ₹1,308 on 30 Jun 26 Category Equity - Sectoral AMC UTI Asset Management Company Ltd Rating ☆ Risk High Expense Ratio 2.26 Sharpe Ratio 0.58 Information Ratio 0.2 Alpha Ratio 2.15 Min Investment 5,000 Min SIP Investment 500 Exit Load 0-1 Years (1%),1 Years and above(NIL) Growth of 10,000 investment over the years.
Date Value 31 Jul 21 ₹10,000 31 Jul 22 ₹8,749 31 Jul 23 ₹10,615 31 Jul 24 ₹15,542 31 Jul 25 ₹17,610 31 Jul 26 ₹19,855 Returns for UTI Healthcare Fund
absolute basis & more than 1 year are on CAGR (Compound Annual Growth Rate) basis. as on 30 Jul 26 Duration Returns 1 Month 2.6% 3 Month 14.3% 6 Month 22.9% 1 Year 12.7% 3 Year 23.2% 5 Year 14.7% 10 Year 15 Year Since launch 15% Historical performance (Yearly) on absolute basis
Year Returns 2024 -3.1% 2023 42.9% 2022 38.2% 2021 -12.3% 2020 19.1% 2019 67.4% 2018 1.2% 2017 -7.5% 2016 6.2% 2015 -9.7% Fund Manager information for UTI Healthcare Fund
Name Since Tenure Kamal Gada 2 May 22 4.17 Yr. Data below for UTI Healthcare Fund as on 30 Jun 26
Equity Sector Allocation
Sector Value Health Care 94.45% Asset Allocation
Asset Class Value Cash 5.55% Equity 94.45% Top Securities Holdings / Portfolio
Name Holding Value Quantity Sun Pharmaceuticals Industries Ltd (Healthcare)
Equity, Since 31 Oct 06 | SUNPHARMA9% ₹108 Cr 600,000 Divi's Laboratories Ltd (Healthcare)
Equity, Since 30 Sep 17 | DIVISLAB5% ₹59 Cr 88,814
↑ 28,076 Ajanta Pharma Ltd (Healthcare)
Equity, Since 31 Jul 17 | AJANTPHARM5% ₹57 Cr 195,295
↓ -41,216 Gland Pharma Ltd (Healthcare)
Equity, Since 30 Nov 20 | GLAND4% ₹48 Cr 215,251 Lupin Ltd (Healthcare)
Equity, Since 28 Feb 25 | LUPIN4% ₹46 Cr 203,834
↓ -6,166 Apollo Hospitals Enterprise Ltd (Healthcare)
Equity, Since 30 Apr 21 | APOLLOHOSP4% ₹43 Cr 53,000 Dr Reddy's Laboratories Ltd (Healthcare)
Equity, Since 28 Feb 18 | DRREDDY3% ₹38 Cr 290,000 Caplin Point Laboratories Ltd (Healthcare)
Equity, Since 31 Dec 23 | CAPLIPOINT3% ₹37 Cr 185,000
↑ 39,847 Alkem Laboratories Ltd (Healthcare)
Equity, Since 31 May 21 | ALKEM3% ₹37 Cr 68,000 Fortis Healthcare Ltd (Healthcare)
Equity, Since 31 Dec 20 | FORTIS3% ₹37 Cr 400,000
ಆದ್ದರಿಂದ, ನೀವು ಸ್ಮಾರ್ಟ್ ಹೂಡಿಕೆದಾರರಾಗಲು ಮತ್ತು ಹಣವನ್ನು ಗಳಿಸಲು ಬಯಸುವಿರಾ? ಫಿನ್ಕ್ಯಾಶ್.ಕಾಂನಲ್ಲಿ ನೋಂದಾಯಿಸಿ ಮತ್ತು ಹೂಡಿಕೆ ಮಾಡಿ ಮತ್ತು ನಿಮ್ಮ ಭವಿಷ್ಯಕ್ಕಾಗಿ ಸಂಪತ್ತನ್ನು ರಚಿಸಿ.
ಇಲ್ಲಿ ಒದಗಿಸಲಾದ ಮಾಹಿತಿಯು ನಿಖರವಾಗಿದೆ ಎಂದು ಖಚಿತಪಡಿಸಿಕೊಳ್ಳಲು ಎಲ್ಲಾ ಪ್ರಯತ್ನಗಳನ್ನು ಮಾಡಲಾಗಿದೆ. ಆದಾಗ್ಯೂ, ಡೇಟಾದ ಸರಿಯಾದ ಬಗ್ಗೆ ಯಾವುದೇ ಭರವಸೆಗಳನ್ನು ನೀಡಲಾಗುವುದಿಲ್ಲ. ಯಾವುದೇ ಹೂಡಿಕೆ ಮಾಡುವ ಮೊದಲು ದಯವಿಟ್ಟು ಸ್ಕೀಮ್ ಮಾಹಿತಿ ದಾಖಲೆಯೊಂದಿಗೆ ಪರಿಶೀಲಿಸಿ.


AMFI Registration No. 112358 | CIN: U74999MH2016PTC282153
Shepard Technologies Pvt. Ltd. (with ARN code 112358) makes no warranties or representations, express or implied, on products offered through the platform. It accepts no liability for any damages or losses, however caused, in connection with the use of, or on the reliance of its product or related services. Terms and conditions of the website are applicable.
©2026 Shepard Technologies Private Limited. All Rights Reserved
Research Highlights for DSP World Gold Fund