SOLUTIONS
EXPLORE FUNDS
CALCULATORS
fincash number+91-22-48913909Dashboard

മികച്ച ഇൻഡക്സ് ഫണ്ടുകൾ 2021

Updated on September 28, 2025 , 2442 views

ഇൻഡെക്സ് ഫണ്ടുകൾ a ഉപയോഗിച്ച് നിർമ്മിച്ച പോർട്ട്‌ഫോളിയോ മ്യൂച്വൽ ഫണ്ട് സ്കീമുകൾ റഫർ ചെയ്യുകവിപണി അടിസ്ഥാനമായി സൂചിക. മറ്റൊരു വിധത്തിൽ പറഞ്ഞാൽ, ഒരു സൂചിക ഫണ്ടിന്റെ പ്രകടനം ഒരു പ്രത്യേക സൂചികയുടെ പ്രകടനത്തെ ആശ്രയിച്ചിരിക്കുന്നു. ഈ സ്കീമുകൾ നിഷ്ക്രിയമായി കൈകാര്യം ചെയ്യുന്നു. ഈ ഫണ്ടുകളിൽ ഒരു പ്രത്യേക സൂചികയിൽ ഉള്ളതിന് സമാനമായ അനുപാതത്തിൽ ഓഹരികൾ അടങ്ങിയിരിക്കുന്നു.

ഇന്ത്യയിൽ, പല സ്കീമുകളും അവരുടെ പോർട്ട്ഫോളിയോ നിർമ്മിക്കുന്നതിനുള്ള അടിസ്ഥാനമായി നിഫ്റ്റി അല്ലെങ്കിൽ സെൻസെക്സ് ഉപയോഗിക്കുന്നു. ഉദാഹരണത്തിന്, നിഫ്റ്റി പോർട്ട്ഫോളിയോയിൽ എസ്ബിഐ ഓഹരികൾ 12% ആണെങ്കിൽ; നിഫ്റ്റി ഇൻഡക്സ് ഫണ്ടിന് 12% ഇക്വിറ്റി ഷെയറുകളും ഉണ്ടായിരിക്കും.

എന്താണ് ഒരു ഇൻഡെക്സ് ഫണ്ട്

ഒരു ഇൻഡെക്സ് ഫണ്ട് എന്നത് ഒരു പോർട്ട്ഫോളിയോയുടെ ഘടകങ്ങളുമായി പൊരുത്തപ്പെടുന്നതിനോ ട്രാക്ക് ചെയ്യുന്നതിനോ ഉള്ള ഒരു തരം മ്യൂച്വൽ ഫണ്ടാണ്.വിപണി സൂചിക, S&P നിഫ്റ്റി 50 (NIFTY) പോലുള്ളവ. ഒരു സൂചിക മ്യൂച്വൽ ഫണ്ട് വിശാലമായ പ്രദാനം ചെയ്യുമെന്ന് പറയപ്പെടുന്നുമാർക്കറ്റ് എക്സ്പോഷർ, കുറഞ്ഞ പ്രവർത്തനച്ചെലവും കുറഞ്ഞ പോർട്ട്ഫോളിയോ വിറ്റുവരവും. ഈ ഫണ്ടുകൾ പ്രത്യേക നിയമങ്ങളോ മാനദണ്ഡങ്ങളോ പാലിക്കുന്നു (ഉദാ. കാര്യക്ഷമമായ നികുതി മാനേജ്‌മെന്റ് അല്ലെങ്കിൽ ട്രാക്കിംഗ് പിശകുകൾ കുറയ്ക്കൽ) അത് വിപണിയുടെ അവസ്ഥ പരിഗണിക്കാതെ തന്നെ നിലനിൽക്കും.

ഇൻഡെക്സ് ഫണ്ടുകളിൽ നിക്ഷേപിക്കുന്നതിനുള്ള അപകടസാധ്യതകൾ

ഇൻഡെക്സ് മ്യൂച്വൽ ഫണ്ടുകളുടെ ഫ്ലെക്സിബിലിറ്റി ഇല്ല

ഒരു പ്രധാന പോരായ്മനിക്ഷേപിക്കുന്നു ഇൻഡെക്സ് ഫണ്ടുകളിൽ വഴക്കമില്ലായ്മയാണ്. ഫണ്ടുകൾ സൂചിക ട്രാക്ക് ചെയ്യുന്നതിനാൽ, വിപണിയിലെ അപാകതകളും സൂചികയുമായി ബന്ധമില്ലാത്ത ആശ്ചര്യങ്ങളും കാരണം ഉയർന്ന റിട്ടേൺ നേടാനുള്ള അവസരം അവർക്ക് നഷ്‌ടമാകും. സാധാരണഗതിയിൽ, മൂല്യമുള്ള സ്റ്റോക്കുകൾക്ക് ഒരു സൂചികയുടെ ഭാഗമാകാൻ വളരെ ബുദ്ധിമുട്ടായിരിക്കും.

risk-in-index-funds-2018

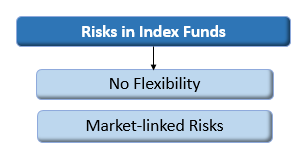
ഇൻഡെക്സ് മ്യൂച്വൽ ഫണ്ടുകളിലെ മാർക്കറ്റ് റിസ്ക്

ഇൻഡെക്സ് ഫണ്ടുകൾക്ക് വിപണിയുമായി നേരിട്ട് ബന്ധമുണ്ട്. അതിനാൽ, ഓഹരി വിപണികൾ മൊത്തത്തിൽ വീഴുമ്പോൾ, സൂചിക മ്യൂച്വൽ ഫണ്ടിന്റെ മൂല്യവും കുറയുന്നു.

കുറച്ച് ദോഷങ്ങളുണ്ടെങ്കിലും, നിക്ഷേപം നടത്താൻ ആഗ്രഹിക്കുന്ന നിക്ഷേപകർക്ക് മുൻനിര ഇൻഡക്സ് ഫണ്ടുകൾ പ്രയോജനകരമാണ്ഓഹരികൾ കുറഞ്ഞ അപകടസാധ്യതയോടെഘടകം. വിദഗ്ധരുടെ അഭിപ്രായത്തിൽ, നിക്ഷേപകർക്ക് അവരുടെ നിക്ഷേപം പരമാവധി പ്രയോജനപ്പെടുത്തുന്നതിന് ഇൻഡെക്സ് ഫണ്ടുകളുടെ 5-6% നിക്ഷേപ പോർട്ട്ഫോളിയോയിൽ ഉൾപ്പെടുത്താൻ നിർദ്ദേശിക്കുന്നു.

Ready to Invest?
Talk to our investment specialist
Disclaimer:
By submitting this form I authorize Fincash.com to call/SMS/email me about its products and I accept the terms of Privacy Policy and Terms & Conditions.

FY 21 - 22 വരെയുള്ള മികച്ച 6 മികച്ച പ്രകടനം നടത്തുന്ന സൂചിക ഫണ്ടുകൾ

FundNAVNet Assets (Cr)2024 (%)2023 (%)2022 (%)2021 (%)2020 (%)
ICICI Prudential Nifty Next 50 Index Fund Growth ₹59.6073
↑ 0.01
₹7,65027.226.30.129.514.3
IDBI Nifty Junior Index Fund Growth ₹50.3356
↑ 0.01
₹9626.925.70.429.613.7
Nippon India Balanced Advantage Fund Growth ₹176.794
↓ -0.18
₹9,3171317.55.115.711.2
Aditya Birla Sun Life Index Fund Growth ₹249.246
↓ -0.24
₹1,1219.520.6524.615.2
Franklin India Index Fund Nifty Plan Growth ₹198.583
↓ -0.17
₹7379.520.24.924.314.7
Nippon India Index Fund - Nifty Plan Growth ₹41.7791
↓ -0.04
₹2,6079.420.54.62414.3
Note: Returns up to 1 year are on absolute basis & more than 1 year are on CAGR basis. as on 30 Sep 25

Research Highlights & Commentary of 6 Funds showcased

CommentaryICICI Prudential Nifty Next 50 Index FundIDBI Nifty Junior Index FundNippon India Balanced Advantage FundAditya Birla Sun Life Index FundFranklin India Index Fund Nifty PlanNippon India Index Fund - Nifty Plan
Point 1Upper mid AUM (₹7,650 Cr).Bottom quartile AUM (₹96 Cr).Highest AUM (₹9,317 Cr).Lower mid AUM (₹1,121 Cr).Bottom quartile AUM (₹737 Cr).Upper mid AUM (₹2,607 Cr).
Point 2Established history (15+ yrs).Established history (15+ yrs).Established history (20+ yrs).Established history (23+ yrs).Oldest track record among peers (25 yrs).Established history (15+ yrs).
Point 3Top rated.Rating: 5★ (upper mid).Rating: 3★ (upper mid).Rating: 1★ (lower mid).Rating: 1★ (bottom quartile).Rating: 1★ (bottom quartile).
Point 4Risk profile: Moderately High.Risk profile: Moderately High.Risk profile: Moderately High.Risk profile: Moderately High.Risk profile: Moderately High.Risk profile: Moderately High.
Point 55Y return: 20.11% (top quartile).5Y return: 19.98% (upper mid).5Y return: 13.76% (bottom quartile).5Y return: 17.60% (upper mid).5Y return: 17.42% (lower mid).5Y return: 17.38% (bottom quartile).
Point 63Y return: 16.87% (top quartile).3Y return: 16.60% (upper mid).3Y return: 12.36% (bottom quartile).3Y return: 13.59% (upper mid).3Y return: 13.44% (bottom quartile).3Y return: 13.54% (lower mid).
Point 71Y return: -12.07% (bottom quartile).1Y return: -11.85% (bottom quartile).1Y return: 1.03% (top quartile).1Y return: -3.93% (upper mid).1Y return: -4.00% (lower mid).1Y return: -3.91% (upper mid).
Point 81M return: 3.07% (upper mid).1M return: 3.09% (top quartile).1M return: 1.35% (upper mid).1M return: 0.72% (bottom quartile).1M return: 0.72% (lower mid).1M return: 0.72% (bottom quartile).
Point 9Alpha: -1.04 (bottom quartile).Alpha: -0.92 (bottom quartile).Alpha: 0.00 (top quartile).Alpha: -0.50 (upper mid).Alpha: -0.50 (lower mid).Alpha: -0.49 (upper mid).
Point 10Sharpe: -0.86 (bottom quartile).Sharpe: -0.86 (bottom quartile).Sharpe: -0.64 (lower mid).Sharpe: -0.61 (upper mid).Sharpe: -0.61 (top quartile).Sharpe: -0.61 (upper mid).

ICICI Prudential Nifty Next 50 Index Fund

  • Upper mid AUM (₹7,650 Cr).
  • Established history (15+ yrs).
  • Top rated.
  • Risk profile: Moderately High.
  • 5Y return: 20.11% (top quartile).
  • 3Y return: 16.87% (top quartile).
  • 1Y return: -12.07% (bottom quartile).
  • 1M return: 3.07% (upper mid).
  • Alpha: -1.04 (bottom quartile).
  • Sharpe: -0.86 (bottom quartile).

IDBI Nifty Junior Index Fund

  • Bottom quartile AUM (₹96 Cr).
  • Established history (15+ yrs).
  • Rating: 5★ (upper mid).
  • Risk profile: Moderately High.
  • 5Y return: 19.98% (upper mid).
  • 3Y return: 16.60% (upper mid).
  • 1Y return: -11.85% (bottom quartile).
  • 1M return: 3.09% (top quartile).
  • Alpha: -0.92 (bottom quartile).
  • Sharpe: -0.86 (bottom quartile).

Nippon India Balanced Advantage Fund

  • Highest AUM (₹9,317 Cr).
  • Established history (20+ yrs).
  • Rating: 3★ (upper mid).
  • Risk profile: Moderately High.
  • 5Y return: 13.76% (bottom quartile).
  • 3Y return: 12.36% (bottom quartile).
  • 1Y return: 1.03% (top quartile).
  • 1M return: 1.35% (upper mid).
  • Alpha: 0.00 (top quartile).
  • Sharpe: -0.64 (lower mid).

Aditya Birla Sun Life Index Fund

  • Lower mid AUM (₹1,121 Cr).
  • Established history (23+ yrs).
  • Rating: 1★ (lower mid).
  • Risk profile: Moderately High.
  • 5Y return: 17.60% (upper mid).
  • 3Y return: 13.59% (upper mid).
  • 1Y return: -3.93% (upper mid).
  • 1M return: 0.72% (bottom quartile).
  • Alpha: -0.50 (upper mid).
  • Sharpe: -0.61 (upper mid).

Franklin India Index Fund Nifty Plan

  • Bottom quartile AUM (₹737 Cr).
  • Oldest track record among peers (25 yrs).
  • Rating: 1★ (bottom quartile).
  • Risk profile: Moderately High.
  • 5Y return: 17.42% (lower mid).
  • 3Y return: 13.44% (bottom quartile).
  • 1Y return: -4.00% (lower mid).
  • 1M return: 0.72% (lower mid).
  • Alpha: -0.50 (lower mid).
  • Sharpe: -0.61 (top quartile).

Nippon India Index Fund - Nifty Plan

  • Upper mid AUM (₹2,607 Cr).
  • Established history (15+ yrs).
  • Rating: 1★ (bottom quartile).
  • Risk profile: Moderately High.
  • 5Y return: 17.38% (bottom quartile).
  • 3Y return: 13.54% (lower mid).
  • 1Y return: -3.91% (upper mid).
  • 1M return: 0.72% (bottom quartile).
  • Alpha: -0.49 (upper mid).
  • Sharpe: -0.61 (upper mid).

*ഇൻഡക്സിനുള്ള ലിസ്റ്റ് ചുവടെയുണ്ട്മ്യൂച്വൽ ഫണ്ടുകൾ കുറഞ്ഞത് ഉള്ളത്15 കോടി അല്ലെങ്കിൽ നെറ്റ് അസറ്റുകളിൽ കൂടുതൽ.

1. ICICI Prudential Nifty Next 50 Index Fund

The fund's objective is to invest in companies whose securities are included in Nifty Junior Index and to endeavor to achieve the returns of the above index as closely as possible, though subject to tracking error. The fund intends to track only 90-95% of the Index i.e. it will always keep cash balance between 5-10% of the Net Asset to meet the redemption and other liquidity requirements. However, as and when the liquidity in the Index improves the fund intends to track up to 100% of the Index. The fund will not seek to outperform the CNX Nifty Junior. The objective is that the performance of the NAV of the fund should closely track the performance of the CNX Nifty Junior over the same period subject to tracking error.

Research Highlights for ICICI Prudential Nifty Next 50 Index Fund

  • Upper mid AUM (₹7,650 Cr).
  • Established history (15+ yrs).
  • Top rated.
  • Risk profile: Moderately High.
  • 5Y return: 20.11% (top quartile).
  • 3Y return: 16.87% (top quartile).
  • 1Y return: -12.07% (bottom quartile).
  • 1M return: 3.07% (upper mid).
  • Alpha: -1.04 (bottom quartile).
  • Sharpe: -0.86 (bottom quartile).
  • Information ratio: -6.65 (lower mid).
  • Top sector: Financial Services.
  • Top bond sector: Cash Equivalent.
  • Equity-heavy allocation (~100%).
  • Largest holding InterGlobe Aviation Ltd (~4.9%).

Below is the key information for ICICI Prudential Nifty Next 50 Index Fund

ICICI Prudential Nifty Next 50 Index Fund
Growth
Launch Date 25 Jun 10
NAV (30 Sep 25) ₹59.6073 ↑ 0.01   (0.01 %)
Net Assets (Cr) ₹7,650 on 31 Aug 25
Category Others - Index Fund
AMC ICICI Prudential Asset Management Company Limited
Rating
Risk Moderately High
Expense Ratio 0.66
Sharpe Ratio -0.87
Information Ratio -6.65
Alpha Ratio -1.04
Min Investment 5,000
Min SIP Investment 100
Exit Load 0-7 Days (0.25%),7 Days and above(NIL)

Growth of 10,000 investment over the years.

DateValue
30 Sep 20₹10,000
30 Sep 21₹15,601
30 Sep 22₹15,659
30 Sep 23₹16,615
30 Sep 24₹28,424

ICICI Prudential Nifty Next 50 Index Fund SIP Returns

   
My Monthly Investment:
Investment Tenure:
Years
Expected Annual Returns:
%
Total investment amount is ₹300,000
expected amount after 5 Years is ₹505,644.
Net Profit of ₹205,644
Invest Now

Returns for ICICI Prudential Nifty Next 50 Index Fund

Returns up to 1 year are on absolute basis & more than 1 year are on CAGR (Compound Annual Growth Rate) basis. as on 30 Sep 25

DurationReturns
1 Month 3.1%
3 Month -1.5%
6 Month 7.8%
1 Year -12.1%
3 Year 16.9%
5 Year 20.1%
10 Year
15 Year
Since launch 12.4%
Historical performance (Yearly) on absolute basis
YearReturns
2024 27.2%
2023 26.3%
2022 0.1%
2021 29.5%
2020 14.3%
2019 0.6%
2018 -8.8%
2017 45.7%
2016 7.6%
2015 6.2%
Fund Manager information for ICICI Prudential Nifty Next 50 Index Fund
NameSinceTenure
Nishit Patel18 Jan 214.62 Yr.
Ajaykumar Solanki1 Feb 241.58 Yr.
Ashwini Shinde18 Dec 240.7 Yr.

Data below for ICICI Prudential Nifty Next 50 Index Fund as on 31 Aug 25

Asset Allocation
Asset ClassValue
Cash0.31%
Equity99.65%
Top Securities Holdings / Portfolio
NameHoldingValueQuantity
InterGlobe Aviation Ltd (Industrials)
Equity, Since 30 Sep 16 | INDIGO
5%₹372 Cr659,740
↑ 9,279
Hindustan Aeronautics Ltd Ordinary Shares (Industrials)
Equity, Since 30 Sep 22 | HAL
4%₹277 Cr638,427
↑ 8,979
Divi's Laboratories Ltd (Healthcare)
Equity, Since 30 Sep 24 | DIVISLAB
3%₹262 Cr426,916
↑ 6,000
TVS Motor Co Ltd (Consumer Cyclical)
Equity, Since 30 Sep 23 | TVSMOTOR
3%₹259 Cr789,536
↑ 11,108
Vedanta Ltd (Basic Materials)
Equity, Since 31 Mar 21 | VEDL
3%₹240 Cr5,702,491
↑ 80,240
Avenue Supermarts Ltd (Consumer Defensive)
Equity, Since 30 Sep 17 | DMART
3%₹235 Cr494,677
↑ 6,957
Britannia Industries Ltd (Consumer Defensive)
Equity, Since 31 Mar 25 | BRITANNIA
3%₹231 Cr396,507
↑ 5,574
Indian Hotels Co Ltd (Consumer Cyclical)
Equity, Since 31 Mar 25 | INDHOTEL
3%₹224 Cr2,952,457
↑ 41,543
Varun Beverages Ltd (Consumer Defensive)
Equity, Since 31 Mar 23 | VBL
3%₹220 Cr4,506,354
↑ 63,408
Tata Power Co Ltd (Utilities)
Equity, Since 31 Aug 22 | TATAPOWER
3%₹211 Cr5,645,247
↑ 79,441

2. IDBI Nifty Junior Index Fund

The investment objective of the scheme is to invest in the stocks and equity related instruments comprising the CNX Nifty Junior Index in the same weights as these stocks represented in the Index with the intent to replicate the performance of the Total Returns Index of CNX Nifty Junior Index. The scheme will adopt a passive investment strategy and will seek to achieve the investment objective by minimizing the tracking error between the CNX Nifty Junior Index (Total Returns Index) and the scheme.

Research Highlights for IDBI Nifty Junior Index Fund

  • Bottom quartile AUM (₹96 Cr).
  • Established history (15+ yrs).
  • Rating: 5★ (upper mid).
  • Risk profile: Moderately High.
  • 5Y return: 19.98% (upper mid).
  • 3Y return: 16.60% (upper mid).
  • 1Y return: -11.85% (bottom quartile).
  • 1M return: 3.09% (top quartile).
  • Alpha: -0.92 (bottom quartile).
  • Sharpe: -0.86 (bottom quartile).
  • Information ratio: -5.79 (upper mid).
  • Top sector: Financial Services.
  • Top bond sector: Cash Equivalent.
  • Equity-heavy allocation (~100%).
  • Largest holding InterGlobe Aviation Ltd (~4.9%).

Below is the key information for IDBI Nifty Junior Index Fund

IDBI Nifty Junior Index Fund
Growth
Launch Date 20 Sep 10
NAV (30 Sep 25) ₹50.3356 ↑ 0.01   (0.01 %)
Net Assets (Cr) ₹96 on 31 Aug 25
Category Others - Index Fund
AMC IDBI Asset Management Limited
Rating
Risk Moderately High
Expense Ratio 0.86
Sharpe Ratio -0.86
Information Ratio -5.79
Alpha Ratio -0.92
Min Investment 5,000
Min SIP Investment 500
Exit Load NIL

Growth of 10,000 investment over the years.

DateValue
30 Sep 20₹10,000
30 Sep 21₹15,580
30 Sep 22₹15,683
30 Sep 23₹16,579
30 Sep 24₹28,205

IDBI Nifty Junior Index Fund SIP Returns

   
My Monthly Investment:
Investment Tenure:
Years
Expected Annual Returns:
%
Total investment amount is ₹300,000
expected amount after 5 Years is ₹493,520.
Net Profit of ₹193,520
Invest Now

Returns for IDBI Nifty Junior Index Fund

Returns up to 1 year are on absolute basis & more than 1 year are on CAGR (Compound Annual Growth Rate) basis. as on 30 Sep 25

DurationReturns
1 Month 3.1%
3 Month -1.5%
6 Month 7.8%
1 Year -11.8%
3 Year 16.6%
5 Year 20%
10 Year
15 Year
Since launch 11.4%
Historical performance (Yearly) on absolute basis
YearReturns
2024 26.9%
2023 25.7%
2022 0.4%
2021 29.6%
2020 13.7%
2019 0.5%
2018 -9.3%
2017 43.6%
2016 6.9%
2015 5.8%
Fund Manager information for IDBI Nifty Junior Index Fund
NameSinceTenure
Sumit Bhatnagar3 Oct 231.92 Yr.

Data below for IDBI Nifty Junior Index Fund as on 31 Aug 25

Asset Allocation
Asset ClassValue
Cash0.42%
Equity99.54%
Top Securities Holdings / Portfolio
NameHoldingValueQuantity
InterGlobe Aviation Ltd (Industrials)
Equity, Since 30 Sep 16 | INDIGO
5%₹5 Cr8,316
↑ 59
Hindustan Aeronautics Ltd Ordinary Shares (Industrials)
Equity, Since 30 Sep 22 | HAL
4%₹3 Cr8,061
↑ 63
Divi's Laboratories Ltd (Healthcare)
Equity, Since 30 Sep 24 | DIVISLAB
3%₹3 Cr5,372
↑ 35
TVS Motor Co Ltd (Consumer Cyclical)
Equity, Since 30 Sep 23 | TVSMOTOR
3%₹3 Cr9,956
↑ 127
Vedanta Ltd (Basic Materials)
Equity, Since 31 Mar 21 | VEDL
3%₹3 Cr71,736
↑ 437
Avenue Supermarts Ltd (Consumer Defensive)
Equity, Since 31 Oct 17 | DMART
3%₹3 Cr6,236
↑ 43
Britannia Industries Ltd (Consumer Defensive)
Equity, Since 31 Mar 25 | BRITANNIA
3%₹3 Cr4,995
↑ 49
Indian Hotels Co Ltd (Consumer Cyclical)
Equity, Since 31 Mar 25 | INDHOTEL
3%₹3 Cr37,276
↑ 555
Varun Beverages Ltd (Consumer Defensive)
Equity, Since 31 Mar 23 | VBL
3%₹3 Cr56,691
↑ 349
Tata Power Co Ltd (Utilities)
Equity, Since 31 Aug 22 | TATAPOWER
3%₹3 Cr71,337
↑ 551

3. Nippon India Balanced Advantage Fund

(Erstwhile Reliance NRI Equity Fund)

The investment objective of the Scheme is to generate optimal returns by investing in equity or equity related instruments primarily drawn from the Companies in the S&P BSE 200 Index. The Scheme may also invest in listed companies that are in the top 200 by market capitalization on the BSE. The Scheme may also invest in large IPO’s where the market capitalization of the Company making the IPO based on the Issue price would make such company to be a part of the top 200 companies listed on the BSE based on market capitalization. The fund will have the flexibility to invest in a broad range of companies with an objective to maximize the returns, at the same time trying to minimize the risk by reasonable diversification. The selection of the companies will be done so as to capture the growth in the Indian economy. The fund will be focusing on companies with relatively higher market capitalization and having good liquidity in the stock market.

Research Highlights for Nippon India Balanced Advantage Fund

  • Highest AUM (₹9,317 Cr).
  • Established history (20+ yrs).
  • Rating: 3★ (upper mid).
  • Risk profile: Moderately High.
  • 5Y return: 13.76% (bottom quartile).
  • 3Y return: 12.36% (bottom quartile).
  • 1Y return: 1.03% (top quartile).
  • 1M return: 1.35% (upper mid).
  • Alpha: 0.00 (top quartile).
  • Sharpe: -0.64 (lower mid).
  • Information ratio: 0.00 (top quartile).
  • Top sector: Financial Services.
  • Higher exposure to Cash Equivalent (bond sector) vs peer median.
  • Equity-heavy allocation (~67%).
  • High-quality debt (AAA/AA ~100%).
  • Largest holding HDFC Bank Ltd (~4.4%).

Below is the key information for Nippon India Balanced Advantage Fund

Nippon India Balanced Advantage Fund
Growth
Launch Date 15 Nov 04
NAV (30 Sep 25) ₹176.794 ↓ -0.18   (-0.10 %)
Net Assets (Cr) ₹9,317 on 31 Aug 25
Category Hybrid - Dynamic Allocation
AMC Nippon Life Asset Management Ltd.
Rating
Risk Moderately High
Expense Ratio 1.75
Sharpe Ratio -0.64
Information Ratio 0
Alpha Ratio 0
Min Investment 5,000
Min SIP Investment 100
Exit Load 0-1 Years (1%),1 Years and above(NIL)

Growth of 10,000 investment over the years.

DateValue
30 Sep 20₹10,000
30 Sep 21₹13,114
30 Sep 22₹13,434
30 Sep 23₹14,979
30 Sep 24₹18,861

Nippon India Balanced Advantage Fund SIP Returns

   
My Monthly Investment:
Investment Tenure:
Years
Expected Annual Returns:
%
Total investment amount is ₹300,000
expected amount after 5 Years is ₹426,080.
Net Profit of ₹126,080
Invest Now

Returns for Nippon India Balanced Advantage Fund

Returns up to 1 year are on absolute basis & more than 1 year are on CAGR (Compound Annual Growth Rate) basis. as on 30 Sep 25

DurationReturns
1 Month 1.3%
3 Month -0.3%
6 Month 5.2%
1 Year 1%
3 Year 12.4%
5 Year 13.8%
10 Year
15 Year
Since launch 14.8%
Historical performance (Yearly) on absolute basis
YearReturns
2024 13%
2023 17.5%
2022 5.1%
2021 15.7%
2020 11.2%
2019 8.3%
2018 0.4%
2017 25.2%
2016 6.4%
2015 0.9%
Fund Manager information for Nippon India Balanced Advantage Fund
NameSinceTenure
Ashutosh Bhargava7 May 187.33 Yr.
Kinjal Desai25 May 187.28 Yr.
Sushil Budhia31 Mar 214.42 Yr.

Data below for Nippon India Balanced Advantage Fund as on 31 Aug 25

Asset Allocation
Asset ClassValue
Cash11.38%
Equity67.18%
Debt21.42%
Equity Sector Allocation
SectorValue
Financial Services20.23%
Industrials10.73%
Consumer Cyclical9.81%
Consumer Defensive7.76%
Technology6.29%
Real Estate4.27%
Utility3.43%
Basic Materials3.34%
Energy3.19%
Health Care3.06%
Communication Services2.9%
Debt Sector Allocation
SectorValue
Cash Equivalent11.38%
Corporate11.22%
Government10.21%
Credit Quality
RatingValue
AA36.31%
AAA63.69%
Top Securities Holdings / Portfolio
NameHoldingValueQuantity
HDFC Bank Ltd (Financial Services)
Equity, Since 31 Oct 11 | HDFCBANK
4%₹406 Cr4,270,648
↓ -129,352
ICICI Bank Ltd (Financial Services)
Equity, Since 31 Aug 18 | ICICIBANK
4%₹377 Cr2,700,000
↓ -200,000
Infosys Ltd (Technology)
Equity, Since 31 May 09 | INFY
3%₹283 Cr1,922,950
Reliance Industries Ltd (Energy)
Equity, Since 31 May 18 | RELIANCE
3%₹251 Cr1,850,000
Bharti Airtel Ltd (Communication Services)
Equity, Since 31 Aug 18 | BHARTIARTL
3%₹236 Cr1,250,000
State Bank of India (Financial Services)
Equity, Since 31 Mar 09 | SBIN
3%₹236 Cr2,940,288
↑ 99,268
Mahindra & Mahindra Ltd (Consumer Cyclical)
Equity, Since 30 Nov 21 | M&M
2%₹210 Cr656,709
NTPC Ltd (Utilities)
Equity, Since 31 Mar 21 | NTPC
2%₹189 Cr5,769,300
Larsen & Toubro Ltd (Industrials)
Equity, Since 31 Jan 21 | LT
2%₹163 Cr454,017
↓ -10,478
ITC Ltd (Consumer Defensive)
Equity, Since 31 Jul 18 | ITC
2%₹147 Cr3,577,915
↑ 400,000

4. Aditya Birla Sun Life Index Fund

An Open-ended index-linked growth scheme with the objective to generate returns commensurate with the performance of Nifty subject to tracking errors.

Research Highlights for Aditya Birla Sun Life Index Fund

  • Lower mid AUM (₹1,121 Cr).
  • Established history (23+ yrs).
  • Rating: 1★ (lower mid).
  • Risk profile: Moderately High.
  • 5Y return: 17.60% (upper mid).
  • 3Y return: 13.59% (upper mid).
  • 1Y return: -3.93% (upper mid).
  • 1M return: 0.72% (bottom quartile).
  • Alpha: -0.50 (upper mid).
  • Sharpe: -0.61 (upper mid).
  • Information ratio: -15.09 (bottom quartile).
  • Higher exposure to Financial Services vs peer median.
  • Top bond sector: Cash Equivalent.
  • Equity-heavy allocation (~100%).
  • Largest holding HDFC Bank Ltd (~13.1%).

Below is the key information for Aditya Birla Sun Life Index Fund

Aditya Birla Sun Life Index Fund
Growth
Launch Date 18 Sep 02
NAV (30 Sep 25) ₹249.246 ↓ -0.24   (-0.10 %)
Net Assets (Cr) ₹1,121 on 31 Aug 25
Category Others - Index Fund
AMC Birla Sun Life Asset Management Co Ltd
Rating
Risk Moderately High
Expense Ratio 0.52
Sharpe Ratio -0.62
Information Ratio -15.09
Alpha Ratio -0.5
Min Investment 1,000
Min SIP Investment 100
Exit Load NIL

Growth of 10,000 investment over the years.

DateValue
30 Sep 20₹10,000
30 Sep 21₹15,710
30 Sep 22₹15,349
30 Sep 23₹17,707
30 Sep 24₹23,415
30 Sep 25₹22,496

Aditya Birla Sun Life Index Fund SIP Returns

   
My Monthly Investment:
Investment Tenure:
Years
Expected Annual Returns:
%
Total investment amount is ₹300,000
expected amount after 5 Years is ₹470,047.
Net Profit of ₹170,047
Invest Now

Returns for Aditya Birla Sun Life Index Fund

Returns up to 1 year are on absolute basis & more than 1 year are on CAGR (Compound Annual Growth Rate) basis. as on 30 Sep 25

DurationReturns
1 Month 0.7%
3 Month -3.3%
6 Month 5.3%
1 Year -3.9%
3 Year 13.6%
5 Year 17.6%
10 Year
15 Year
Since launch 15%
Historical performance (Yearly) on absolute basis
YearReturns
2024 9.5%
2023 20.6%
2022 5%
2021 24.6%
2020 15.2%
2019 12.4%
2018 3.2%
2017 28.5%
2016 3.1%
2015 -3.8%
Fund Manager information for Aditya Birla Sun Life Index Fund
NameSinceTenure
Priya Sridhar31 Dec 240.67 Yr.

Data below for Aditya Birla Sun Life Index Fund as on 31 Aug 25

Asset Allocation
Asset ClassValue
Cash0.33%
Equity99.67%
Top Securities Holdings / Portfolio
NameHoldingValueQuantity
HDFC Bank Ltd (Financial Services)
Equity, Since 30 Sep 07 | HDFCBANK
13%₹146 Cr1,539,448
↑ 31,464
ICICI Bank Ltd (Financial Services)
Equity, Since 31 Oct 09 | ICICIBANK
9%₹101 Cr719,575
↑ 14,706
Reliance Industries Ltd (Energy)
Equity, Since 30 Sep 07 | RELIANCE
8%₹93 Cr683,950
↑ 13,979
Infosys Ltd (Technology)
Equity, Since 30 Sep 07 | INFY
5%₹53 Cr363,627
↑ 7,432
Bharti Airtel Ltd (Communication Services)
Equity, Since 30 Sep 07 | BHARTIARTL
5%₹52 Cr275,151
↑ 5,624
Larsen & Toubro Ltd (Industrials)
Equity, Since 30 Sep 07 | LT
4%₹43 Cr118,534
↑ 2,422
ITC Ltd (Consumer Defensive)
Equity, Since 30 Sep 07 | ITC
3%₹39 Cr939,843
↑ 19,208
Tata Consultancy Services Ltd (Technology)
Equity, Since 30 Sep 07 | TCS
3%₹32 Cr103,099
↑ 2,107
State Bank of India (Financial Services)
Equity, Since 30 Sep 07 | SBIN
3%₹31 Cr387,867
↑ 7,927
Axis Bank Ltd (Financial Services)
Equity, Since 31 Mar 09 | AXISBANK
3%₹30 Cr288,912
↑ 5,905

5. Franklin India Index Fund Nifty Plan

The Investment Objective of the Scheme is to invest in companies whose securities are included in the Nifty and subject to tracking errors, endeavouring to attain results commensurate with the Nifty 50 under NSENifty Plan

Research Highlights for Franklin India Index Fund Nifty Plan

  • Bottom quartile AUM (₹737 Cr).
  • Oldest track record among peers (25 yrs).
  • Rating: 1★ (bottom quartile).
  • Risk profile: Moderately High.
  • 5Y return: 17.42% (lower mid).
  • 3Y return: 13.44% (bottom quartile).
  • 1Y return: -4.00% (lower mid).
  • 1M return: 0.72% (lower mid).
  • Alpha: -0.50 (lower mid).
  • Sharpe: -0.61 (top quartile).
  • Information ratio: -3.88 (upper mid).
  • Higher exposure to Financial Services vs peer median.
  • Top bond sector: Cash Equivalent.
  • Equity-heavy allocation (~100%).
  • Largest holding HDFC Bank Ltd (~13.1%).

Below is the key information for Franklin India Index Fund Nifty Plan

Franklin India Index Fund Nifty Plan
Growth
Launch Date 4 Aug 00
NAV (30 Sep 25) ₹198.583 ↓ -0.17   (-0.08 %)
Net Assets (Cr) ₹737 on 31 Aug 25
Category Others - Index Fund
AMC Franklin Templeton Asst Mgmt(IND)Pvt Ltd
Rating
Risk Moderately High
Expense Ratio 0.63
Sharpe Ratio -0.61
Information Ratio -3.88
Alpha Ratio -0.5
Min Investment 5,000
Min SIP Investment 500
Exit Load 0-30 Days (1%),30 Days and above(NIL)

Growth of 10,000 investment over the years.

DateValue
30 Sep 20₹10,000
30 Sep 21₹15,650
30 Sep 22₹15,293
30 Sep 23₹17,611
30 Sep 24₹23,255

Franklin India Index Fund Nifty Plan SIP Returns

   
My Monthly Investment:
Investment Tenure:
Years
Expected Annual Returns:
%
Total investment amount is ₹300,000
expected amount after 5 Years is ₹470,047.
Net Profit of ₹170,047
Invest Now

Returns for Franklin India Index Fund Nifty Plan

Returns up to 1 year are on absolute basis & more than 1 year are on CAGR (Compound Annual Growth Rate) basis. as on 30 Sep 25

DurationReturns
1 Month 0.7%
3 Month -3.3%
6 Month 5.2%
1 Year -4%
3 Year 13.4%
5 Year 17.4%
10 Year
15 Year
Since launch 12.6%
Historical performance (Yearly) on absolute basis
YearReturns
2024 9.5%
2023 20.2%
2022 4.9%
2021 24.3%
2020 14.7%
2019 12%
2018 3.2%
2017 28.3%
2016 3.3%
2015 -3.6%
Fund Manager information for Franklin India Index Fund Nifty Plan
NameSinceTenure
Sandeep Manam18 Oct 213.87 Yr.
Shyam Sriram26 Sep 240.93 Yr.

Data below for Franklin India Index Fund Nifty Plan as on 31 Aug 25

Asset Allocation
Asset ClassValue
Cash0.42%
Equity99.58%
Top Securities Holdings / Portfolio
NameHoldingValueQuantity
HDFC Bank Ltd (Financial Services)
Equity, Since 31 Jan 03 | HDFCBANK
13%₹96 Cr1,011,310
↑ 3,070
ICICI Bank Ltd (Financial Services)
Equity, Since 31 Jan 10 | ICICIBANK
9%₹66 Cr472,711
↑ 1,803
Reliance Industries Ltd (Energy)
Equity, Since 31 Jan 03 | RELIANCE
8%₹61 Cr449,308
↑ 1,678
Infosys Ltd (Technology)
Equity, Since 29 Feb 12 | INFY
5%₹35 Cr238,878
↑ 1,296
Bharti Airtel Ltd (Communication Services)
Equity, Since 31 Mar 04 | BHARTIARTL
5%₹34 Cr180,755
↑ 1,032
Larsen & Toubro Ltd (Industrials)
Equity, Since 30 Jun 12 | LT
4%₹28 Cr77,869
↑ 616
ITC Ltd (Consumer Defensive)
Equity, Since 31 Mar 11 | ITC
3%₹25 Cr617,412
↑ 4,882
Tata Consultancy Services Ltd (Technology)
Equity, Since 28 Feb 05 | TCS
3%₹21 Cr67,729
↑ 536
State Bank of India (Financial Services)
Equity, Since 31 Jan 03 | SBIN
3%₹20 Cr254,802
↑ 2,015
Axis Bank Ltd (Financial Services)
Equity, Since 30 Jun 09 | AXISBANK
3%₹20 Cr189,795
↑ 1,501

6. Nippon India Index Fund - Nifty Plan

The primary investment objective of the scheme is to replicate the composition of the Nifty 50, with a view to generate returns that are commensurate with the performance of the Nifty 50, subject to tracking errors.

Research Highlights for Nippon India Index Fund - Nifty Plan

  • Upper mid AUM (₹2,607 Cr).
  • Established history (15+ yrs).
  • Rating: 1★ (bottom quartile).
  • Risk profile: Moderately High.
  • 5Y return: 17.38% (bottom quartile).
  • 3Y return: 13.54% (lower mid).
  • 1Y return: -3.91% (upper mid).
  • 1M return: 0.72% (bottom quartile).
  • Alpha: -0.49 (upper mid).
  • Sharpe: -0.61 (upper mid).
  • Information ratio: -12.30 (bottom quartile).
  • Higher exposure to Financial Services vs peer median.
  • Top bond sector: Cash Equivalent.
  • Equity-heavy allocation (~100%).
  • Largest holding HDFC Bank Ltd (~13.1%).

Below is the key information for Nippon India Index Fund - Nifty Plan

Nippon India Index Fund - Nifty Plan
Growth
Launch Date 28 Sep 10
NAV (30 Sep 25) ₹41.7791 ↓ -0.04   (-0.10 %)
Net Assets (Cr) ₹2,607 on 31 Aug 25
Category Others - Index Fund
AMC Nippon Life Asset Management Ltd.
Rating
Risk Moderately High
Expense Ratio 0.49
Sharpe Ratio -0.61
Information Ratio -12.3
Alpha Ratio -0.49
Min Investment 5,000
Min SIP Investment 100
Exit Load 0-7 Days (0.25%),7 Days and above(NIL)

Growth of 10,000 investment over the years.

DateValue
30 Sep 20₹10,000
30 Sep 21₹15,650
30 Sep 22₹15,222
30 Sep 23₹17,556
30 Sep 24₹23,188

Nippon India Index Fund - Nifty Plan SIP Returns

   
My Monthly Investment:
Investment Tenure:
Years
Expected Annual Returns:
%
Total investment amount is ₹300,000
expected amount after 5 Years is ₹470,047.
Net Profit of ₹170,047
Invest Now

Returns for Nippon India Index Fund - Nifty Plan

Returns up to 1 year are on absolute basis & more than 1 year are on CAGR (Compound Annual Growth Rate) basis. as on 30 Sep 25

DurationReturns
1 Month 0.7%
3 Month -3.3%
6 Month 5.3%
1 Year -3.9%
3 Year 13.5%
5 Year 17.4%
10 Year
15 Year
Since launch 10%
Historical performance (Yearly) on absolute basis
YearReturns
2024 9.4%
2023 20.5%
2022 4.6%
2021 24%
2020 14.3%
2019 12.3%
2018 3.5%
2017 29%
2016 2.5%
2015 -3.9%
Fund Manager information for Nippon India Index Fund - Nifty Plan
NameSinceTenure
Himanshu Mange23 Dec 231.69 Yr.

Data below for Nippon India Index Fund - Nifty Plan as on 31 Aug 25

Asset Allocation
Asset ClassValue
Cash0.27%
Equity99.73%
Top Securities Holdings / Portfolio
NameHoldingValueQuantity
HDFC Bank Ltd (Financial Services)
Equity, Since 31 Oct 10 | HDFCBANK
13%₹341 Cr3,580,827
↑ 97,093
ICICI Bank Ltd (Financial Services)
Equity, Since 31 Oct 10 | ICICIBANK
9%₹234 Cr1,673,766
↑ 45,384
Reliance Industries Ltd (Energy)
Equity, Since 31 Oct 10 | RELIANCE
8%₹216 Cr1,590,899
↑ 43,137
Infosys Ltd (Technology)
Equity, Since 31 Oct 10 | INFY
5%₹124 Cr845,815
↑ 22,934
Bharti Airtel Ltd (Communication Services)
Equity, Since 31 Oct 10 | BHARTIARTL
5%₹121 Cr640,014
↑ 17,354
Larsen & Toubro Ltd (Industrials)
Equity, Since 29 Feb 12 | LT
4%₹99 Cr275,718
↑ 7,476
ITC Ltd (Consumer Defensive)
Equity, Since 29 Feb 12 | ITC
3%₹90 Cr2,186,120
↑ 59,277
Tata Consultancy Services Ltd (Technology)
Equity, Since 31 Oct 10 | TCS
3%₹74 Cr239,814
↑ 6,502
State Bank of India (Financial Services)
Equity, Since 31 Oct 10 | SBIN
3%₹72 Cr902,197
↑ 24,462
Axis Bank Ltd (Financial Services)
Equity, Since 31 Oct 10 | AXISBANK
3%₹70 Cr672,023
↑ 18,221

ഇൻഡെക്സ് മ്യൂച്വൽ ഫണ്ടുകളിൽ ഓൺലൈനിൽ എങ്ങനെ നിക്ഷേപിക്കാം?

  1. Fincash.com-ൽ ആജീവനാന്ത സൗജന്യ നിക്ഷേപ അക്കൗണ്ട് തുറക്കുക.

  2. നിങ്ങളുടെ രജിസ്ട്രേഷനും KYC പ്രക്രിയയും പൂർത്തിയാക്കുക

  3. രേഖകൾ അപ്‌ലോഡ് ചെയ്യുക (പാൻ, ആധാർ മുതലായവ).കൂടാതെ, നിങ്ങൾ നിക്ഷേപിക്കാൻ തയ്യാറാണ്!

    തുടങ്ങി

Disclaimer:
ഇവിടെ നൽകിയിരിക്കുന്ന വിവരങ്ങൾ കൃത്യമാണെന്ന് ഉറപ്പാക്കാൻ എല്ലാ ശ്രമങ്ങളും നടത്തിയിട്ടുണ്ട്. എന്നിരുന്നാലും, ഡാറ്റയുടെ കൃത്യത സംബന്ധിച്ച് യാതൊരു ഉറപ്പും നൽകുന്നില്ല. എന്തെങ്കിലും നിക്ഷേപം നടത്തുന്നതിന് മുമ്പ് സ്കീം വിവര രേഖ ഉപയോഗിച്ച് പരിശോധിക്കുക.
How helpful was this page ?
Rated 5, based on 1 reviews.
POST A COMMENT