ਮਿਉਚੁਅਲ ਫੰਡ ਬਨਾਮ ਸਟਾਕ
ਮਿਉਚੁਅਲ ਫੰਡ ਜਾਂ ਸਟਾਕ ਮਾਰਕੀਟ ਸਿੱਧੇ - ਕਿੱਥੇ ਨਿਵੇਸ਼ ਕਰਨਾ ਹੈ, ਇਹ ਸਭ ਤੋਂ ਪੁਰਾਣੀ ਬਹਿਸਾਂ ਵਿੱਚੋਂ ਇੱਕ ਹੈ ਜਦੋਂ ਇਹ ਨਿੱਜੀ ਦੀ ਗੱਲ ਆਉਂਦੀ ਹੈਵੈਲਥ ਮੈਨੇਜਮੈਂਟ. ਮਿਉਚੁਅਲ ਫੰਡ ਤੁਹਾਨੂੰ ਇੱਕ ਫੰਡ ਵਿੱਚ ਇੱਕ ਨਿਸ਼ਚਿਤ ਰਕਮ ਦਾ ਨਿਵੇਸ਼ ਕਰਨ ਦੀ ਇਜਾਜ਼ਤ ਦਿੰਦੇ ਹਨ ਜਿੱਥੇ ਫੰਡ ਪ੍ਰਬੰਧਕ ਆਪਣੀ ਮੁਹਾਰਤ ਦੀ ਵਰਤੋਂ ਕਰਦੇ ਹੋਏ ਗਾਹਕ ਦੇ ਪੈਸੇ ਨੂੰ ਵੱਖ-ਵੱਖ ਸਟਾਕਾਂ ਵਿੱਚ ਨਿਵੇਸ਼ ਕਰਨ ਲਈ ਵਰਤਦੇ ਹਨ ਤਾਂ ਜੋ ਰਿਟਰਨ ਦੀ ਉੱਚੀ ਦਰ ਪ੍ਰਾਪਤ ਕੀਤੀ ਜਾ ਸਕੇ।ਨਿਵੇਸ਼ ਸਟਾਕ ਬਾਜ਼ਾਰਾਂ ਵਿੱਚ ਤੁਹਾਨੂੰ ਉਪਭੋਗਤਾ ਦੁਆਰਾ ਸ਼ੇਅਰਾਂ 'ਤੇ ਕੀਤੇ ਨਿਵੇਸ਼ 'ਤੇ ਵਧੇਰੇ ਨਿਯੰਤਰਣ ਮਿਲਦਾ ਹੈ। ਹਾਲਾਂਕਿ, ਇਹ ਉਹਨਾਂ ਨੂੰ ਜੋਖਮਾਂ ਲਈ ਵਧੇਰੇ ਸੰਭਾਵਿਤ ਬਣਾਉਂਦਾ ਹੈ ਕਿਉਂਕਿ ਉਹਨਾਂ ਨੂੰ ਸਿੱਧੇ ਬਾਜ਼ਾਰਾਂ ਨਾਲ ਨਜਿੱਠਣਾ ਪੈਂਦਾ ਹੈ।
ਅੰਤਰ: ਮਿਉਚੁਅਲ ਫੰਡ ਬਨਾਮ ਸਟਾਕ/ਸ਼ੇਅਰ
1. ਮਿਉਚੁਅਲ ਫੰਡਾਂ ਅਤੇ ਸਟਾਕਾਂ ਨੂੰ ਸਮਝਣਾ
ਜਦੋਂ ਕਿਸੇ ਜੋਖਮ ਨਾਲ ਤੁਲਨਾ ਕੀਤੀ ਜਾਂਦੀ ਹੈਕਾਰਕ, ਸਟਾਕ ਮਿਉਚੁਅਲ ਫੰਡਾਂ ਨਾਲੋਂ ਕਿਤੇ ਵੱਧ ਜੋਖਮ ਵਾਲੇ ਹੁੰਦੇ ਹਨ। ਮਿਉਚੁਅਲ ਫੰਡਾਂ ਵਿੱਚ ਜੋਖਮ ਫੈਲਿਆ ਹੋਇਆ ਹੈ ਅਤੇ ਇਸਲਈ ਵਿਭਿੰਨ ਸਟਾਕਾਂ ਦੇ ਪੂਲਿੰਗ ਨਾਲ ਘਟਾਇਆ ਜਾਂਦਾ ਹੈ। ਸਟਾਕ ਦੇ ਨਾਲ, ਕਿਸੇ ਨੂੰ ਨਿਵੇਸ਼ ਕਰਨ ਤੋਂ ਪਹਿਲਾਂ ਵਿਆਪਕ ਖੋਜ ਕਰਨੀ ਪੈਂਦੀ ਹੈ, ਖਾਸ ਕਰਕੇ ਜੇ ਤੁਸੀਂ ਇੱਕ ਨਵੇਂ ਹੋਨਿਵੇਸ਼ਕ. ਫੇਰੀਫਿਨਕੈਸ਼ ਨਿਵੇਸ਼ਾਂ ਦੇ ਵੱਖ-ਵੱਖ ਖੇਤਰਾਂ ਬਾਰੇ ਹੋਰ ਵੇਰਵਿਆਂ ਲਈ। ਮਿਉਚੁਅਲ ਫੰਡਾਂ ਦੇ ਮਾਮਲੇ ਵਿੱਚ, ਖੋਜ ਕੀਤੀ ਜਾਂਦੀ ਹੈ, ਅਤੇ ਫੰਡ ਦਾ ਪ੍ਰਬੰਧਨ ਇੱਕ ਮਿਉਚੁਅਲ ਫੰਡ ਮੈਨੇਜਰ ਦੁਆਰਾ ਕੀਤਾ ਜਾਂਦਾ ਹੈ।

ਹਾਲਾਂਕਿ ਇਹ ਸੇਵਾ ਮੁਫਤ ਨਹੀਂ ਹੈ ਅਤੇ ਸਾਲਾਨਾ ਨਾਲ ਆਉਂਦੀ ਹੈਪ੍ਰਬੰਧਨ ਫੀਸ ਜੋ ਫੰਡ ਹਾਊਸ ਦੁਆਰਾ ਕੁੱਲ ਖਰਚੇ ਰਾਸ਼ਨ (TER) ਦੇ ਤਹਿਤ ਵਸੂਲਿਆ ਜਾਂਦਾ ਹੈ।
2. ਇੱਕ ਸ਼ੁਰੂਆਤੀ ਵਜੋਂ ਨਿਵੇਸ਼ ਕਰਨ ਵੇਲੇ
ਜੇਕਰ ਤੁਸੀਂ ਵਿੱਤੀ ਬਜ਼ਾਰਾਂ ਵਿੱਚ ਬਹੁਤ ਘੱਟ ਜਾਂ ਕੋਈ ਤਜਰਬਾ ਰੱਖਣ ਵਾਲੇ ਇੱਕ ਨਵੇਂ ਨਿਵੇਸ਼ਕ ਹੋ, ਤਾਂ ਮਿਉਚੁਅਲ ਫੰਡਾਂ ਨਾਲ ਸ਼ੁਰੂਆਤ ਕਰਨ ਦੀ ਸਲਾਹ ਦਿੱਤੀ ਜਾਂਦੀ ਹੈ ਕਿਉਂਕਿ ਨਾ ਸਿਰਫ਼ ਜੋਖਮ ਤੁਲਨਾਤਮਕ ਤੌਰ 'ਤੇ ਘੱਟ ਹੁੰਦਾ ਹੈ, ਸਗੋਂ ਇਸ ਲਈ ਵੀ ਕਿਉਂਕਿ ਫੈਸਲੇ ਇੱਕ ਮਾਹਰ ਦੁਆਰਾ ਲਏ ਜਾਂਦੇ ਹਨ। ਇਹਨਾਂ ਪੇਸ਼ੇਵਰਾਂ ਕੋਲ ਸੰਭਾਵੀ ਨਿਵੇਸ਼ ਦੇ ਦ੍ਰਿਸ਼ਟੀਕੋਣ ਨੂੰ ਮਾਪਣ ਲਈ ਵਿੱਤੀ ਡੇਟਾ ਦਾ ਵਿਸ਼ਲੇਸ਼ਣ ਅਤੇ ਵਿਆਖਿਆ ਕਰਨ ਦੀ ਸਮਝ ਹੈ।
3. ਸੰਬੰਧਿਤ ਲਾਗਤਾਂ
ਹਾਲਾਂਕਿ ਤੁਹਾਨੂੰ ਮਿਉਚੁਅਲ ਫੰਡ ਮੈਨੇਜਰਾਂ ਨੂੰ ਫੀਸ ਅਦਾ ਕਰਨੀ ਪਵੇਗੀ, ਇਸ ਦੇ ਉਲਟ ਸਟਾਕ ਦੇ ਮਾਮਲੇ ਵਿੱਚ ਜੋ ਤੁਸੀਂ ਵਿਅਕਤੀਗਤ ਤੌਰ 'ਤੇ ਖਰੀਦਦੇ ਹੋ,ਅਰਥ ਵਿਵਸਥਾ ਪੱਧਰ ਵੀ ਖੇਡ ਵਿੱਚ ਆ. ਇਹ ਸੱਚ ਹੈ ਕਿਸਰਗਰਮ ਪ੍ਰਬੰਧਨ ਫੰਡਾਂ ਦਾ ਇੱਕ ਅਜਿਹਾ ਮਾਮਲਾ ਹੈ ਜੋ ਮੁਫਤ ਨਹੀਂ ਆਉਂਦਾ। ਪਰ ਸੱਚਾਈ ਇਹ ਹੈ ਕਿ ਆਪਣੇ ਵੱਡੇ ਆਕਾਰ ਦੇ ਕਾਰਨ, ਮਿਉਚੁਅਲ ਫੰਡ ਬ੍ਰੋਕਰੇਜ ਚਾਰਜ ਦਾ ਇੱਕ ਛੋਟਾ ਜਿਹਾ ਹਿੱਸਾ ਅਦਾ ਕਰਦੇ ਹਨ ਜੋ ਇੱਕ ਵਿਅਕਤੀਸ਼ੇਅਰਧਾਰਕ ਦਲਾਲੀ ਲਈ ਭੁਗਤਾਨ ਕਰਦਾ ਹੈ. ਵਿਅਕਤੀਗਤ ਨਿਵੇਸ਼ਕਾਂ ਨੂੰ ਡੀਮੇਟ ਲਈ ਖਰਚੇ ਵੀ ਅਦਾ ਕਰਨੇ ਪੈਂਦੇ ਹਨ ਜਿਸਦੀ ਮਿਉਚੁਅਲ ਫੰਡਾਂ ਦੇ ਮਾਮਲੇ ਵਿੱਚ ਲੋੜ ਨਹੀਂ ਹੁੰਦੀ ਹੈ।
4. ਜੋਖਮ ਅਤੇ ਵਾਪਸੀ
ਇਹ ਪਹਿਲਾਂ ਹੀ ਸਥਾਪਿਤ ਕੀਤਾ ਗਿਆ ਹੈ ਕਿ ਮਿਉਚੁਅਲ ਫੰਡਾਂ ਵਿੱਚ ਪੋਰਟਫੋਲੀਓ ਵਿੱਚ ਵਿਭਿੰਨਤਾ ਕਰਕੇ ਜੋਖਮ ਨੂੰ ਘਟਾਉਣ ਦਾ ਫਾਇਦਾ ਹੁੰਦਾ ਹੈ।
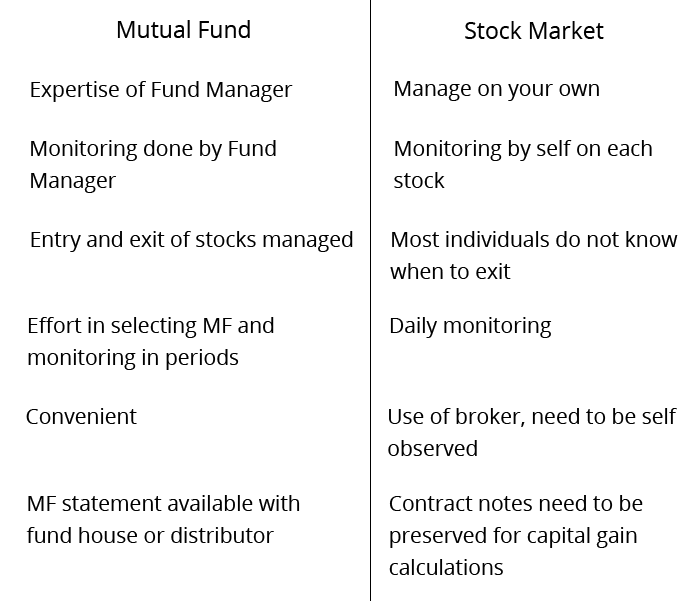
ਦੂਜੇ ਪਾਸੇ ਸਟਾਕ ਲਈ ਕਮਜ਼ੋਰ ਹਨਬਜ਼ਾਰ ਹਾਲਾਤ ਅਤੇ ਇੱਕ ਸਟਾਕ ਦੀ ਕਾਰਗੁਜ਼ਾਰੀ ਦੂਜੇ ਲਈ ਮੁਆਵਜ਼ਾ ਨਹੀਂ ਦੇ ਸਕਦੀ।
5. ਸ਼ਾਰਟ ਟਰਮ ਕੈਪੀਟਲ ਗੇਨ
ਸਟਾਕਾਂ ਵਿੱਚ ਨਿਵੇਸ਼ ਕਰਦੇ ਸਮੇਂ ਯਾਦ ਰੱਖੋ, ਤੁਸੀਂ ਆਪਣੀ ਛੋਟੀ ਮਿਆਦ 'ਤੇ 15 ਪ੍ਰਤੀਸ਼ਤ ਟੈਕਸ ਦਾ ਭੁਗਤਾਨ ਕਰਨ ਲਈ ਜਵਾਬਦੇਹ ਹੋਵੋਗੇਪੂੰਜੀ ਲਾਭ (STCG) ਜੇਕਰ ਤੁਸੀਂ ਇੱਕ ਸਾਲ ਦੀ ਮਿਆਦ ਦੇ ਅੰਦਰ ਆਪਣੇ ਸਟਾਕ ਵੇਚਦੇ ਹੋ। ਦੂਜੇ ਪਾਸੇ, ਫੰਡ ਦੁਆਰਾ ਵੇਚੇ ਗਏ ਸਟਾਕਾਂ 'ਤੇ ਪੂੰਜੀ ਲਾਭ 'ਤੇ ਕੋਈ ਟੈਕਸ ਨਹੀਂ ਹੈ। ਇਸਦਾ ਮਤਲਬ ਤੁਹਾਡੇ ਲਈ ਮਹੱਤਵਪੂਰਨ ਲਾਭ ਹੋ ਸਕਦਾ ਹੈ। ਬਚਾਇਆ ਹੋਇਆ ਟੈਕਸ ਤੁਹਾਡੇ ਲਈ ਇਸ ਨੂੰ ਹੋਰ ਨਿਵੇਸ਼ ਕਰਨ ਲਈ ਵੀ ਉਪਲਬਧ ਹੈ ਇਸ ਤਰ੍ਹਾਂ ਅੱਗੇ ਲਈ ਰਾਹ ਬਣਾਉਂਦੇ ਹਨਆਮਦਨ ਨਿਵੇਸ਼ ਦੁਆਰਾ ਪੀੜ੍ਹੀ. ਪਰ ਤੁਹਾਨੂੰ ਉਸ ਛੋਟੀ ਮਿਆਦ ਦੇ ਪੂੰਜੀ ਲਾਭ ਟੈਕਸ ਦਾ ਭੁਗਤਾਨ ਕਰਨ ਤੋਂ ਬਚਣ ਲਈ ਇੱਕ ਸਾਲ ਤੋਂ ਵੱਧ ਸਮੇਂ ਲਈ ਆਪਣੀ ਇਕੁਇਟੀ ਨੂੰ ਫੜੀ ਰੱਖਣਾ ਹੋਵੇਗਾ।
6. ਲੰਬੀ ਮਿਆਦ ਦਾ ਪੂੰਜੀ ਲਾਭ
ਲੰਮਾ ਸਮਾਂਪੂੰਜੀ ਲਾਭ (LTCG) 1 ਲੱਖ ਤੋਂ ਵੱਧ ਲਾਭਾਂ ਲਈ 10% ਟੈਕਸ ਲਗਾਇਆ ਜਾਂਦਾ ਹੈ (ਜਿਵੇਂ ਕਿ 2018 ਦੇ ਬਜਟ ਵਿੱਚ ਐਲਾਨ ਕੀਤਾ ਗਿਆ ਹੈ)। ਜਿਸਦਾ ਮਤਲਬ ਹੈ ਕਿ ਜੇਕਰ ਇੱਕ ਸਾਲ ਵਿੱਚ ਰਕਮ 1 ਲੱਖ ਤੋਂ ਵੱਧ ਹੈ ਤਾਂ ਇੱਕ ਸਾਲ (ਲੰਮੀ ਮਿਆਦ) ਵਿੱਚ ਹੋਏ ਲਾਭਾਂ 'ਤੇ ਟੈਕਸ ਦਾ ਭੁਗਤਾਨ ਕਰਨਾ ਪੈਂਦਾ ਹੈ।ਫਲੈਟ 10% ਦੀ ਦਰ.
7. ਆਪਣੇ ਨਿਵੇਸ਼ 'ਤੇ ਨਿਯੰਤਰਣ
ਮਿਉਚੁਅਲ ਫੰਡਾਂ ਦੇ ਮਾਮਲੇ ਵਿੱਚ, ਸਟਾਕਾਂ ਦੀ ਚੋਣ ਅਤੇ ਉਹਨਾਂ ਦੇ ਵਪਾਰ ਨਾਲ ਸਬੰਧਤ ਫੈਸਲਾ ਸਿਰਫ ਫੰਡ ਮੈਨੇਜਰ ਦੇ ਹੱਥ ਵਿੱਚ ਹੁੰਦਾ ਹੈ। ਤੁਹਾਡੇ ਕੋਲ ਇਹ ਨਿਯੰਤਰਣ ਨਹੀਂ ਹੈ ਕਿ ਕਿਹੜਾ ਸਟਾਕ ਚੁਣਿਆ ਜਾਣਾ ਹੈ ਅਤੇ ਕਿਸ ਮਿਆਦ ਲਈ. ਇੱਕ ਨਿਵੇਸ਼ਕ ਵਜੋਂ, ਜੇਕਰ ਤੁਸੀਂਮਿਉਚੁਅਲ ਫੰਡਾਂ ਵਿੱਚ ਨਿਵੇਸ਼ ਕਰੋ ਤੁਹਾਡੇ ਕੋਲ ਤੁਹਾਡੇ ਪੋਰਟਫੋਲੀਓ ਵਿੱਚ ਮੌਜੂਦ ਕੁਝ ਸਟਾਕਾਂ ਤੋਂ ਬਾਹਰ ਨਿਕਲਣ ਦਾ ਵਿਕਲਪ ਨਹੀਂ ਹੈ। ਸਟਾਕਾਂ ਦੀ ਕਿਸਮਤ ਨਾਲ ਸਬੰਧਤ ਫੈਸਲੇ ਫੰਡ ਮੈਨੇਜਰ ਦੇ ਹੱਥਾਂ ਵਿੱਚ ਰਹਿੰਦੇ ਹਨ। ਇਸ ਤਰੀਕੇ ਨਾਲ, ਸਟਾਕਾਂ ਵਿੱਚ ਨਿਵੇਸ਼ ਕਰਨ ਵਾਲੇ ਵਿਅਕਤੀ ਦਾ ਆਪਣੇ ਨਿਵੇਸ਼ ਉੱਤੇ ਮਿਉਚੁਅਲ ਫੰਡਾਂ ਵਿੱਚ ਨਿਵੇਸ਼ ਕਰਨ ਵਾਲੇ ਨਿਵੇਸ਼ਕ ਨਾਲੋਂ ਵਧੇਰੇ ਨਿਯੰਤਰਣ ਹੁੰਦਾ ਹੈ।
8. ਵਿਭਿੰਨਤਾ
ਇੱਕ ਚੰਗੀ-ਵਿਭਿੰਨਤਾ ਵਾਲੇ ਪੋਰਟਫੋਲੀਓ ਵਿੱਚ ਘੱਟੋ-ਘੱਟ 25 ਤੋਂ 30 ਸਟਾਕ ਸ਼ਾਮਲ ਹੋਣੇ ਚਾਹੀਦੇ ਹਨ ਪਰ ਇਹ ਇੱਕ ਛੋਟੇ ਨਿਵੇਸ਼ਕ ਲਈ ਇੱਕ ਵੱਡੀ ਮੰਗ ਹੋਵੇਗੀ। ਮਿਉਚੁਅਲ ਫੰਡਾਂ ਦੇ ਨਾਲ, ਛੋਟੇ ਫੰਡਾਂ ਵਾਲੇ ਨਿਵੇਸ਼ਕ ਵੀ ਵਿਭਿੰਨ ਪੋਰਟਫੋਲੀਓ ਪ੍ਰਾਪਤ ਕਰ ਸਕਦੇ ਹਨ। ਇੱਕ ਫੰਡ ਦੀਆਂ ਇਕਾਈਆਂ ਖਰੀਦਣਾ ਤੁਹਾਨੂੰ ਬਹੁਤ ਸਾਰੇ ਸਟਾਕਾਂ ਵਿੱਚ ਨਿਵੇਸ਼ ਕਰਨ ਦੀ ਇਜਾਜ਼ਤ ਦਿੰਦਾ ਹੈ, ਬਿਨਾਂ ਇੱਕ ਵਿਸ਼ਾਲ ਫੰਡ ਨਿਵੇਸ਼ ਕੀਤੇ।
Talk to our investment specialist
9. ਸਮਾਂ ਅਤੇ ਖੋਜ
ਜਦੋਂ ਤੁਸੀਂ ਸਿੱਧੇ ਨਿਵੇਸ਼ ਕਰਦੇ ਹੋ, ਤਾਂ ਤੁਹਾਨੂੰ ਆਪਣੇ ਸਟਾਕ ਵਿੱਚ ਬਹੁਤ ਜ਼ਿਆਦਾ ਸਮਾਂ ਅਤੇ ਖੋਜ ਕਰਨ ਦੀ ਜ਼ਰੂਰਤ ਹੋਏਗੀ ਜਦੋਂ ਕਿ ਮਿਉਚੁਅਲ ਫੰਡਾਂ ਦੇ ਮਾਮਲੇ ਵਿੱਚ ਤੁਸੀਂ ਪੈਸਿਵ ਹੋ ਸਕਦੇ ਹੋ। ਫੰਡ ਮੈਨੇਜਰ ਉਹ ਹੁੰਦਾ ਹੈ ਜੋ ਤੁਹਾਡੇ ਪੋਰਟਫੋਲੀਓ ਦਾ ਪ੍ਰਬੰਧਨ ਕਰਨ ਲਈ ਆਪਣਾ ਸਮਾਂ ਲਗਾਉਂਦਾ ਹੈ।
10. ਨਿਵੇਸ਼ ਟ੍ਰੈਕਿੰਗ
ਮਿਉਚੁਅਲ ਫੰਡਾਂ ਵਿੱਚ ਨਿਵੇਸ਼ ਦੇ ਨਾਲ, ਤੁਹਾਨੂੰ ਇੱਕ ਫੰਡ ਮੈਨੇਜਰ ਦਾ ਫਾਇਦਾ ਹੁੰਦਾ ਹੈ ਜਿਸ ਕੋਲ ਖੇਤਰ ਵਿੱਚ ਵਿਆਪਕ ਮੁਹਾਰਤ ਅਤੇ ਤਜਰਬਾ ਹੈ। ਭਾਵੇਂ ਇਹ ਸਟਾਕਾਂ ਨੂੰ ਚੁਣ ਰਿਹਾ ਹੈ ਜਾਂ ਉਹਨਾਂ ਦੀ ਨਿਗਰਾਨੀ ਕਰ ਰਿਹਾ ਹੈ ਅਤੇ ਅਲਾਟਮੈਂਟ ਕਰ ਰਿਹਾ ਹੈ, ਤੁਹਾਨੂੰ ਇਸ ਬਾਰੇ ਚਿੰਤਾ ਕਰਨ ਦੀ ਕੋਈ ਲੋੜ ਨਹੀਂ ਹੈ। ਇਹ ਸੇਵਾ ਸਟਾਕ ਨਿਵੇਸ਼ਾਂ ਦੇ ਮਾਮਲੇ ਵਿੱਚ ਉਪਲਬਧ ਨਹੀਂ ਹੈ। ਤੁਸੀਂ ਆਪਣੇ ਨਿਵੇਸ਼ ਨੂੰ ਚੁਣਨ ਅਤੇ ਟਰੈਕ ਕਰਨ ਲਈ ਜ਼ਿੰਮੇਵਾਰ ਹੋ।
11. ਨਿਵੇਸ਼ ਹੋਰਾਈਜ਼ਨ
ਮਿਉਚੁਅਲ ਫੰਡਾਂ ਵਿੱਚ ਨਿਵੇਸ਼ ਕਰਦੇ ਸਮੇਂ, ਯਾਦ ਰੱਖੋ ਕਿ ਤੁਹਾਨੂੰ ਚੰਗੇ ਰਿਟਰਨ ਪੈਦਾ ਕਰਨ ਲਈ ਫੰਡਾਂ ਨੂੰ ਘੱਟੋ-ਘੱਟ 8-10 ਸਾਲ ਦੇਣੇ ਪੈਣਗੇ ਕਿਉਂਕਿ ਇਹਨਾਂ ਵਿੱਚ ਲੰਬੇ ਸਮੇਂ ਦੀ ਵਿਕਾਸ ਦਰ ਹੁੰਦੀ ਹੈ। ਸਟਾਕਾਂ ਦੇ ਮਾਮਲੇ ਵਿੱਚ, ਜੇਕਰ ਤੁਸੀਂ ਸਹੀ ਸਟਾਕਾਂ ਦੀ ਚੋਣ ਕਰਦੇ ਹੋ ਅਤੇ ਉਹਨਾਂ ਨੂੰ ਸਹੀ ਸਮੇਂ 'ਤੇ ਵੇਚਦੇ ਹੋ ਤਾਂ ਤੁਸੀਂ ਜਲਦੀ ਅਤੇ ਵਧੀਆ ਰਿਟਰਨ ਪ੍ਰਾਪਤ ਕਰ ਸਕਦੇ ਹੋ।
ਇਸ ਸਭ ਦੇ ਬਾਵਜੂਦ ਜੇਕਰ ਸਟਾਕ ਮਾਰਕੀਟ ਅਤੇ ਇਸ ਦੀਆਂ ਪੇਚੀਦਗੀਆਂ ਕੁਝ ਅਜਿਹਾ ਹਨ ਜਿਸ ਤੋਂ ਇੱਕ ਵਿਅਕਤੀ ਜਾਣੂ ਹੈ, ਤਾਂ ਉਹ ਸਿੱਧੇ ਨਿਵੇਸ਼ ਕਰ ਸਕਦੇ ਹਨ। ਉਹਨਾਂ ਨੂੰ ਇੱਕ ਲੰਬੀ ਮਿਆਦ ਦੀ ਖੇਡ ਖੇਡਣ ਲਈ ਤਿਆਰ ਹੋਣਾ ਚਾਹੀਦਾ ਹੈ ਜਿੱਥੇ ਇੱਕ ਸਟਾਕ ਤੁਰੰਤ ਰਿਟਰਨ ਪ੍ਰਦਾਨ ਨਹੀਂ ਕਰਦਾ ਹੈ ਅਤੇ ਉਹਨਾਂ ਵਿੱਚ ਜੋਖਮ ਲਈ ਵੱਧਦੀ ਭੁੱਖ ਵੀ ਹੋਣੀ ਚਾਹੀਦੀ ਹੈ। ਮਿਉਚੁਅਲ ਫੰਡਾਂ ਵਿੱਚ ਨਿਵੇਸ਼ਕਾਂ ਦੇ ਉਲਟ, ਉਹਨਾਂ ਕੋਲ ਮੁਹਾਰਤ ਨਹੀਂ ਹੈਸਮਾਰਟ ਨਿਵੇਸ਼ ਜੋ ਫੰਡ ਮੈਨੇਜਰ ਪ੍ਰਦਾਨ ਕਰ ਸਕਦੇ ਹਨ। ਇੱਥੋਂ ਤੱਕ ਕਿ ਸਭ ਤੋਂ ਵਧੀਆ ਸਮੇਂ ਵਿੱਚ, ਸਟਾਕਾਂ ਵਿੱਚ ਨਿਵੇਸ਼ ਇੱਕ ਜੋਖਮ ਹੁੰਦਾ ਹੈ। ਮੁਕਾਬਲਤਨ ਔਖੇ ਸਮੇਂ ਵਿੱਚ, ਪੋਰਟਫੋਲੀਓ ਵਿਭਿੰਨਤਾ, ਪੇਸ਼ੇਵਰ ਪ੍ਰਬੰਧਨ ਅਤੇ ਨਿਰੰਤਰ ਨਿਗਰਾਨੀ ਦੇ ਫਾਇਦੇ ਦੇ ਕਾਰਨ ਮਿਉਚੁਅਲ ਫੰਡਾਂ ਵਿੱਚ ਨਿਵੇਸ਼ ਕਰਨਾ ਬਿਹਤਰ ਹੈ।
ਮਿਉਚੁਅਲ ਫੰਡਾਂ ਜਾਂ ਸਟਾਕਾਂ ਵਿਚਕਾਰ ਚੋਣ ਆਮ ਤੌਰ 'ਤੇ ਨਿੱਜੀ ਕਾਰਕਾਂ ਜਿਵੇਂ ਕਿ ਟਰੱਸਟ ਅਤੇ ਵਿਅਕਤੀ ਦੀ ਜੋਖਮ ਲੈਣ ਦੀ ਯੋਗਤਾ 'ਤੇ ਉਬਲਦੀ ਹੈ। ਇਹ ਸਭ ਵਿਕਲਪਾਂ ਨੂੰ ਧਿਆਨ ਨਾਲ ਤੋਲ ਕੇ ਬਹੁਤ ਸੋਚ-ਸਮਝ ਕੇ ਲਿਆ ਜਾਣ ਵਾਲਾ ਫੈਸਲਾ ਹੈ। ਹਾਲਾਂਕਿ ਇੱਕ ਵਿਅਕਤੀ ਲਈ ਜੋ ਮਹੱਤਵਪੂਰਨ ਹੈ ਉਹ ਹੈ ਨਿੱਜੀ ਦੌਲਤ ਪ੍ਰਬੰਧਨ ਵਿੱਚ ਡੁੱਬਣ ਦਾ ਫੈਸਲਾ ਅਤੇ ਆਪਣੀ ਬਚਤ ਨੂੰ ਮਿਉਚੁਅਲ ਫੰਡਾਂ ਜਾਂ ਸਟਾਕਾਂ ਦੁਆਰਾ ਉਪਯੋਗੀ ਬਣਾਉਣ ਦੀ ਕੋਸ਼ਿਸ਼ ਕਰਨਾ, ਨਾ ਕਿ ਇਸ 'ਤੇ ਬੈਠਣਾ।
FY 22 - 23 ਵਿੱਚ ਚੋਟੀ ਦੇ ਇਕੁਇਟੀ MF ਨਿਵੇਸ਼
Fund NAV Net Assets (Cr) 3 MO (%) 6 MO (%) 1 YR (%) 3 YR (%) 5 YR (%) 2024 (%) SBI PSU Fund Growth ₹36.7055
↑ 0.18 ₹5,817 6.8 17.1 33.3 34.1 28.3 11.3 DSP World Gold Fund Growth ₹60.3973
↓ -2.23 ₹1,756 32.8 78.1 143 56.3 28.1 167.1 ICICI Prudential Infrastructure Fund Growth ₹198.6
↑ 0.98 ₹8,134 -1.3 2.8 17.4 25.2 26.8 6.7 Note: Returns up to 1 year are on absolute basis & more than 1 year are on CAGR basis. as on 18 Feb 26 Research Highlights & Commentary of 3 Funds showcased
Commentary SBI PSU Fund DSP World Gold Fund ICICI Prudential Infrastructure Fund Point 1 Lower mid AUM (₹5,817 Cr). Bottom quartile AUM (₹1,756 Cr). Highest AUM (₹8,134 Cr). Point 2 Established history (15+ yrs). Established history (18+ yrs). Oldest track record among peers (20 yrs). Point 3 Rating: 2★ (bottom quartile). Top rated. Rating: 3★ (lower mid). Point 4 Risk profile: High. Risk profile: High. Risk profile: High. Point 5 5Y return: 28.26% (upper mid). 5Y return: 28.10% (lower mid). 5Y return: 26.82% (bottom quartile). Point 6 3Y return: 34.12% (lower mid). 3Y return: 56.28% (upper mid). 3Y return: 25.17% (bottom quartile). Point 7 1Y return: 33.26% (lower mid). 1Y return: 143.03% (upper mid). 1Y return: 17.42% (bottom quartile). Point 8 Alpha: -0.22 (bottom quartile). Alpha: 1.32 (upper mid). Alpha: 0.00 (lower mid). Point 9 Sharpe: 0.33 (lower mid). Sharpe: 3.42 (upper mid). Sharpe: 0.12 (bottom quartile). Point 10 Information ratio: -0.47 (lower mid). Information ratio: -0.67 (bottom quartile). Information ratio: 0.00 (upper mid). SBI PSU Fund
DSP World Gold Fund
ICICI Prudential Infrastructure Fund
*ਹੇਠਾਂ ਦੀ ਸੂਚੀ ਹੈਵਧੀਆ ਮਿਉਚੁਅਲ ਫੰਡ 5 ਸਾਲ ਦੇ ਆਧਾਰ 'ਤੇਸੀ.ਏ.ਜੀ.ਆਰ/ ਸਲਾਨਾ ਅਤੇ AUM > 100 ਕਰੋੜ। The objective of the scheme would be to provide investors with opportunities for long-term growth in capital along with the liquidity of an open-ended scheme through an active management of investments in a diversified basket of equity stocks of domestic Public Sector Undertakings and in debt and money market instruments issued by PSUs AND others. Research Highlights for SBI PSU Fund Below is the key information for SBI PSU Fund Returns up to 1 year are on "The primary investment objective of the Scheme is to seek capital appreciation by investing predominantly in units of MLIIF - WGF. The Scheme may, at the discretion of the Investment Manager, also invest in the units of other similar overseas mutual fund schemes, which may constitute a significant part of its corpus. The Scheme may also invest a certain portion of its corpus in money market securities and/or units of money market/liquid schemes of DSP Merrill Lynch Mutual Fund, in order to meet liquidity requirements from time to time. However, there is no assurance that the investment objective of the Scheme will be realized." Research Highlights for DSP World Gold Fund Below is the key information for DSP World Gold Fund Returns up to 1 year are on To generate capital appreciation and income distribution to unit holders by investing predominantly in equity/equity related securities of the companies belonging to the infrastructure development and balance in debt securities and money market instruments. Research Highlights for ICICI Prudential Infrastructure Fund Below is the key information for ICICI Prudential Infrastructure Fund Returns up to 1 year are on 1. SBI PSU Fund
SBI PSU Fund
Growth Launch Date 7 Jul 10 NAV (18 Feb 26) ₹36.7055 ↑ 0.18 (0.49 %) Net Assets (Cr) ₹5,817 on 31 Dec 25 Category Equity - Sectoral AMC SBI Funds Management Private Limited Rating ☆☆ Risk High Expense Ratio 1.89 Sharpe Ratio 0.33 Information Ratio -0.47 Alpha Ratio -0.22 Min Investment 5,000 Min SIP Investment 500 Exit Load 0-1 Years (1%),1 Years and above(NIL) Growth of 10,000 investment over the years.
Date Value 31 Jan 21 ₹10,000 31 Jan 22 ₹14,656 31 Jan 23 ₹17,067 31 Jan 24 ₹30,032 31 Jan 25 ₹32,242 31 Jan 26 ₹38,028 Returns for SBI PSU Fund
absolute basis & more than 1 year are on CAGR (Compound Annual Growth Rate) basis. as on 18 Feb 26 Duration Returns 1 Month 6.9% 3 Month 6.8% 6 Month 17.1% 1 Year 33.3% 3 Year 34.1% 5 Year 28.3% 10 Year 15 Year Since launch 8.6% Historical performance (Yearly) on absolute basis
Year Returns 2024 11.3% 2023 23.5% 2022 54% 2021 29% 2020 32.4% 2019 -10% 2018 6% 2017 -23.8% 2016 21.9% 2015 16.2% Fund Manager information for SBI PSU Fund
Name Since Tenure Rohit Shimpi 1 Jun 24 1.67 Yr. Data below for SBI PSU Fund as on 31 Dec 25
Equity Sector Allocation
Sector Value Financial Services 34.09% Utility 29.59% Energy 13.91% Industrials 12.42% Basic Materials 7.01% Asset Allocation
Asset Class Value Cash 2.9% Equity 97.02% Debt 0.08% Top Securities Holdings / Portfolio
Name Holding Value Quantity State Bank of India (Financial Services)
Equity, Since 31 Jul 10 | SBIN18% ₹1,069 Cr 9,927,500 Bharat Electronics Ltd (Industrials)
Equity, Since 30 Jun 24 | BEL10% ₹583 Cr 12,975,000 NTPC Ltd (Utilities)
Equity, Since 31 Jul 10 | NTPC9% ₹550 Cr 15,443,244 Power Grid Corp Of India Ltd (Utilities)
Equity, Since 31 Jul 10 | POWERGRID9% ₹511 Cr 19,935,554
↑ 2,300,000 GAIL (India) Ltd (Utilities)
Equity, Since 31 May 24 | GAIL8% ₹488 Cr 29,150,000 Bharat Petroleum Corp Ltd (Energy)
Equity, Since 31 Aug 24 | BPCL6% ₹354 Cr 9,700,000 Bank of Baroda (Financial Services)
Equity, Since 31 Aug 24 | BANKBARODA6% ₹329 Cr 11,000,000 NMDC Ltd (Basic Materials)
Equity, Since 31 Oct 23 | NMDC4% ₹227 Cr 27,900,000 Indian Bank (Financial Services)
Equity, Since 30 Jun 21 | INDIANB4% ₹221 Cr 2,427,235 Oil India Ltd (Energy)
Equity, Since 31 Mar 24 | OIL3% ₹196 Cr 3,850,000 2. DSP World Gold Fund
DSP World Gold Fund
Growth Launch Date 14 Sep 07 NAV (17 Feb 26) ₹60.3973 ↓ -2.23 (-3.56 %) Net Assets (Cr) ₹1,756 on 31 Dec 25 Category Equity - Global AMC DSP BlackRock Invmt Managers Pvt. Ltd. Rating ☆☆☆ Risk High Expense Ratio 1.41 Sharpe Ratio 3.42 Information Ratio -0.67 Alpha Ratio 1.32 Min Investment 1,000 Min SIP Investment 500 Exit Load 0-12 Months (1%),12 Months and above(NIL) Growth of 10,000 investment over the years.
Date Value 31 Jan 21 ₹10,000 31 Jan 22 ₹8,807 31 Jan 23 ₹9,422 31 Jan 24 ₹8,517 31 Jan 25 ₹12,548 31 Jan 26 ₹33,170 Returns for DSP World Gold Fund
absolute basis & more than 1 year are on CAGR (Compound Annual Growth Rate) basis. as on 18 Feb 26 Duration Returns 1 Month 2.5% 3 Month 32.8% 6 Month 78.1% 1 Year 143% 3 Year 56.3% 5 Year 28.1% 10 Year 15 Year Since launch 10.3% Historical performance (Yearly) on absolute basis
Year Returns 2024 167.1% 2023 15.9% 2022 7% 2021 -7.7% 2020 -9% 2019 31.4% 2018 35.1% 2017 -10.7% 2016 -4% 2015 52.7% Fund Manager information for DSP World Gold Fund
Name Since Tenure Jay Kothari 1 Mar 13 12.93 Yr. Data below for DSP World Gold Fund as on 31 Dec 25
Equity Sector Allocation
Sector Value Basic Materials 95.89% Asset Allocation
Asset Class Value Cash 1.55% Equity 95.89% Debt 0.01% Other 2.56% Top Securities Holdings / Portfolio
Name Holding Value Quantity BGF World Gold I2
Investment Fund | -74% ₹1,458 Cr 1,177,658
↓ -41,596 VanEck Gold Miners ETF
- | GDX25% ₹497 Cr 573,719 Treps / Reverse Repo Investments
CBLO/Reverse Repo | -2% ₹35 Cr Net Receivables/Payables
Net Current Assets | -1% -₹15 Cr 3. ICICI Prudential Infrastructure Fund
ICICI Prudential Infrastructure Fund
Growth Launch Date 31 Aug 05 NAV (18 Feb 26) ₹198.6 ↑ 0.98 (0.50 %) Net Assets (Cr) ₹8,134 on 31 Dec 25 Category Equity - Sectoral AMC ICICI Prudential Asset Management Company Limited Rating ☆☆☆ Risk High Expense Ratio 1.89 Sharpe Ratio 0.12 Information Ratio 0 Alpha Ratio 0 Min Investment 5,000 Min SIP Investment 100 Exit Load 0-1 Years (1%),1 Years and above(NIL) Growth of 10,000 investment over the years.
Date Value 31 Jan 21 ₹10,000 31 Jan 22 ₹16,042 31 Jan 23 ₹19,152 31 Jan 24 ₹29,825 31 Jan 25 ₹34,393 31 Jan 26 ₹36,891 Returns for ICICI Prudential Infrastructure Fund
absolute basis & more than 1 year are on CAGR (Compound Annual Growth Rate) basis. as on 18 Feb 26 Duration Returns 1 Month 2.1% 3 Month -1.3% 6 Month 2.8% 1 Year 17.4% 3 Year 25.2% 5 Year 26.8% 10 Year 15 Year Since launch 15.7% Historical performance (Yearly) on absolute basis
Year Returns 2024 6.7% 2023 27.4% 2022 44.6% 2021 28.8% 2020 50.1% 2019 3.6% 2018 2.6% 2017 -14% 2016 40.8% 2015 2% Fund Manager information for ICICI Prudential Infrastructure Fund
Name Since Tenure Ihab Dalwai 3 Jun 17 8.67 Yr. Sharmila D’mello 30 Jun 22 3.59 Yr. Data below for ICICI Prudential Infrastructure Fund as on 31 Dec 25
Equity Sector Allocation
Sector Value Industrials 48.97% Financial Services 12.33% Utility 9.63% Basic Materials 9.49% Real Estate 6.53% Energy 6% Consumer Cyclical 2.03% Communication Services 0.11% Asset Allocation
Asset Class Value Cash 4.63% Equity 95.37% Top Securities Holdings / Portfolio
Name Holding Value Quantity Larsen & Toubro Ltd (Industrials)
Equity, Since 30 Nov 09 | LT9% ₹690 Cr 1,755,704 InterGlobe Aviation Ltd (Industrials)
Equity, Since 28 Feb 23 | INDIGO8% ₹640 Cr 1,391,449
↑ 275,091 NTPC Ltd (Utilities)
Equity, Since 29 Feb 16 | NTPC4% ₹332 Cr 9,326,448
↓ -1,050,000 Oberoi Realty Ltd (Real Estate)
Equity, Since 31 May 23 | OBEROIRLTY3% ₹253 Cr 1,696,181
↑ 637,668 Adani Ports & Special Economic Zone Ltd (Industrials)
Equity, Since 31 May 24 | ADANIPORTS3% ₹241 Cr 1,700,000 AIA Engineering Ltd (Industrials)
Equity, Since 28 Feb 21 | AIAENG3% ₹229 Cr 574,561
↓ -37,559 Kalpataru Projects International Ltd (Industrials)
Equity, Since 30 Sep 06 | KPIL3% ₹221 Cr 1,931,967
↑ 20,847 IndusInd Bank Ltd (Financial Services)
Equity, Since 31 Oct 24 | INDUSINDBK3% ₹217 Cr 2,424,016 Reliance Industries Ltd (Energy)
Equity, Since 31 Jul 23 | RELIANCE3% ₹213 Cr 1,529,725 Axis Bank Ltd (Financial Services)
Equity, Since 31 Dec 20 | AXISBANK3% ₹209 Cr 1,527,307
↓ -156,250
ਮਿਉਚੁਅਲ ਫੰਡਾਂ ਵਿੱਚ ਔਨਲਾਈਨ ਨਿਵੇਸ਼ ਕਿਵੇਂ ਕਰੀਏ?
Fincash.com 'ਤੇ ਜੀਵਨ ਭਰ ਲਈ ਮੁਫਤ ਨਿਵੇਸ਼ ਖਾਤਾ ਖੋਲ੍ਹੋ।
ਆਪਣੀ ਰਜਿਸਟ੍ਰੇਸ਼ਨ ਅਤੇ ਕੇਵਾਈਸੀ ਪ੍ਰਕਿਰਿਆ ਨੂੰ ਪੂਰਾ ਕਰੋ
ਦਸਤਾਵੇਜ਼ (ਪੈਨ, ਆਧਾਰ, ਆਦਿ) ਅੱਪਲੋਡ ਕਰੋ।ਅਤੇ, ਤੁਸੀਂ ਨਿਵੇਸ਼ ਕਰਨ ਲਈ ਤਿਆਰ ਹੋ!
ਇਹ ਯਕੀਨੀ ਬਣਾਉਣ ਲਈ ਸਾਰੇ ਯਤਨ ਕੀਤੇ ਗਏ ਹਨ ਕਿ ਇੱਥੇ ਦਿੱਤੀ ਗਈ ਜਾਣਕਾਰੀ ਸਹੀ ਹੈ। ਹਾਲਾਂਕਿ, ਡੇਟਾ ਦੀ ਸ਼ੁੱਧਤਾ ਬਾਰੇ ਕੋਈ ਗਾਰੰਟੀ ਨਹੀਂ ਦਿੱਤੀ ਗਈ ਹੈ। ਕਿਰਪਾ ਕਰਕੇ ਕੋਈ ਵੀ ਨਿਵੇਸ਼ ਕਰਨ ਤੋਂ ਪਹਿਲਾਂ ਸਕੀਮ ਜਾਣਕਾਰੀ ਦਸਤਾਵੇਜ਼ ਨਾਲ ਤਸਦੀਕ ਕਰੋ।







Clarified my doubts