
 +91-22-48913909
ਐਫਡੀ ਬਨਾਮ ਕਰਜ਼ਾ ਮਿਉਚੁਅਲ ਫੰਡ
ਐੱਫ.ਡੀ ਬਨਾਮਕਰਜ਼ਾ ਫੰਡ? ਸੋਚਣਾਕਿੱਥੇ ਨਿਵੇਸ਼ ਕਰਨਾ ਹੈ ਚੰਗੀ ਰਿਟਰਨ ਕਮਾਉਣ ਲਈ ਤੁਹਾਡੀ ਬਚਤ। ਆਮ ਤੌਰ 'ਤੇ, ਲੋਕ ਵਿਚਾਰ ਕਰਦੇ ਹਨਨਿਵੇਸ਼ ਫਿਕਸਡ ਡਿਪਾਜ਼ਿਟ ਜਾਂ FD ਵਿੱਚ ਸਭ ਤੋਂ ਸੁਵਿਧਾਜਨਕ ਵਿਕਲਪ ਹੈ ਕਿਉਂਕਿ ਇਹ ਸੁਰੱਖਿਅਤ ਹੈ ਅਤੇ ਸਥਿਰ ਰਿਟਰਨ ਦੀ ਪੇਸ਼ਕਸ਼ ਕਰਦਾ ਹੈ। ਪਰ ਕੀ ਇਹ ਸਭ ਤੋਂ ਵਧੀਆ ਤਰੀਕਾ ਹੈ? ਹਾਲਾਂਕਿ ਫਿਕਸਡ ਡਿਪਾਜ਼ਿਟ ਸਾਰਿਆਂ ਲਈ ਇੱਕ ਆਸਾਨ ਨਿਵੇਸ਼ ਵਿਕਲਪ ਹੈ, ਹਾਲਾਂਕਿ, ਟੈਕਸਯੋਗ ਹੋਣ ਵਾਲੀ ਫਿਕਸਡ ਡਿਪਾਜ਼ਿਟ ਦੇ ਰਿਟਰਨ ਇੱਕ ਕਰਜ਼ਾ ਫੰਡ ਦੇ ਮੁਕਾਬਲੇ ਬਹੁਤ ਘੱਟ ਹਨ। ਇਸ ਤੋਂ ਇਲਾਵਾ, ਜਦੋਂ ਲੰਬੇ ਸਮੇਂ ਲਈ ਰੱਖੀ ਜਾਂਦੀ ਹੈ, ਕਰਜ਼ਾਮਿਉਚੁਅਲ ਫੰਡ ਚੰਗੀ ਰਿਟਰਨ ਦੀ ਪੇਸ਼ਕਸ਼ ਕਰਦਾ ਹੈ. ਕਰਜ਼ੇ ਦੇ ਮਿਉਚੁਅਲ ਫੰਡਾਂ ਜਾਂ ਫਿਕਸਡ ਡਿਪਾਜ਼ਿਟ ਵਿੱਚ ਨਿਵੇਸ਼ ਕਰਨ ਦਾ ਅੰਤਿਮ ਫੈਸਲਾ ਲੈਣ ਤੋਂ ਪਹਿਲਾਂ, ਇਹਨਾਂ ਨਿਵੇਸ਼ਾਂ ਦੀ ਵਿਸਤ੍ਰਿਤ ਤੁਲਨਾ ਕਰੋ।
ਸਾਰੰਸ਼ ਵਿੱਚ:
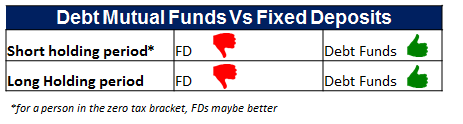
ਕਰਜ਼ਾ ਮਿਉਚੁਅਲ ਫੰਡ (ਕਰਜ਼ਾ ਫੰਡ) ਬਨਾਮ ਫਿਕਸਡ ਡਿਪਾਜ਼ਿਟ (FD)
ਸਾਨੂੰ ਇਸ ਨੂੰ ਜੋਖਮ ਲੈਣ ਦੀ ਯੋਗਤਾ ਅਤੇ ਨਿਰਧਾਰਤ ਹੋਲਡਿੰਗ ਪੀਰੀਅਡ ਦੁਆਰਾ ਤੋੜਨ ਦੀ ਜ਼ਰੂਰਤ ਹੋਏਗੀਨਿਵੇਸ਼ਕ ਸਵਾਲ ਵਿੱਚ.
ਛੋਟੀ ਹੋਲਡਿੰਗ ਪੀਰੀਅਡ (1 ਸਾਲ ਜਾਂ ਘੱਟ)
ਇੱਥੇ ਕਰਜ਼ੇ ਫੰਡ ਲਈ ਵਿਕਲਪ ਸੀਮਤ ਹੋਣਗੇਤਰਲ ਫੰਡ, ਅਤਿ-ਛੋਟੀ ਮਿਆਦ ਦੇ ਫੰਡ ਅਤੇ ਥੋੜ੍ਹੇ ਸਮੇਂ ਲਈਆਮਦਨ ਫੰਡ ਹਾਲਾਂਕਿ ਰਿਟਰਨ ਜਾਂ ਉਪਜ ਆਮ ਤੌਰ 'ਤੇ ਤਰਲ ਤੋਂ ਅਲਟਰਾ-ਸ਼ਾਰਟ ਤੋਂ ਥੋੜ੍ਹੇ ਸਮੇਂ ਦੇ ਫੰਡ ਤੱਕ ਵੱਧ ਜਾਂਦੀ ਹੈ, ਇਹਨਾਂ ਰਿਣ ਫੰਡਾਂ ਅਤੇ ਇੱਕ ਫਿਕਸਡ ਡਿਪਾਜ਼ਿਟ ਵਿਚਕਾਰ ਉਪਜ ਦਾ ਅੰਤਰ ਪਿਛਲੇ ਇੱਕ ਸਾਲ ਵਿੱਚ ਉਹਨਾਂ ਦੇ ਰਿਟਰਨ ਨੂੰ ਧਿਆਨ ਵਿੱਚ ਰੱਖਦੇ ਹੋਏ ਨਿਰਧਾਰਤ ਕੀਤਾ ਜਾ ਸਕਦਾ ਹੈ।
ਕਰਜ਼ਾ ਮਿਉਚੁਅਲ ਫੰਡ (ਸ਼੍ਰੇਣੀ ਔਸਤ ਵਾਪਸੀ)
| ਕਰਜ਼ਾ ਮਿਉਚੁਅਲ ਫੰਡ ਦੀ ਕਿਸਮ | ਪਿਛਲੇ 1 ਸਾਲ ਵਾਪਸੀ (%) |
|---|---|
| ਤਰਲ ਫੰਡ | 7.36 |
| ਅਲਟਰਾ ਸ਼ਾਰਟ-ਟਰਮ ਡੈਬਟ ਫੰਡ | 9.18 |
| ਥੋੜ੍ਹੇ ਸਮੇਂ ਦੇ ਕਰਜ਼ੇ ਫੰਡ | 9.78 |
| ਡਾਇਨਾਮਿਕ ਕਰਜ਼ਾ ਫੰਡ | 13.89 |
| ਲੰਬੇ ਸਮੇਂ ਦੇ ਕਰਜ਼ੇ ਫੰਡ | 13.19 |
| ਗਿਲਟ ਸ਼ਾਰਟ-ਟਰਮ ਫੰਡ | 11.76 |
| ਗਿਲਟ ਲੰਬੇ ਸਮੇਂ ਦੇ ਫੰਡ | 15.06 |
| 20 ਫਰਵਰੀ 2017 ਦਾ ਡਾਟਾ |
ਫਿਕਸਡ ਡਿਪਾਜ਼ਿਟ ਜਾਂ FD ਔਸਤ ਵਾਪਸੀ ਦਰ
ਫਿਕਸਡ ਡਿਪਾਜ਼ਿਟ ਦੀ ਔਸਤ ਵਾਪਸੀ ਦਰ 8-8.5% p.a. ਸਾਲ 2016 ਵਿੱਚ (ਇਸ ਲਈ ਕੋਈ ਸਾਰਣੀ ਵਿੱਚ ਉਪਰੋਕਤ ਰਿਟਰਨਾਂ ਦੀ ਤੁਲਨਾ ਕਰ ਸਕਦਾ ਹੈ)। ਹਾਲਾਂਕਿ, ਪਿਛਲੇ ਇੱਕ ਸਾਲ ਵਿੱਚ, ਰਿਟਰਨ ਦਰ ਘਟ ਕੇ 6.6-7.5% p.a.
ਉਪਰੋਕਤ ਉਦਾਹਰਣ ਦੇ ਨਾਲ, ਇਹ ਸਪੱਸ਼ਟ ਹੈ ਕਿ ਕਰਜ਼ਾ ਫੰਡਾਂ ਦੀ ਵਾਪਸੀ ਦੀ ਔਸਤ ਦਰ ਫਿਕਸਡ ਡਿਪਾਜ਼ਿਟ ਨਾਲੋਂ ਬਿਹਤਰ ਹੈ।
Talk to our investment specialist
ਲੰਬੇ ਸਮੇਂ ਦੀ ਹੋਲਡਿੰਗ ਪੀਰੀਅਡ
ਲੰਬੇ ਸਮੇਂ ਦੀ ਹੋਲਡਿੰਗ ਅਵਧੀ ਦੇ ਨਾਲ, ਕਰਜ਼ਾ ਫੰਡ FDs ਨਾਲੋਂ ਬਿਹਤਰ ਸਾਬਤ ਹੋ ਸਕਦੇ ਹਨ।
ਇੱਥੇ ਨਿਵੇਸ਼ ਕਰਨ ਦੇ ਵਿਕਲਪ ਹੋਣਗੇ:
- ਲੰਬੇ ਸਮੇਂ ਦੀ ਆਮਦਨੀ ਫੰਡ
- ਲੰਬੇ ਸਮੇਂ ਲਈ ਗਿਲਟ,
- ਕਾਰਪੋਰੇਟਬਾਂਡ ਫੰਡ (ਉੱਚ ਉਪਜ ਫੰਡ), ਤਰਲ ਦੇ ਉੱਪਰ ਦੱਸੇ ਗਏ ਵਿਕਲਪਾਂ ਤੋਂ ਇਲਾਵਾ, ਅਲਟਰਾ-ਸ਼ਾਰਟ ਅਤੇ ਥੋੜ੍ਹੇ ਸਮੇਂ ਦੇ ਫੰਡ ਵੀ ਵਰਤੇ ਜਾ ਸਕਦੇ ਹਨ।
ਇਹ ਦੇਖਦੇ ਹੋਏ ਕਿ ਹੋਲਡਿੰਗ ਦੀ ਮਿਆਦ 3 ਸਾਲ ਜਾਂ ਵੱਧ ਹੋ ਸਕਦੀ ਹੈ, ਅਸੀਂ ਹੇਠਾਂ ਕਹਿ ਸਕਦੇ ਹਾਂ:
- ਨਾਲਪੂੰਜੀ ਸੂਚਕਾਂਕ ਲਾਭਾਂ ਦੇ ਨਾਲ 20% 'ਤੇ ਲਾਭ ਟੈਕਸ, ਸ਼ੁੱਧ ਟੈਕਸ ਘਟਨਾਵਾਂ ਘੱਟ ਤੋਂ ਘੱਟ ਹੋਣਗੀਆਂ (ਹਾਲਾਂਕਿ ਕਿਸੇ ਨੂੰ ਟੈਕਸ ਦੀ ਘਟਨਾ ਦੀ ਗਣਨਾ ਕਰਨ ਵਾਲੇ ਟੈਕਸ ਦੇ ਸਾਲ ਦੇ ਹਿਸਾਬ ਨਾਲ ਕਰਨੀ ਚਾਹੀਦੀ ਹੈ)
- ਲੰਬੇ ਸਮੇਂ ਦੀ ਆਮਦਨ ਫੰਡ/ਗਿਲਟ ਫੰਡ ਉੱਚ ਪੈਦਾਵਾਰ ਦੇ ਨਾਲ ਅਤੇ ਇਸ ਤੋਂ ਇਲਾਵਾ, ਜੇਕਰ ਵਿਆਜ ਦਰਾਂ ਘੱਟ ਜਾਂਦੀਆਂ ਹਨ ਤਾਂ ਬਹੁਤ ਜ਼ਿਆਦਾ ਰਿਟਰਨ ਮਿਲੇਗਾ।
- ਇਹਨਾਂ ਰਿਣ ਫੰਡਾਂ ਦੇ ਨਾਲ ਇੱਕ ਉੱਚ ਦੋ ਅੰਕਾਂ ਦੇ ਰਿਟਰਨ ਦੇ ਨਾਲ ਖਤਮ ਹੋ ਸਕਦਾ ਹੈ।
ਲੰਬੀ-ਅਵਧੀ ਆਮਦਨ ਫੰਡਾਂ 'ਤੇ ਰਿਟਰਨ ਦੀ ਹੇਠਾਂ ਦਿੱਤੀ ਉਦਾਹਰਣ ਲਓ, ਸ਼੍ਰੇਣੀ ਲਈ ਔਸਤ ਪਿਛਲੇ 1-ਸਾਲ ਦੀ ਰਿਟਰਨ 12.19% ਹੈ ਅਤੇ ਪਿਛਲੇ 3 ਸਾਲਾਂ ਵਿੱਚ 10.32% p.a. ਇਸ ਮਿਆਦ ਵਿੱਚ ਕੋਈ ਵੀ FD ਸਮਾਨ ਰਿਟਰਨ ਨਹੀਂ ਦੇ ਸਕਦਾ ਸੀ। ਗਿਲਟ ਫੰਡ ਰਿਟਰਨ ਹੋਰ ਵੀ ਵੱਧ ਹਨ। ਇਸੇ ਮਿਆਦ ਵਿੱਚ, ਪਿਛਲੇ ਸਾਲ FD ਦਰਾਂ ਜ਼ਿਆਦਾਤਰ ਬੈਂਕਾਂ ਵਿੱਚ 8-8.5% ਸਲਾਨਾ ਦੇ ਨੇੜੇ ਹੋਣਗੀਆਂ, (ਹਾਲਾਂਕਿ ਅੱਜ ਦਰਾਂ ਹੋਰ ਘਟ ਕੇ 6.5 - 7.5% ਹੋ ਗਈਆਂ ਹਨ)
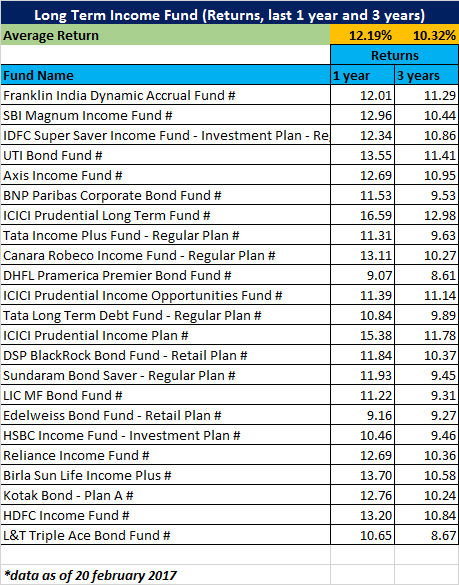
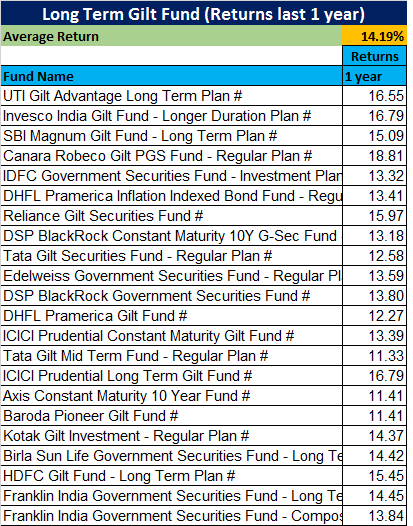
ਇਸ ਲਈ ਇੱਕ ਨਿਵੇਸ਼ਕ ਦੇ ਨਾਲ ਲੰਬੇ ਸਮੇਂ ਤੱਕ ਹੋਲਡਿੰਗ ਪੀਰੀਅਡ ਅਤੇ ਵਿਆਜ ਦਰਾਂ ਵਿੱਚ ਗਿਰਾਵਟ ਹੋਣ ਦੇ ਨਾਲ, ਇੱਕ ਕਰਜ਼ਾ ਫੰਡ (ਲੰਮੀ ਮਿਆਦ ਦੀ ਆਮਦਨ ਜਾਂ ਗਿਲਟ) ਇੱਕ FD ਨਾਲੋਂ ਬਹੁਤ ਵਧੀਆ ਰਿਟਰਨ ਦੇਵੇਗਾ। ਇੱਥੋਂ ਤੱਕ ਕਿ ਵਿਆਜ ਦਰਾਂ ਨਾ ਡਿੱਗਣ ਦੇ ਮਾਮਲੇ ਵਿੱਚ, ਉੱਚ ਉਪਜ ਵਾਲੇ ਕਾਰਪੋਰੇਟ ਬਾਂਡ ਫੰਡ ਉਸੇ ਮਿਆਦ ਵਿੱਚ ਐਫਡੀ ਨੂੰ ਮਾਤ ਦੇਣਗੇ।
ਕਰਜ਼ਾ ਮਿਉਚੁਅਲ ਫੰਡ ਅਤੇ ਫਿਕਸਡ ਡਿਪਾਜ਼ਿਟ 'ਤੇ ਟੈਕਸ
ਕਰਜ਼ਾ ਫੰਡਾਂ ਅਤੇ ਫਿਕਸਡ ਡਿਪਾਜ਼ਿਟ ਦੇ ਰਿਟਰਨ ਨੂੰ ਨਿਰਧਾਰਤ ਕਰਨ ਵਿੱਚ ਵੀ ਟੈਕਸ ਮਹੱਤਵਪੂਰਨ ਭੂਮਿਕਾ ਨਿਭਾਉਂਦਾ ਹੈ। ਆਮ ਤੌਰ 'ਤੇ, ਫਿਕਸਡ ਡਿਪਾਜ਼ਿਟ 'ਤੇ ਟੈਕਸ 33% (ਟੈਕਸ ਦੀ ਮਾਮੂਲੀ ਦਰ) ਹੁੰਦਾ ਹੈ ਜਦੋਂ ਕਿ ਰਿਣ ਫੰਡਾਂ 'ਤੇ ਜੇਕਰ ਕੋਈ 3-ਸਾਲ ਤੋਂ ਘੱਟ ਦੇ ਦ੍ਰਿਸ਼ਟੀਕੋਣ ਨਾਲ ਨਿਵੇਸ਼ ਕਰਦਾ ਹੈ ਤਾਂ ਡੀਡੀਟੀ (ਲਾਭਅੰਸ਼ ਵੰਡ ਟੈਕਸ) ਦੀ ਕਟੌਤੀ ਕਰਨ ਲਈ ਲਾਭਅੰਸ਼ ਵੰਡ ਟੈਕਸ ਲਗਾਉਣਾ ਇੱਕ ਬਿਹਤਰ ਵਿਕਲਪ ਹੋਵੇਗਾ। ਲਗਭਗ 25% (+ਸਰਚਾਰਜ ਆਦਿ) 'ਤੇ। ਇਹ ਦਰਸਾਉਂਦਾ ਹੈ ਕਿ ਰਿਣ ਮਿਉਚੁਅਲ ਫੰਡਾਂ 'ਤੇ ਟੈਕਸ ਫਿਕਸਡ ਡਿਪਾਜ਼ਿਟ ਦੇ ਮੁਕਾਬਲੇ ਮੁਕਾਬਲਤਨ ਘੱਟ ਹੈ।
ਕਰਜ਼ੇ ਦੇ ਫੰਡਾਂ ਨਾਲ ਆਉਣ ਵਾਲੇ ਵਾਧੂ ਲਾਭ ਹਨ:
- ਤਰਲਤਾ: ਤੋਂ 1-2 ਦਿਨਾਂ ਦੇ ਅੰਦਰ ਪੈਸੇ ਉਪਲਬਧ ਹੋਣਗੇਛੁਟਕਾਰਾ
- ਪੇਸ਼ੇਵਰ ਪ੍ਰਬੰਧਨ: ਗਤੀਸ਼ੀਲ ਤੌਰ 'ਤੇ ਰਣਨੀਤੀ ਨੂੰ ਬਦਲਣ ਅਤੇ ਬਾਜ਼ਾਰਾਂ ਦਾ ਫਾਇਦਾ ਲੈਣ ਦੀ ਯੋਗਤਾ
- ਅਚਨਚੇਤੀ ਕਢਵਾਉਣ ਦਾ ਕੋਈ ਜੁਰਮਾਨਾ ਨਹੀਂ।
ਸੰਪੇਕਸ਼ਤ:
| ਪੈਰਾਮੀਟਰ | ਮਿਉਚੁਅਲ ਫੰਡ | ਫਿਕਸਡ ਡਿਪਾਜ਼ਿਟ |
|---|---|---|
| ਰਿਟਰਨ ਦੀ ਦਰ | ਕੋਈ ਨਿਸ਼ਚਿਤ ਰਿਟਰਨ ਨਹੀਂ | ਸਥਿਰ ਰਿਟਰਨ |
| ਮਹਿੰਗਾਈ ਵਿਵਸਥਿਤ ਰਿਟਰਨ | ਉੱਚ ਮੁਦਰਾਸਫੀਤੀ ਐਡਜਸਟਡ ਰਿਟਰਨਾਂ ਦੀ ਸੰਭਾਵਨਾ | ਆਮ ਤੌਰ 'ਤੇ ਘੱਟ ਮਹਿੰਗਾਈ ਐਡਜਸਟਡ ਰਿਟਰਨ |
| ਜੋਖਮ | ਘੱਟ ਤੋਂ ਵੱਧ ਜੋਖਮ (ਫੰਡ 'ਤੇ ਨਿਰਭਰ ਕਰਦਾ ਹੈ | ਘੱਟ ਜੋਖਮ |
| ਤਰਲਤਾ | ਤਰਲ | ਤਰਲ |
| ਸਮੇਂ ਤੋਂ ਪਹਿਲਾਂ ਕਢਵਾਉਣਾ | ਐਗਜ਼ਿਟ ਲੋਡ/ਨੋ ਲੋਡ ਨਾਲ ਆਗਿਆ ਹੈ | ਜੁਰਮਾਨੇ ਦੇ ਨਾਲ ਇਜਾਜ਼ਤ ਦਿੱਤੀ ਗਈ |
| ਨਿਵੇਸ਼ ਦੀ ਲਾਗਤ | ਪ੍ਰਬੰਧਨ ਲਾਗਤ/ਖਰਚ ਅਨੁਪਾਤ | ਕੋਈ ਲਾਗਤ ਨਹੀਂ |
ਚੋਟੀ ਦੇ 8 ਸਰਵੋਤਮ ਪ੍ਰਦਰਸ਼ਨ ਕਰਨ ਵਾਲੇ ਕਰਜ਼ੇ ਫੰਡ 2022
ਹੇਠਾਂ ਕਰਜ਼ਾ ਫੰਡਾਂ ਦੀ ਸੂਚੀ ਦਿੱਤੀ ਗਈ ਹੈ ਜਿਸ ਵਿੱਚ ਉੱਪਰ ਕੁੱਲ ਸੰਪਤੀਆਂ/ਏਯੂਐਮ ਹਨ1000 ਕਰੋੜ ਅਤੇ 3 ਸਾਲ ਮਿਸ਼ਰਿਤ (ਸੀ.ਏ.ਜੀ.ਆਰ) ਵਾਪਸੀ।
(Erstwhile Aditya Birla Sun Life Corporate Bond Fund) The investment objective of the Scheme is to generate returns by predominantly investing in a portfolio of corporate debt securities with short to medium term maturities across the credit spectrum within the investment grade. The Scheme does not guarantee/indicate any returns. There can be no assurance that the schemes’ objectives will be achieved. Below is the key information for Aditya Birla Sun Life Credit Risk Fund Returns up to 1 year are on The primary investment objective of the Scheme is to generate regular income through investments in debt & money market instruments in order to make regular dividend payments to unit holders & secondary objective is growth of capital. Research Highlights for Aditya Birla Sun Life Medium Term Plan Below is the key information for Aditya Birla Sun Life Medium Term Plan Returns up to 1 year are on The fund’s objective is to provide reasonable returns, by maintaining an optimum balance of safety, liquidity and yield, through investments in a basket of debt and money market instruments with a view to delivering consistent performance. However, there can be no assurance that the investment objective of the Scheme will be realized. Research Highlights for ICICI Prudential Regular Savings Fund Below is the key information for ICICI Prudential Regular Savings Fund Returns up to 1 year are on (Erstwhile Reliance Regular Savings Fund - Debt Plan) The primary investment objective of this option is to generate optimal returns consistent with moderate level of risk. This income may be complemented by capital appreciation of the portfolio. Accordingly investments shall predominantly be made in Debt & Money Market Instruments. Research Highlights for Nippon India Credit Risk Fund Below is the key information for Nippon India Credit Risk Fund Returns up to 1 year are on IDFC – GSF -IP is an open ended dedicated gilt scheme with an objective to generate optimal returns with high liquidity by investing in Government Securities.However there is no assurance that the investment objective of the scheme will be realized. Research Highlights for Bandhan Government Securities Fund - Investment Plan Below is the key information for Bandhan Government Securities Fund - Investment Plan Returns up to 1 year are on (Erstwhile SBI Corporate Bond Fund) The investment objective will be to actively manage a portfolio of good
quality corporate debt as well as Money Market Instruments so as to provide
reasonable returns and liquidity to the Unit holders. However there is no
guarantee or assurance that the investment objective of the scheme will
be achieved. Research Highlights for SBI Credit Risk Fund Below is the key information for SBI Credit Risk Fund Returns up to 1 year are on The investment objective of the scheme is to generate regular income and capital appreciation by investing in a portfolio of medium term debt and money market instruments. There is no assurance or guarantee that the investment objective of the scheme will be achieved Research Highlights for Kotak Medium Term Fund Below is the key information for Kotak Medium Term Fund Returns up to 1 year are on (Erstwhile Axis Income Fund) To generate optimal returns in the medium term while maintaining liquidity of the portfolio by investing in debt and money market instruments. Research Highlights for Axis Strategic Bond Fund Below is the key information for Axis Strategic Bond Fund Returns up to 1 year are on 1. Aditya Birla Sun Life Credit Risk Fund
Aditya Birla Sun Life Credit Risk Fund
Growth Launch Date 17 Apr 15 NAV (21 Oct 26) ₹25.3853 ↓ -0.04 (-0.15 %) Net Assets (Cr) ₹1,657 on 30 Sep 26 Category Debt - Credit Risk AMC Birla Sun Life Asset Management Co Ltd Rating Risk Moderate Expense Ratio 1.59 Sharpe Ratio 1.61 Information Ratio 1.23 Alpha Ratio 4.78 Min Investment 1,000 Min SIP Investment 100 Exit Load 0-365 Days (1%),365 Days and above(NIL) Yield to Maturity 8.24% Effective Maturity 2 Years 2 Months 12 Days Modified Duration 1 Year 7 Months 10 Days Growth of 10,000 investment over the years.
Date Value 30 Sep 21 ₹10,000 30 Sep 22 ₹10,637 30 Sep 23 ₹11,382 30 Sep 24 ₹12,434 30 Sep 25 ₹14,417 30 Sep 26 ₹16,038 Returns for Aditya Birla Sun Life Credit Risk Fund
absolute basis & more than 1 year are on CAGR (Compound Annual Growth Rate) basis. as on 21 Oct 26 Duration Returns 1 Month -0.2% 3 Month 0.7% 6 Month 3% 1 Year 10.2% 3 Year 12% 5 Year 9.8% 10 Year 15 Year Since launch 8.4% Historical performance (Yearly) on absolute basis
Year Returns 2025 13.4% 2024 11.9% 2023 6.9% 2022 7.1% 2021 6.4% 2020 9.4% 2019 2.1% 2018 6.6% 2017 8.1% 2016 10.3% Fund Manager information for Aditya Birla Sun Life Credit Risk Fund
Name Since Tenure Sunaina Cunha 17 Apr 15 11.38 Yr. Mohit Sharma 6 Aug 20 6.07 Yr. Data below for Aditya Birla Sun Life Credit Risk Fund as on 30 Sep 26
Asset Allocation
Asset Class Value Cash 9.62% Equity 7.54% Debt 82.48% Other 0.37% Debt Sector Allocation
Sector Value Corporate 73.65% Cash Equivalent 9.62% Government 8.83% Credit Quality
Rating Value A 9.58% AA 61.16% AAA 29.26% Top Securities Holdings / Portfolio
Name Holding Value Quantity SK Finance Limited
Debentures | -6% ₹91 Cr 9,300
↑ 2,800 Eris Lifesciences Limited
Debentures | -5% ₹74 Cr 7,400 Jubilant Bevco Limited
Debentures | -4% ₹73 Cr 6,500 Jtpm Metal TRaders Limited
Debentures | -4% ₹63 Cr 5,877
↑ 500 Adani Airport Holdings Limited
Debentures | -4% ₹59 Cr 6,000 GMR Airports Limited
Debentures | -3% ₹55 Cr 5,200 Rec Limited
Debentures | -3% ₹50 Cr 5,000 Small Industries Development Bank Of India
Debentures | -3% ₹49 Cr 5,000 Tata Capital Housing Finance Limited
Debentures | -3% ₹44 Cr 4,467 Hinduja Leyland Finance Limited
Debentures | -2% ₹35 Cr 3,500 2. Aditya Birla Sun Life Medium Term Plan
Aditya Birla Sun Life Medium Term Plan
Growth Launch Date 25 Mar 09 NAV (21 Oct 26) ₹43.6066 ↓ -0.07 (-0.16 %) Net Assets (Cr) ₹3,370 on 30 Sep 26 Category Debt - Medium term Bond AMC Birla Sun Life Asset Management Co Ltd Rating ☆☆☆☆ Risk Moderate Expense Ratio 1.55 Sharpe Ratio 0.92 Information Ratio 0 Alpha Ratio 0 Min Investment 1,000 Min SIP Investment 1,000 Exit Load 0-365 Days (1%),365 Days and above(NIL) Yield to Maturity 7.99% Effective Maturity 4 Years 25 Days Modified Duration 2 Years 5 Months 8 Days Growth of 10,000 investment over the years.
Date Value 30 Sep 21 ₹10,000 30 Sep 22 ₹12,349 30 Sep 23 ₹13,234 30 Sep 24 ₹14,419 30 Sep 25 ₹16,212 30 Sep 26 ₹17,489 Returns for Aditya Birla Sun Life Medium Term Plan
absolute basis & more than 1 year are on CAGR (Compound Annual Growth Rate) basis. as on 21 Oct 26 Duration Returns 1 Month -0.4% 3 Month 0.1% 6 Month 2.3% 1 Year 6.7% 3 Year 9.6% 5 Year 11.7% 10 Year 15 Year Since launch 8.7% Historical performance (Yearly) on absolute basis
Year Returns 2025 10.9% 2024 10.5% 2023 6.9% 2022 24.8% 2021 7.1% 2020 8.1% 2019 -4.4% 2018 5.6% 2017 7% 2016 10.9% Fund Manager information for Aditya Birla Sun Life Medium Term Plan
Name Since Tenure Sunaina Cunha 1 Sep 14 12.01 Yr. Mohit Sharma 6 Aug 20 6.07 Yr. Data below for Aditya Birla Sun Life Medium Term Plan as on 30 Sep 26
Asset Allocation
Asset Class Value Cash 10.93% Equity 4.07% Debt 84.77% Other 0.23% Debt Sector Allocation
Sector Value Corporate 55.76% Government 29.01% Cash Equivalent 10.93% Credit Quality
Rating Value A 9.91% AA 40.96% AAA 49.13% Top Securities Holdings / Portfolio
Name Holding Value Quantity 6.94% Govt Stock 2036
Sovereign Bonds | -11% ₹366 Cr 37,000,000
↓ -6,000,000 Bajaj Housing Finance Limited
Debentures | -4% ₹125 Cr 12,500
↓ -2,500 National Bank For Agriculture And Rural Development
Debentures | -4% ₹124 Cr 12,500
↑ 12,500 National Bank For Agriculture And Rural Development
Debentures | -3% ₹113 Cr 11,500 Hinduja Leyland Finance Limited
Debentures | -3% ₹109 Cr 11,000 Cholamandalam Investment And Finance Company Limited
Debentures | -3% ₹103 Cr 10,500 Oxyzo Financial Services Limited
Debentures | -3% ₹89 Cr 9,000 GMR Airports Limited
Debentures | -3% ₹85 Cr 8,000 Jubilant Bevco Limited
Debentures | -2% ₹83 Cr 7,400 Jtpm Metal TRaders Limited
Debentures | -2% ₹83 Cr 7,673 3. ICICI Prudential Regular Savings Fund
ICICI Prudential Regular Savings Fund
Growth Launch Date 3 Dec 10 NAV (21 Oct 26) ₹34.7578 ↓ -0.07 (-0.21 %) Net Assets (Cr) ₹6,320 on 30 Sep 26 Category Debt - Credit Risk AMC ICICI Prudential Asset Management Company Limited Rating ☆ Risk Moderate Expense Ratio 1.4 Sharpe Ratio 0.97 Information Ratio 0 Alpha Ratio 0 Min Investment 10,000 Min SIP Investment 100 Exit Load 0-1 Years (1%),1 Years and above(NIL) Yield to Maturity 8.57% Effective Maturity 2 Years 11 Months 19 Days Modified Duration 1 Year 10 Months 20 Days Growth of 10,000 investment over the years.
Date Value 30 Sep 21 ₹10,000 30 Sep 22 ₹10,446 30 Sep 23 ₹11,171 30 Sep 24 ₹12,171 30 Sep 25 ₹13,266 30 Sep 26 ₹14,215 Returns for ICICI Prudential Regular Savings Fund
absolute basis & more than 1 year are on CAGR (Compound Annual Growth Rate) basis. as on 21 Oct 26 Duration Returns 1 Month -0.4% 3 Month 0.7% 6 Month 2.8% 1 Year 6.1% 3 Year 8.1% 5 Year 7.2% 10 Year 15 Year Since launch 8.2% Historical performance (Yearly) on absolute basis
Year Returns 2025 9.5% 2024 8.5% 2023 7.2% 2022 5.1% 2021 6.2% 2020 9.8% 2019 9.5% 2018 6.6% 2017 6.8% 2016 9.5% Fund Manager information for ICICI Prudential Regular Savings Fund
Name Since Tenure Manish Banthia 7 Nov 16 9.82 Yr. Akhil Kakkar 22 Jan 24 2.61 Yr. Data below for ICICI Prudential Regular Savings Fund as on 30 Sep 26
Asset Allocation
Asset Class Value Cash 1.22% Equity 9.41% Debt 89% Other 0.37% Debt Sector Allocation
Sector Value Corporate 67.04% Government 21.96% Cash Equivalent 1.22% Credit Quality
Rating Value A 8.28% AA 69.72% AAA 22% Top Securities Holdings / Portfolio
Name Holding Value Quantity Jtpm Metal TRaders Limited
Debentures | -4% ₹275 Cr 25,500
↑ 2,500 Embassy Office Parks REIT (Real Estate)
-, Since 30 Apr 25 | 5426023% ₹211 Cr 4,792,431
↓ -1,321 Vedanta Aluminium Metal Limited
Debentures | -3% ₹201 Cr 20,000 Adani Enterprises Limited
Debentures | -3% ₹200 Cr 20,000 TRuhome Finance Limited
Debentures | -3% ₹197 Cr 20,000 Bamboo Hotel And Global Centre (Delhi) Private Limited
Debentures | -3% ₹186 Cr 18,500 Adani Power Limited
Debentures | -3% ₹175 Cr 17,500 Nirma Limited
Debentures | -2% ₹150 Cr 15,000 Aavas Financiers Limited
Debentures | -2% ₹149 Cr 15,000 Hiranandani Financial Services Private Limited
Debentures | -2% ₹149 Cr 15,000 4. Nippon India Credit Risk Fund
Nippon India Credit Risk Fund
Growth Launch Date 8 Jun 05 NAV (21 Oct 26) ₹38.1473 ↓ -0.03 (-0.09 %) Net Assets (Cr) ₹1,708 on 30 Sep 26 Category Debt - Credit Risk AMC Nippon Life Asset Management Ltd. Rating ☆☆ Risk Moderate Expense Ratio 0.7 Sharpe Ratio 0.82 Information Ratio 0 Alpha Ratio 0 Min Investment 500 Min SIP Investment 100 Exit Load 0-12 Months (1%),12 Months and above(NIL) Yield to Maturity 0.09% Effective Maturity 2 Years 1 Month 13 Days Modified Duration 1 Year 9 Months 11 Days Growth of 10,000 investment over the years.
Date Value 30 Sep 21 ₹10,000 30 Sep 22 ₹10,356 30 Sep 23 ₹11,165 30 Sep 24 ₹12,066 30 Sep 25 ₹13,173 30 Sep 26 ₹14,075 Returns for Nippon India Credit Risk Fund
absolute basis & more than 1 year are on CAGR (Compound Annual Growth Rate) basis. as on 21 Oct 26 Duration Returns 1 Month -0.1% 3 Month 0.9% 6 Month 2.9% 1 Year 6.1% 3 Year 7.9% 5 Year 7% 10 Year 15 Year Since launch 6.5% Historical performance (Yearly) on absolute basis
Year Returns 2025 8.9% 2024 8.3% 2023 7.9% 2022 3.9% 2021 13.5% 2020 -5.9% 2019 1.9% 2018 6.1% 2017 7% 2016 10% Fund Manager information for Nippon India Credit Risk Fund
Name Since Tenure Kinjal Desai 25 May 18 8.28 Yr. Sushil Budhia 1 Feb 20 6.59 Yr. Amber Singhania 11 Mar 26 0.48 Yr. Data below for Nippon India Credit Risk Fund as on 30 Sep 26
Asset Allocation
Asset Class Value Cash 12.2% Debt 87.55% Other 0.25% Debt Sector Allocation
Sector Value Corporate 69.47% Government 19.93% Cash Equivalent 7.37% Securitized 2.98% Credit Quality
Rating Value A 18.79% AA 43.68% AAA 37.53% Top Securities Holdings / Portfolio
Name Holding Value Quantity Triumph Composites Private Limited
Debentures | -5% ₹80 Cr 8,000
↑ 500 Prospera Healthcorp Private Limited
Debentures | -4% ₹65 Cr 6,500
↑ 6,500 National Bank For Agriculture And Rural Development
Debentures | -3% ₹55 Cr 5,500 Adani Airport Holdings Limited
Debentures | -3% ₹54 Cr 5,500 Delhi International Airport Limited
Debentures | -3% ₹51 Cr 5,000 Samriddhi Trust**
Unlisted bonds | -3% ₹51 Cr 39
↑ 39 6.36% Govt Stock 2031
Sovereign Bonds | -3% ₹49 Cr 5,000,000
↑ 5,000,000 National Bank For Agriculture And Rural Development
Debentures | -3% ₹49 Cr 5,000 HDFC Bank Ltd.
Debentures | -3% ₹49 Cr 1,000 Muthoot Fincorp Limited
Debentures | -3% ₹45 Cr 45,000 5. Bandhan Government Securities Fund - Investment Plan
Bandhan Government Securities Fund - Investment Plan
Growth Launch Date 3 Dec 08 NAV (21 Oct 26) ₹37.5401 ↓ 0.00 (0.00 %) Net Assets (Cr) ₹1,686 on 30 Sep 26 Category Debt - Government Bond AMC IDFC Asset Management Company Limited Rating ☆☆☆ Risk Moderate Expense Ratio 1.14 Sharpe Ratio 0.36 Information Ratio 0 Alpha Ratio 0 Min Investment 5,000 Min SIP Investment 1,000 Exit Load NIL Yield to Maturity 5.29% Effective Maturity 1 Year 9 Months 25 Days Modified Duration 9 Months 14 Days Growth of 10,000 investment over the years.
Date Value 30 Sep 21 ₹10,000 30 Sep 22 ₹10,017 30 Sep 23 ₹10,679 30 Sep 24 ₹12,042 30 Sep 25 ₹12,338 30 Sep 26 ₹13,226 Returns for Bandhan Government Securities Fund - Investment Plan
absolute basis & more than 1 year are on CAGR (Compound Annual Growth Rate) basis. as on 21 Oct 26 Duration Returns 1 Month 0.1% 3 Month 0% 6 Month 3.4% 1 Year 6.3% 3 Year 7.7% 5 Year 5.8% 10 Year 15 Year Since launch 7.7% Historical performance (Yearly) on absolute basis
Year Returns 2025 3.7% 2024 10.6% 2023 6.8% 2022 1.4% 2021 2.1% 2020 13.7% 2019 13.3% 2018 7.8% 2017 3.1% 2016 13.9% Fund Manager information for Bandhan Government Securities Fund - Investment Plan
Name Since Tenure Suyash Choudhary 15 Oct 10 15.89 Yr. Brijesh Shah 10 Jun 24 2.22 Yr. Data below for Bandhan Government Securities Fund - Investment Plan as on 30 Sep 26
Asset Allocation
Asset Class Value Cash 86.53% Debt 13.47% Debt Sector Allocation
Sector Value Cash Equivalent 86.53% Government 13.47% Credit Quality
Rating Value AAA 100% Top Securities Holdings / Portfolio
Name Holding Value Quantity 7.36% Govt Stock 2052
Sovereign Bonds | -8% ₹130 Cr 13,500,000
↓ -500,000 7.3% Govt Stock 2053
Sovereign Bonds | -6% ₹101 Cr 10,500,000
↓ -14,500,000 Triparty Repo Trp_160926
CBLO/Reverse Repo | -86% ₹1,477 Cr Cash Margin - Ccil
CBLO/Reverse Repo | -0% ₹5 Cr Net Current Assets
Net Current Assets | -0% ₹0 Cr 6. SBI Credit Risk Fund
SBI Credit Risk Fund
Growth Launch Date 19 Jul 04 NAV (21 Oct 26) ₹49.6666 ↓ -0.06 (-0.13 %) Net Assets (Cr) ₹2,182 on 30 Sep 26 Category Debt - Credit Risk AMC SBI Funds Management Private Limited Rating ☆☆☆☆ Risk Moderate Expense Ratio 1.54 Sharpe Ratio 1.02 Information Ratio 0 Alpha Ratio 0 Min Investment 5,000 Min SIP Investment 500 Exit Load 0-12 Months (3%),12-24 Months (1.5%),24-36 Months (0.75%),36 Months and above(NIL) Yield to Maturity 8.86% Effective Maturity 2 Years 9 Months 18 Days Modified Duration 2 Years 25 Days Growth of 10,000 investment over the years.
Date Value 30 Sep 21 ₹10,000 30 Sep 22 ₹10,343 30 Sep 23 ₹11,197 30 Sep 24 ₹12,078 30 Sep 25 ₹13,072 30 Sep 26 ₹14,027 Returns for SBI Credit Risk Fund
absolute basis & more than 1 year are on CAGR (Compound Annual Growth Rate) basis. as on 21 Oct 26 Duration Returns 1 Month -0.4% 3 Month 0.9% 6 Month 3.3% 1 Year 6.4% 3 Year 7.6% 5 Year 6.9% 10 Year 15 Year Since launch 7.5% Historical performance (Yearly) on absolute basis
Year Returns 2025 7.9% 2024 8.1% 2023 8.3% 2022 4.2% 2021 5% 2020 9.8% 2019 6.5% 2018 6.2% 2017 6.9% 2016 10.5% Fund Manager information for SBI Credit Risk Fund
Name Since Tenure Lokesh Mallya 1 Feb 17 9.59 Yr. Prashanth Sridhar 1 Jul 26 0.17 Yr. Data below for SBI Credit Risk Fund as on 30 Sep 26
Asset Allocation
Asset Class Value Cash 8.12% Equity 6.04% Debt 82.28% Other 3.57% Debt Sector Allocation
Sector Value Corporate 71.19% Government 11.08% Cash Equivalent 8.12% Credit Quality
Rating Value A 11.07% AA 67.56% AAA 21.37% Top Securities Holdings / Portfolio
Name Holding Value Quantity H.G. Infra Engineering Limited
Debentures | -5% ₹102 Cr 10,000 Renew Solar Energy (Jharkhand Five) Private Limited
Debentures | -5% ₹100 Cr 11,000 Nj Capital Private Limited
Debentures | -5% ₹99 Cr 10,000 TATA Projects Limited
Debentures | -5% ₹99 Cr 10,000 Jtpm Metal TRaders Limited
Debentures | -4% ₹97 Cr 9,000 Lodha Developers Limited
Debentures | -4% ₹86 Cr 10,000 Renserv Global Private Limited
Debentures | -4% ₹80 Cr 8,000 Jsw Jfe Kalinga Steel Limited
Debentures | -4% ₹78 Cr 7,500 Aditya Birla Renewables Limited
Debentures | -3% ₹75 Cr 7,500 Motilal Oswal Home Finance Limited
Debentures | -3% ₹75 Cr 7,500 7. Kotak Medium Term Fund
Kotak Medium Term Fund
Growth Launch Date 25 Mar 14 NAV (21 Oct 26) ₹24.3593 ↓ -0.07 (-0.27 %) Net Assets (Cr) ₹1,912 on 30 Sep 26 Category Debt - Medium term Bond AMC Kotak Mahindra Asset Management Co Ltd Rating ☆☆☆ Risk Moderate Expense Ratio 1.63 Sharpe Ratio 0.01 Information Ratio 0 Alpha Ratio 0 Min Investment 5,000 Min SIP Investment 1,000 Exit Load 0-18 Months (2%),18 Months and above(NIL) Yield to Maturity 8.46% Effective Maturity 5 Years 2 Months 23 Days Modified Duration 2 Years 9 Months 7 Days Growth of 10,000 investment over the years.
Date Value 30 Sep 21 ₹10,000 30 Sep 22 ₹10,231 30 Sep 23 ₹10,806 30 Sep 24 ₹11,866 30 Sep 25 ₹12,847 30 Sep 26 ₹13,561 Returns for Kotak Medium Term Fund
absolute basis & more than 1 year are on CAGR (Compound Annual Growth Rate) basis. as on 21 Oct 26 Duration Returns 1 Month -0.8% 3 Month -0.1% 6 Month 2% 1 Year 4.1% 3 Year 7.6% 5 Year 6.2% 10 Year 15 Year Since launch 7.3% Historical performance (Yearly) on absolute basis
Year Returns 2025 8.9% 2024 9% 2023 6.1% 2022 3.2% 2021 4.7% 2020 8.5% 2019 7% 2018 5.4% 2017 6.6% 2016 10.9% Fund Manager information for Kotak Medium Term Fund
Name Since Tenure Deepak Agrawal 25 Mar 14 12.45 Yr. Vihag Mishra 1 Jun 25 1.25 Yr. Data below for Kotak Medium Term Fund as on 30 Sep 26
Asset Allocation
Asset Class Value Cash 5.24% Equity 9.76% Debt 84.69% Other 0.31% Debt Sector Allocation
Sector Value Corporate 74.51% Government 10.19% Cash Equivalent 5.24% Credit Quality
Rating Value A 8.22% AA 57.11% AAA 34.66% Top Securities Holdings / Portfolio
Name Holding Value Quantity Jtpm Metal TRaders Limited
Debentures | -6% ₹108 Cr 10,000 L&T Metro Rail (Hyderabad) Limited
Debentures | -5% ₹97 Cr 10,000 Bamboo Hotel And Global Centre (Delhi) Private Limited
Debentures | -5% ₹90 Cr 9,000 Adani Power Limited
Debentures | -5% ₹90 Cr 9,000 Embassy Office Parks REIT (Real Estate)
-, Since 31 May 21 | 5426024% ₹79 Cr 1,788,346 360 One Prime Limited
Debentures | -4% ₹75 Cr 7,500 Mas Financial Services Limited
Debentures | -4% ₹74 Cr 7,500 TATA Steel Limited
Debentures | -4% ₹74 Cr 750 Aditya Birla Renewables Limited
Debentures | -3% ₹60 Cr 6,000 Aditya Birla Real Estate Limited
Debentures | -3% ₹55 Cr 5,500 8. Axis Strategic Bond Fund
Axis Strategic Bond Fund
Growth Launch Date 28 Mar 12 NAV (21 Oct 26) ₹30.0241 ↓ -0.05 (-0.17 %) Net Assets (Cr) ₹1,972 on 30 Sep 26 Category Debt - Medium term Bond AMC Axis Asset Management Company Limited Rating ☆☆☆☆ Risk Moderate Expense Ratio 1.32 Sharpe Ratio 0.13 Information Ratio 0 Alpha Ratio 0 Min Investment 5,000 Min SIP Investment 1,000 Exit Load 0-12 Months (1%),12 Months and above(NIL) Yield to Maturity 8.72% Effective Maturity 4 Years 6 Months Modified Duration 3 Years 29 Days Growth of 10,000 investment over the years.
Date Value 30 Sep 21 ₹10,000 30 Sep 22 ₹10,302 30 Sep 23 ₹11,027 30 Sep 24 ₹12,003 30 Sep 25 ₹12,994 30 Sep 26 ₹13,750 Returns for Axis Strategic Bond Fund
absolute basis & more than 1 year are on CAGR (Compound Annual Growth Rate) basis. as on 21 Oct 26 Duration Returns 1 Month -0.4% 3 Month 0.1% 6 Month 2.3% 1 Year 4.8% 3 Year 7.5% 5 Year 6.5% 10 Year 15 Year Since launch 7.8% Historical performance (Yearly) on absolute basis
Year Returns 2025 8.2% 2024 8.7% 2023 7.3% 2022 3.8% 2021 5.2% 2020 10.5% 2019 7.1% 2018 6.7% 2017 7.5% 2016 11.6% Fund Manager information for Axis Strategic Bond Fund
Name Since Tenure Devang Shah 5 Nov 12 13.83 Yr. Sachin Jain 1 Feb 23 3.58 Yr. Akhil Thakker 1 Feb 23 3.58 Yr. Data below for Axis Strategic Bond Fund as on 30 Sep 26
Asset Allocation
Asset Class Value Cash 2.55% Equity 3.48% Debt 93.67% Other 0.3% Debt Sector Allocation
Sector Value Corporate 71.52% Government 22.15% Cash Equivalent 2.55% Credit Quality
Rating Value A 7.59% AA 55.74% AAA 36.67% Top Securities Holdings / Portfolio
Name Holding Value Quantity 6.94% Govt Stock 2036
Sovereign Bonds | -8% ₹176 Cr 17,750,000
↓ -5,500,000 Jubilant Beverages Limited
Debentures | -3% ₹73 Cr 6,500 GMR Hyderabad International Airport Ltd
Debentures | -3% ₹66 Cr 6,500 Tamilnadu State Development Loans
Sovereign Bonds | -3% ₹62 Cr 6,358,600 Jubilant Bevco Limited
Debentures | -3% ₹62 Cr 5,500 Vedanta Aluminium Metal Limited
Debentures | -3% ₹60 Cr 6,000 Adani Power Limited
Debentures | -3% ₹60 Cr 6,000 Delhi International Airport Limited
Debentures | -3% ₹56 Cr 5,500 Aditya Birla Digital Fashion Ventures Limited
Debentures | -3% ₹55 Cr 5,500 Hiranandani Financial Services Private Limited
Debentures | -2% ₹52 Cr 5,200
ਇਹ ਯਕੀਨੀ ਬਣਾਉਣ ਲਈ ਸਾਰੇ ਯਤਨ ਕੀਤੇ ਗਏ ਹਨ ਕਿ ਇੱਥੇ ਦਿੱਤੀ ਗਈ ਜਾਣਕਾਰੀ ਸਹੀ ਹੈ। ਹਾਲਾਂਕਿ, ਡੇਟਾ ਦੀ ਸ਼ੁੱਧਤਾ ਬਾਰੇ ਕੋਈ ਗਾਰੰਟੀ ਨਹੀਂ ਦਿੱਤੀ ਗਈ ਹੈ। ਕਿਰਪਾ ਕਰਕੇ ਕੋਈ ਵੀ ਨਿਵੇਸ਼ ਕਰਨ ਤੋਂ ਪਹਿਲਾਂ ਸਕੀਮ ਜਾਣਕਾਰੀ ਦਸਤਾਵੇਜ਼ ਨਾਲ ਤਸਦੀਕ ਕਰੋ।
You Might Also Like











AMFI Registration No. 112358 | CIN: U74999MH2016PTC282153
Shepard Technologies Pvt. Ltd. (with ARN code 112358) makes no warranties or representations, express or implied, on products offered through the platform. It accepts no liability for any damages or losses, however caused, in connection with the use of, or on the reliance of its product or related services. Terms and conditions of the website are applicable.
©2026 Shepard Technologies Private Limited. All Rights Reserved
Research Highlights for Aditya Birla Sun Life Credit Risk Fund