
 +91-22-48913909
மியூச்சுவல் ஃபண்ட் ரிட்டர்ன் கால்குலேட்டர்
மியூச்சுவல் ஃபண்ட் ரிட்டர்ன் கால்குலேட்டர் என்பது ஒரு ஸ்மார்ட் டூலைக் குறிக்கிறது, இது ஒரு குறிப்பிட்ட காலத்திற்கு முதலீடு எவ்வாறு வளர்கிறது என்பதைச் சரிபார்க்க உதவுகிறது. மக்களால் முடியும்மியூச்சுவல் ஃபண்டுகளில் முதலீடு செய்யுங்கள் லம்ப்சம் மூலம் அல்லதுஎஸ்ஐபி முறை. லம்ப்சம் பயன்முறையில், மக்கள் கணிசமான தொகையை ஒரு நீட்டிப்பில் முதலீடு செய்து ஒரு குறிப்பிட்ட காலத்திற்கு வைத்திருப்பார்கள். மாறாக, SIP முறையில் மக்கள் சீரான இடைவெளியில் சிறிய அளவில் முதலீடு செய்கிறார்கள். எனவே, எந்த முதலீட்டு முறையிலும் கால்குலேட்டர் முக்கிய பங்கு வகிக்கிறது. எனவே, மியூச்சுவல் ஃபண்ட் ரிட்டர்ன் கால்குலேட்டரின் முக்கியத்துவம், லம்ப்சம் மற்றும் எஸ்ஐபி இரண்டின் முக்கியத்துவம், அவற்றை எவ்வாறு பயன்படுத்துவது மற்றும்சிறந்த பரஸ்பர நிதிகள் முதலீட்டிற்கு.
மியூச்சுவல் ஃபண்ட் SIP கால்குலேட்டர்
சிப் கால்குலேட்டர் அவர்களின் நோக்கங்களை அடைவதற்கான காலக்கெடுவுடன் முதலீடு செய்ய வேண்டிய தொகையைத் தீர்மானிக்க உதவும் ஒரு ஸ்மார்ட் கருவியாகும். எப்படி என்பதையும் இது காட்டுகிறதுSIP முதலீடு ஒரு குறிப்பிட்ட காலத்தில் வளரும். SIP இலக்கு அடிப்படையிலான முதலீடு என அறியப்படுகிறது; SIP மூலம் மக்கள் வீடு வாங்குவது, வாகனம் வாங்குவது போன்ற பல்வேறு நோக்கங்களை அடைய திட்டமிட்டுள்ளனர்.ஓய்வூதிய திட்டமிடல், இன்னும் பற்பல. கீழே கொடுக்கப்பட்டுள்ள விளக்கப்படம், ஒரு குறிப்பிட்ட காலத்தில் SIP முதலீடு எவ்வாறு வளர்கிறது என்பதைக் காட்டுகிறது.
Know Your SIP Returns
விளக்கம்
- மாதாந்திர முதலீடு: INR 1,500
- முதலீட்டு காலம்: 12 ஆண்டுகள்
- முதலீடு செய்யப்பட்ட மொத்த தொகை: இந்திய ரூபாய் 2.16,000
- முதலீட்டில் எதிர்பார்க்கப்படும் நீண்ட கால வளர்ச்சி: 16% (தோராயமாக)
- எதிர்பார்க்கப்படும் நீண்ட காலவீக்கம்: 5% (தோராயமாக)
கீழே கொடுக்கப்பட்டுள்ள வரைபடம் 12 ஆண்டுகளில் மேலே குறிப்பிடப்பட்ட அளவுருக்கள் மூலம் SIP முதலீடு எவ்வாறு வளர்கிறது என்பதைக் காட்டுகிறது.
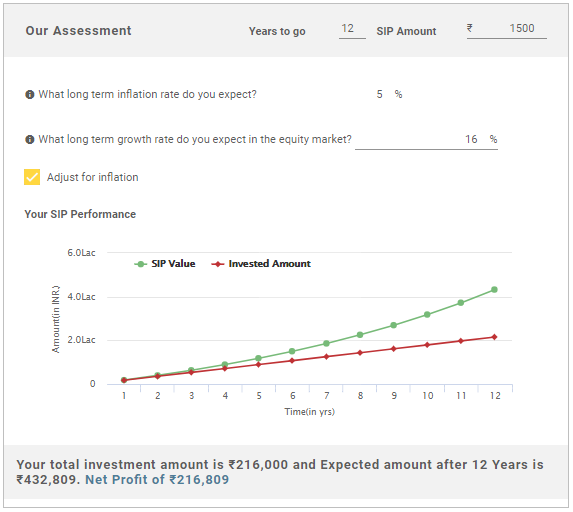
மேலே உள்ள படத்திலிருந்து, 12வது ஆண்டின் முடிவில், முதலீட்டின் மொத்த மதிப்பு 4,32,809 ரூபாயாகவும், முதலீட்டின் நிகர லாபம் INR 2,16,809 ஆகவும் இருக்கும் என்று கூறலாம்.
Talk to our investment specialist
மியூச்சுவல் ஃபண்ட் SIP கால்குலேட்டர் எப்படி வேலை செய்கிறது?
SIP கால்குலேட்டர் எவ்வாறு செயல்படுகிறது என்பதைச் சரிபார்க்க, சில விவரங்கள் அல்லது தொடர்புடைய தரவு உள்ளிட வேண்டிய கேள்விகள் உள்ளன. எனவே, SIP கால்குலேட்டர் எவ்வாறு செயல்படுகிறது என்பதைக் கண்டறிய பதிலளிக்க வேண்டிய கேள்விகளைப் பார்ப்போம்:
- முதலீட்டின் காலம் என்னவாக இருக்கும் அல்லது எவ்வளவு காலம் முதலீடு செய்ய திட்டமிட்டுள்ளீர்கள்.
- எவ்வளவு தொகையை முதலீடு செய்ய திட்டமிட்டுள்ளீர்கள்.
- ஈக்விட்டியில் நீங்கள் எதிர்பார்க்கும் வளர்ச்சி விகிதம்சந்தை நீண்ட காலத்திற்கு.
- நீண்ட காலத்திற்கு நீங்கள் எதிர்பார்க்கும் பணவீக்க விகிதம்.
கணக்கீடு செய்வதற்கு முன் கேள்விகள் தொடர்பான தரவுகளுடன் நீங்கள் தயாராக இருக்க வேண்டும். மக்களும் கிளிக் செய்கஅடுத்தது தேவையான இடங்களில் விவரங்களை உள்ளிட்ட பிறகு பொத்தான். எனவே, SIP தொடர்பான மியூச்சுவல் ஃபண்ட் ரிட்டர்ன் கால்குலேட்டரைப் பயன்படுத்துவதன் மூலம், மக்கள் எதிர்பார்க்கும் பதவிக்காலத்தின் முடிவில் அவர்களின் SIP மதிப்பு என்னவாக இருக்கும் என்பதை மதிப்பிடலாம்.
இப்போது, லம்ப்சம் கால்குலேட்டரை நோக்கி நம் கவனத்தை மாற்றுவோம்.
மியூச்சுவல் ஃபண்ட் லம்ப்சம் ரிட்டர்ன் கால்குலேட்டர்
மியூச்சுவல் ஃபண்டில் லம்ப்சம் முதலீடு என்பதைக் குறிக்கிறதுமுதலீடு கணிசமான அளவுபரஸ்பர நிதி ஒருமுறை செயலாக. கணிசமான அளவு மக்கள் தங்களிடம் கிடக்கின்றனர்வங்கி மொத்த தொகையை முதலீடு செய்ய கணக்கு தேர்வு செய்யலாம். லம்ப்சம் கால்குலேட்டருக்கும் SIP கால்குலேட்டருக்கும் வித்தியாசம் உள்ளது. லம்ப்சம் கால்குலேட்டர் ஒரு குறிப்பிட்ட காலப்பகுதியில் அவர்களின் ஒருமுறை முதலீடு எவ்வாறு வளர்கிறது என்பதை மதிப்பிடுவதற்கு மக்களுக்கு உதவுகிறது. எனவே, ஒரு குறிப்பிட்ட காலக்கெடுவில் லம்ப்சம் வருமானம் எவ்வாறு வளர்கிறது என்பதைப் புரிந்துகொள்வோம்.
விளக்கம்
- ஒருமுறை முதலீட்டுத் தொகை: இந்திய ரூபாய் 15,000
- முதலீட்டு காலம்: 12 ஆண்டுகள்
- முதலீடு செய்யப்பட்ட மொத்த தொகை: இந்திய ரூபாய் 15,000
- முதலீட்டில் எதிர்பார்க்கப்படும் நீண்ட கால வளர்ச்சி: 16% (தோராயமாக)
- எதிர்பார்க்கப்படும் நீண்ட கால பணவீக்கம்: 5% (தோராயமாக)
கீழே கொடுக்கப்பட்டுள்ள வரைபடம், 12 ஆண்டுகளில் மேலே குறிப்பிடப்பட்ட அளவுருக்கள் மூலம் லம்ப்சம் முதலீடு எவ்வாறு வளர்கிறது என்பதைக் காட்டுகிறது.
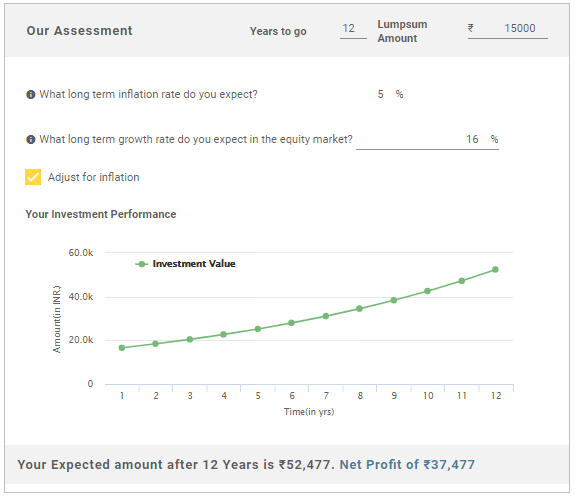
மேலே உள்ள படத்திலிருந்து, 12வது ஆண்டின் முடிவில், முதலீட்டின் மொத்த மதிப்பு 52,477 ரூபாயாகவும், முதலீட்டின் நிகர லாபம் INR 37,477 ஆகவும் இருக்கும் என்று கூறலாம்.
மியூச்சுவல் ஃபண்ட் லம்ப்சம் ரிட்டர்ன் கால்குலேட்டர் எப்படி வேலை செய்கிறது?
மியூச்சுவல் ஃபண்ட் லம்ப்சம் ரிட்டர்ன் கால்குலேட்டர் மற்றும் எஸ்ஐபி கால்குலேட்டரின் செயல்பாட்டு செயல்முறை ஒன்றுதான். இருப்பினும், இந்த சூழ்நிலையில் உள்ளவர்கள் SIP தொகைக்கு பதிலாக லம்ப்சம் முதலீட்டுத் தொகையை உள்ளிட வேண்டும். இருப்பினும், முதலீட்டு காலம், எதிர்பார்க்கப்படும் நீண்ட கால வளர்ச்சி விகிதம் மற்றும் எதிர்பார்க்கப்படும் நீண்ட கால பணவீக்கம் தொடர்பான மீதமுள்ள தரவு அப்படியே உள்ளது.இங்கேயும், கணக்கீடு செய்வதற்கு முன் கேள்விகள் தொடர்பான தரவுகளுடன் நீங்கள் தயாராக இருக்க வேண்டும் மற்றும் கிளிக் செய்யவும்அடுத்தது தேவையான இடங்களில் விவரங்களை உள்ளிட்ட பிறகு பொத்தான்.
எனவே, மியூச்சுவல் ஃபண்ட் கால்குலேட்டர்கள் இரண்டையும் லம்ப்சம் மற்றும் SIP முதலீட்டிற்குப் பயன்படுத்துவது எளிது என்று நாம் கூறலாம். ஆயினும்கூட, மக்கள் இரண்டையும் பயன்படுத்தலாம் ஆனால் எந்த முதலீடும் செய்வதற்கு முன்; திட்டத்தின் முறைகளை முழுமையாகப் புரிந்துகொள்வது அவசியம். கூடுதலாக, மக்கள் ஆலோசனை செய்யலாம்நிதி ஆலோசகர் தேவைப்பட்டால், அவர்களின் முதலீடு அவர்களுக்குத் தேவையான வருவாயைத் தருவதை உறுதிசெய்ய வேண்டும்.
2022க்கான சிறந்த நிதிகள்
* 3 ஆண்டு செயல்திறன் அடிப்படையில் சிறந்த நிதி.
"The primary investment objective of the Scheme is to seek capital appreciation by investing predominantly in units of MLIIF - WGF. The Scheme may, at the discretion of the Investment Manager, also invest in the units of other similar overseas mutual fund schemes, which may constitute a significant part of its corpus. The Scheme may also invest a certain portion of its corpus in money market securities and/or units of money market/liquid schemes of DSP Merrill Lynch Mutual Fund, in order to meet liquidity requirements from time to time. However, there is no assurance that the investment objective of the Scheme will be realized." Below is the key information for DSP World Gold Fund Returns up to 1 year are on The primary investment objective of the Scheme is to seek capital appreciation by investing predominantly in the units of BlackRock Global Funds – World Mining Fund. The Scheme may, at the discretion of the Investment Manager, also invest in the units of other similar overseas mutual fund schemes, which may
constitute a significant part of its corpus. The Scheme may also invest a certain portion of its corpus in money market securities and/or money market/liquid schemes of DSP BlackRock Mutual Fund, in order to meet liquidity requirements from time to time. Research Highlights for DSP World Mining Fund Below is the key information for DSP World Mining Fund Returns up to 1 year are on 1. DSP World Gold Fund
DSP World Gold Fund
Growth Launch Date 14 Sep 07 NAV (09 Sep 26) ₹64.5956 ↑ 0.65 (1.02 %) Net Assets (Cr) ₹1,441 on 31 Jul 26 Category Equity - Global AMC DSP BlackRock Invmt Managers Pvt. Ltd. Rating ☆☆☆ Risk High Expense Ratio 1.41 Sharpe Ratio 1.14 Information Ratio -0.56 Alpha Ratio 2.59 Min Investment 1,000 Min SIP Investment 500 Exit Load 0-12 Months (1%),12 Months and above(NIL) Growth of 10,000 investment over the years.
Date Value 31 Aug 21 ₹10,000 31 Aug 22 ₹7,679 31 Aug 23 ₹9,692 31 Aug 24 ₹12,678 31 Aug 25 ₹21,230 31 Aug 26 ₹37,198 Returns for DSP World Gold Fund
absolute basis & more than 1 year are on CAGR (Compound Annual Growth Rate) basis. as on 9 Sep 26 Duration Returns 1 Month 8.8% 3 Month 21.9% 6 Month 2.7% 1 Year 64.4% 3 Year 58.7% 5 Year 30.2% 10 Year 15 Year Since launch 10.3% Historical performance (Yearly) on absolute basis
Year Returns 2025 167.1% 2024 15.9% 2023 7% 2022 -7.7% 2021 -9% 2020 31.4% 2019 35.1% 2018 -10.7% 2017 -4% 2016 52.7% Fund Manager information for DSP World Gold Fund
Name Since Tenure Kaivalya Nadkarni 1 May 25 1.25 Yr. Data below for DSP World Gold Fund as on 31 Jul 26
Equity Sector Allocation
Sector Value Basic Materials 91.57% Asset Allocation
Asset Class Value Cash 6.38% Equity 91.78% Debt 0.01% Other 1.84% Top Securities Holdings / Portfolio
Name Holding Value Quantity BGF World Gold I2
Investment Fund | -66% ₹954 Cr 983,452 VanEck Gold Miners ETF
- | GDX28% ₹405 Cr 573,719 Treps / Reverse Repo Investments
CBLO/Reverse Repo | -4% ₹58 Cr Net Receivables/Payables
Net Current Assets | -2% ₹23 Cr 2. DSP World Mining Fund
DSP World Mining Fund
Growth Launch Date 29 Dec 09 NAV (09 Sep 26) ₹35.7585 ↑ 0.12 (0.34 %) Net Assets (Cr) ₹168 on 31 Jul 26 Category Equity - Global AMC DSP BlackRock Invmt Managers Pvt. Ltd. Rating ☆☆☆ Risk High Expense Ratio 1.14 Sharpe Ratio 1.67 Information Ratio 0 Alpha Ratio 0 Min Investment 1,000 Min SIP Investment 500 Exit Load 0-12 Months (1%),12 Months and above(NIL) Growth of 10,000 investment over the years.
Date Value 31 Aug 21 ₹10,000 31 Aug 22 ₹9,847 31 Aug 23 ₹11,099 31 Aug 24 ₹11,646 31 Aug 25 ₹14,040 31 Aug 26 ₹25,070 Returns for DSP World Mining Fund
absolute basis & more than 1 year are on CAGR (Compound Annual Growth Rate) basis. as on 9 Sep 26 Duration Returns 1 Month 6.1% 3 Month 10.9% 6 Month 15.6% 1 Year 72.3% 3 Year 32.6% 5 Year 20.5% 10 Year 15 Year Since launch 7.9% Historical performance (Yearly) on absolute basis
Year Returns 2025 79% 2024 -8.1% 2023 0% 2022 12.2% 2021 18% 2020 34.9% 2019 21.5% 2018 -9.4% 2017 21.1% 2016 49.7% Fund Manager information for DSP World Mining Fund
Name Since Tenure Kaivalya Nadkarni 1 May 25 1.25 Yr. Data below for DSP World Mining Fund as on 31 Jul 26
Equity Sector Allocation
Sector Value Basic Materials 93.15% Energy 1.01% Asset Allocation
Asset Class Value Cash 5.83% Equity 94.15% Debt 0.01% Top Securities Holdings / Portfolio
Name Holding Value Quantity BGF World Mining I2
Investment Fund | -96% ₹161 Cr 141,034 Treps / Reverse Repo Investments
CBLO/Reverse Repo | -3% ₹6 Cr Net Receivables/Payables
Net Current Assets | -1% ₹1 Cr
இங்கு வழங்கப்பட்ட தகவல்கள் துல்லியமானவை என்பதை உறுதிப்படுத்த அனைத்து முயற்சிகளும் மேற்கொள்ளப்பட்டுள்ளன. இருப்பினும், தரவுகளின் சரியான தன்மை குறித்து எந்த உத்தரவாதமும் அளிக்கப்படவில்லை. முதலீடு செய்வதற்கு முன் திட்டத் தகவல் ஆவணத்துடன் சரிபார்க்கவும்.








AMFI Registration No. 112358 | CIN: U74999MH2016PTC282153
Shepard Technologies Pvt. Ltd. (with ARN code 112358) makes no warranties or representations, express or implied, on products offered through the platform. It accepts no liability for any damages or losses, however caused, in connection with the use of, or on the reliance of its product or related services. Terms and conditions of the website are applicable.
©2026 Shepard Technologies Private Limited. All Rights Reserved
Research Highlights for DSP World Gold Fund