E-Gold Vs Gold ETFs- எது சிறந்த விருப்பம்?
மின்-தங்கம் Vs தங்க ப.ப.வ.நிதிகள்? எது சிறந்ததுதங்க முதலீடு விருப்பம்? எந்த அவென்யூவில் அதிக மகசூல் கிடைக்கும்? ஒருவரால் அடிக்கடி கேட்கப்படும் சில பொதுவான கேள்விகள் இவைமுதலீட்டாளர் இந்த உடல் அல்லாத தங்கத்தில் முதலீடு செய்ய விரும்புகிறேன். சரி, இரண்டு படிவங்களும் வர்த்தகத்தில் தனித்துவமானது, ஒவ்வொன்றும் வருமானம், வரிவிதிப்பு, வைத்திருக்கும் காலம் போன்ற அத்தியாவசிய அளவுருக்களில் அதன் சொந்த பலன்களைக் கொண்டுள்ளன. எனவே, தங்கம் இடிஎஃப்கள் மற்றும் ஈ-தங்கம் இரண்டும் எவ்வாறு வேறுபடுகின்றன மற்றும் எந்த வடிவத்தை உருவாக்குகின்றன என்பதைப் பார்ப்போம். ஒரு சிறந்த தங்க முதலீட்டு விருப்பம்!
மின்- தங்கம்
இ-கோல்டு என்பது நேஷனல் ஸ்பாட் எக்ஸ்சேஞ்ச் லிமிடெட் (என்எஸ்இஎல்) மூலம் தொடங்கப்பட்ட ஒரு தனித்துவமான தங்க முதலீட்டுத் தயாரிப்பு ஆகும். இந்த தயாரிப்பு முதலீட்டாளர்களுக்கு உதவுகிறதுதங்கம் வாங்க என்எஸ்இயின் வர்த்தக தளத்தில் மின்னணு வடிவத்தில் நீங்கள் வாங்கிய தங்கம் உங்களில் பிரதிபலிக்கும்டிமேட் கணக்கு.
E-கோல்டு என்பது முதலீட்டாளர்கள் 1gm, 2gm, 3gm போன்ற சிறிய மதிப்பில் தங்கத்தை வாங்க அனுமதிக்கும் அத்தகைய முதலீடு ஆகும். நீங்கள் இங்கு வாங்கும் தங்க அலகுகள் T+2 நாட்களில் உங்கள் டிமேட் கணக்கில் வரவு வைக்கப்படும். உதாரணமாக, நீங்கள் இன்று விற்றிருந்தால், அது உங்கள் டிமேட் கணக்கிலிருந்து 2 நாட்களில் (விற்பனை தேதியிலிருந்து) டெபிட் செய்யப்படும்.
தங்க ப.ப.வ.நிதிகளுடன் ஒப்பிடும்போது மின்-தங்கத்தின் விலை குறைவாக உள்ளது.இல்லை அந்த நிதியின் ஆனால் மின்-தங்கத்தின் விஷயத்தில், தற்போதைய தங்கத்தின் மதிப்பு.
தங்க ஈடிஎஃப்கள்
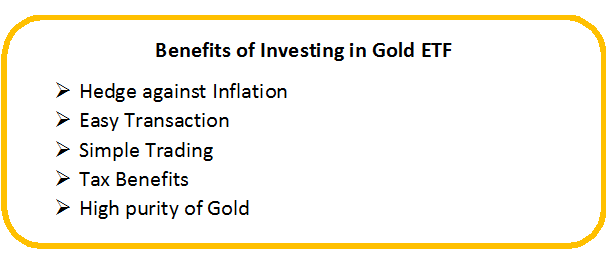
தங்க ப.ப.வ.நிதிகள் தங்க முதலீடுகளின் மிகவும் பிரபலமான முறைகளில் ஒன்றாக மாறியுள்ளது. தங்க ஈடிஎஃப்களும் கூடஅடிப்படை திறந்த தங்கம்பரஸ்பர நிதி உங்கள் பணத்தை தங்கத்தில் முதலீடு செய்ய உதவுகிறது. அடிப்படை தங்கத்தின் தூய்மை 99.5% ஆகும். தங்க ப.ப.வ.நிதிகள் காகித தங்கம் என்றும் அழைக்கப்படுகின்றன. இவை முக்கிய பங்குச் சந்தைகளில் பட்டியலிடப்பட்டு வர்த்தகம் செய்யப்படுகின்றன, மேலும் முதலீட்டாளர்களுக்கு அலகுகள் ஒதுக்கப்படுகின்றன, அங்கு ஒவ்வொரு யூனிட்டும் பொதுவாக ஒரு கிராம் தங்கத்தைக் குறிக்கும்.
தங்க ப.ப.வ.நிதிகளில், முதலீட்டாளர்கள் தங்களுக்கு இருக்கும் டிமேட் கணக்கில் வர்த்தகம் செய்யலாம். தங்க ஈடிஎஃப்கள் முதலீட்டாளர்களுக்கு தங்கத்தை அணுக பாதுகாப்பான வழியை வழங்குகிறதுசந்தை. என்ற பலனையும் வழங்குகிறார்கள்நீர்மை நிறை வர்த்தக காலத்தில் எந்த நேரத்திலும் வர்த்தகம் செய்யலாம்.
Talk to our investment specialist
E-Gold Vs Gold ETFகள்: முக்கிய வேறுபாடுகளை அறிந்து கொள்ளுங்கள்
வர்த்தக நேரம்
வார நாட்களில் காலை 9:00 மணி முதல் மாலை 3:30 மணி வரை மட்டுமே தங்க ப.ப.வ.நிதிகள் வர்த்தகம் செய்ய முடியும். அதேசமயம், வார நாட்களில் காலை 10:00 மணி முதல் இரவு 11:30 மணி வரை மின்-தங்கத்தை வர்த்தகம் செய்யலாம்.
உடல் வடிவத்திற்கு மாற்றம்
இரண்டு வடிவங்களையும் தங்கமாக மாற்றலாம், ஆனால் ஒவ்வொன்றின் குறைந்தபட்ச அளவு மாறுபடும். மின்-தங்கத்திற்கான குறைந்தபட்ச அளவு 8 கிராம், அதே சமயம் தங்கத்தில்-ETFஒரு குறிப்பிட்ட அளவு 500 கிராம் முதல் 1 கிலோ வரை அதிகமாக இருந்தால் மட்டுமே மாற்ற முடியும்.
மின்-தங்கம் மிகவும் விலை உயர்ந்தது
திறமையான வடிவம் மற்றும் தங்க ப.ப.வ.நிதிகளை விட தங்கத்தின் விலைகளை மிக நெருக்கமாக கண்டறிய முடியும். இருப்பினும், வரிவிதிப்புக்கு வரும்போது ஈ-தங்கம் தங்க ப.ப.வ.நிதிகளை இழக்கிறது.
ஆனால், இப்போது, இந்த இரண்டு படிவங்களுக்கிடையேயான முக்கிய வேறுபாடு உங்களுக்குத் தெரிந்தால், சிறந்த வருமானத்துடன் பாதுகாப்பான முதலீட்டை வழங்கும் அவென்யூவில் முதலீடு செய்யுங்கள்!
| அளவுருக்கள் | தங்க ஈடிஎஃப்கள் | மின்-தங்கம் |
|---|---|---|
| தனி டிமேட் கணக்கு | இல்லை | ஆம் |
| ஹோல்டிங்ஸ் | சொந்தமானAMCகள் | ஆம் |
| உடல் தங்கமாக மாற்றுதல் | குறைந்தபட்சம் 0.5-1 கிலோ | முதலீட்டாளர்கள் தங்க அலகுகளை நேரடியாக டிமேட் கணக்கில் வைத்திருக்கிறார்கள் |
| குறுகிய காலம்மூலதனம் ஆதாயங்கள் | 1 வருடத்திற்கும் குறைவானது - வருமானத்திற்கு 20% வரி | 3 வருடங்களுக்கும் குறைவானது - வருமானத்திற்கு 20% வரி |
| நீண்ட காலமுதலீட்டு வரவுகள் | 1 வருடம் கழித்து - 10% வரி வருமானம் | 3 ஆண்டுகளுக்குப் பிறகு - வருமானத்திற்கு 10% வரி |
| தொடர் செலவுகள் | 0.40% | 1% |
| திரும்புகிறது | மிக உயர்ந்தது, மிகவும் செலவு குறைந்ததாகும் | விட சற்று குறைவுதங்க ஈடிஎஃப் |
| விலை நிர்ணயம் | சர்வதேச தங்க விலையுடன் இணைக்கப்பட்டுள்ளது | இந்திய தங்கத்தின் விலையுடன் இணைக்கப்பட்டுள்ளது |
| நகைகளாக மாற்றவும் | கிடைக்கவில்லை | தேர்ந்தெடுக்கப்பட்ட நகைக்கடைகளில் கிடைக்கும் |
2022 முதலீடு செய்ய சிறந்த தங்க ப.ப.வ.நிதிகள்
முதலீடு செய்வதற்கான சில சிறந்த தங்க ப.ப.வ.நிதிகள் பின்வருமாறு:
An Open ended Fund of Funds Scheme with the investment objective to provide returns that tracks returns provided by Birla Sun Life Gold ETF (BSL Gold ETF). Below is the key information for Aditya Birla Sun Life Gold Fund Returns up to 1 year are on The investment objective of the Scheme is to seek to provide returns that closely correspond to returns provided by Reliance ETF Gold BeES. Research Highlights for Nippon India Gold Savings Fund Below is the key information for Nippon India Gold Savings Fund Returns up to 1 year are on The investment objective of the scheme is to generate returns by investing in units of Kotak Gold Exchange Traded Fund. Research Highlights for Kotak Gold Fund Below is the key information for Kotak Gold Fund Returns up to 1 year are on To generate returns that closely correspond to returns generated by Axis Gold ETF. Research Highlights for Axis Gold Fund Below is the key information for Axis Gold Fund Returns up to 1 year are on To seek capital appreciation by investing in units of HDFC Gold Exchange Traded Fund (HGETF). Research Highlights for HDFC Gold Fund Below is the key information for HDFC Gold Fund Returns up to 1 year are on 1. Aditya Birla Sun Life Gold Fund
Aditya Birla Sun Life Gold Fund
Growth Launch Date 20 Mar 12 NAV (19 Feb 26) ₹44.2829 ↑ 0.74 (1.69 %) Net Assets (Cr) ₹1,781 on 31 Jan 26 Category Gold - Gold AMC Birla Sun Life Asset Management Co Ltd Rating ☆☆☆ Risk Moderately High Expense Ratio 0.51 Sharpe Ratio 3.08 Information Ratio 0 Alpha Ratio 0 Min Investment 100 Min SIP Investment 100 Exit Load 0-365 Days (1%),365 Days and above(NIL) Growth of 10,000 investment over the years.
Date Value 31 Jan 21 ₹10,000 31 Jan 22 ₹9,602 31 Jan 23 ₹11,314 31 Jan 24 ₹12,322 31 Jan 25 ₹15,883 31 Jan 26 ₹31,280 Returns for Aditya Birla Sun Life Gold Fund
absolute basis & more than 1 year are on CAGR (Compound Annual Growth Rate) basis. as on 19 Feb 26 Duration Returns 1 Month 5.6% 3 Month 23.7% 6 Month 53.5% 1 Year 74.2% 3 Year 37.8% 5 Year 25.4% 10 Year 15 Year Since launch 11.3% Historical performance (Yearly) on absolute basis
Year Returns 2024 72% 2023 18.7% 2022 14.5% 2021 12.3% 2020 -5% 2019 26% 2018 21.3% 2017 6.8% 2016 1.6% 2015 11.5% Fund Manager information for Aditya Birla Sun Life Gold Fund
Name Since Tenure Priya Sridhar 31 Dec 24 1.09 Yr. Data below for Aditya Birla Sun Life Gold Fund as on 31 Jan 26
Asset Allocation
Asset Class Value Cash 2.07% Other 97.93% Top Securities Holdings / Portfolio
Name Holding Value Quantity Aditya BSL Gold ETF
- | -99% ₹1,770 Cr 122,558,766
↑ 14,664,583 Clearing Corporation Of India Limited
CBLO/Reverse Repo | -3% ₹45 Cr Net Receivables / (Payables)
Net Current Assets | -2% -₹34 Cr 2. Nippon India Gold Savings Fund
Nippon India Gold Savings Fund
Growth Launch Date 7 Mar 11 NAV (19 Feb 26) ₹58.5294 ↑ 1.13 (1.96 %) Net Assets (Cr) ₹7,160 on 31 Jan 26 Category Gold - Gold AMC Nippon Life Asset Management Ltd. Rating ☆☆ Risk Moderately High Expense Ratio 0.35 Sharpe Ratio 3.01 Information Ratio 0 Alpha Ratio 0 Min Investment 5,000 Min SIP Investment 100 Exit Load 0-1 Years (2%),1 Years and above(NIL) Growth of 10,000 investment over the years.
Date Value 31 Jan 21 ₹10,000 31 Jan 22 ₹9,635 31 Jan 23 ₹11,321 31 Jan 24 ₹12,369 31 Jan 25 ₹15,957 31 Jan 26 ₹31,222 Returns for Nippon India Gold Savings Fund
absolute basis & more than 1 year are on CAGR (Compound Annual Growth Rate) basis. as on 19 Feb 26 Duration Returns 1 Month 4.9% 3 Month 24.2% 6 Month 54% 1 Year 74% 3 Year 37.9% 5 Year 25.5% 10 Year 15 Year Since launch 12.5% Historical performance (Yearly) on absolute basis
Year Returns 2024 71.2% 2023 19% 2022 14.3% 2021 12.3% 2020 -5.5% 2019 26.6% 2018 22.5% 2017 6% 2016 1.7% 2015 11.6% Fund Manager information for Nippon India Gold Savings Fund
Name Since Tenure Himanshu Mange 23 Dec 23 2.11 Yr. Data below for Nippon India Gold Savings Fund as on 31 Jan 26
Asset Allocation
Asset Class Value Cash 1.5% Other 98.5% Top Securities Holdings / Portfolio
Name Holding Value Quantity Nippon India ETF Gold BeES
- | -100% ₹7,154 Cr 527,059,679
↑ 44,753,946 Triparty Repo
CBLO/Reverse Repo | -1% ₹36 Cr Net Current Assets
Net Current Assets | -0% -₹29 Cr Cash Margin - Ccil
CBLO/Reverse Repo | -0% ₹0 Cr Cash
Net Current Assets | -0% ₹0 Cr 00 3. Kotak Gold Fund
Kotak Gold Fund
Growth Launch Date 25 Mar 11 NAV (19 Feb 26) ₹58.7982 ↑ 1.21 (2.10 %) Net Assets (Cr) ₹6,556 on 31 Jan 26 Category Gold - Gold AMC Kotak Mahindra Asset Management Co Ltd Rating ☆ Risk Moderately High Expense Ratio 0.5 Sharpe Ratio 3.55 Information Ratio 0 Alpha Ratio 0 Min Investment 5,000 Min SIP Investment 1,000 Exit Load 0-6 Months (2%),6-12 Months (1%),12 Months and above(NIL) Growth of 10,000 investment over the years.
Date Value 31 Jan 21 ₹10,000 31 Jan 22 ₹9,630 31 Jan 23 ₹11,266 31 Jan 24 ₹12,247 31 Jan 25 ₹15,860 31 Jan 26 ₹29,505 Returns for Kotak Gold Fund
absolute basis & more than 1 year are on CAGR (Compound Annual Growth Rate) basis. as on 19 Feb 26 Duration Returns 1 Month 6% 3 Month 24.4% 6 Month 54.3% 1 Year 73.8% 3 Year 37.7% 5 Year 25.1% 10 Year 15 Year Since launch 12.6% Historical performance (Yearly) on absolute basis
Year Returns 2024 70.4% 2023 18.9% 2022 13.9% 2021 11.7% 2020 -4.7% 2019 26.6% 2018 24.1% 2017 7.3% 2016 2.5% 2015 10.2% Fund Manager information for Kotak Gold Fund
Name Since Tenure Abhishek Bisen 25 Mar 11 14.87 Yr. Jeetu Sonar 1 Oct 22 3.34 Yr. Data below for Kotak Gold Fund as on 31 Jan 26
Asset Allocation
Asset Class Value Cash 1.63% Other 98.37% Top Securities Holdings / Portfolio
Name Holding Value Quantity Kotak Gold ETF
- | -100% ₹6,544 Cr 502,813,962
↑ 31,071,029 Triparty Repo
CBLO/Reverse Repo | -1% ₹59 Cr Net Current Assets/(Liabilities)
Net Current Assets | -1% -₹47 Cr 4. Axis Gold Fund
Axis Gold Fund
Growth Launch Date 20 Oct 11 NAV (19 Feb 26) ₹44.5747 ↑ 0.96 (2.21 %) Net Assets (Cr) ₹2,835 on 31 Jan 26 Category Gold - Gold AMC Axis Asset Management Company Limited Rating ☆ Risk Moderately High Expense Ratio 0.5 Sharpe Ratio 3.44 Information Ratio 0 Alpha Ratio 0 Min Investment 5,000 Min SIP Investment 1,000 Exit Load 0-1 Years (1%),1 Years and above(NIL) Growth of 10,000 investment over the years.
Date Value 31 Jan 21 ₹10,000 31 Jan 22 ₹9,659 31 Jan 23 ₹11,397 31 Jan 24 ₹12,487 31 Jan 25 ₹16,126 31 Jan 26 ₹29,924 Returns for Axis Gold Fund
absolute basis & more than 1 year are on CAGR (Compound Annual Growth Rate) basis. as on 19 Feb 26 Duration Returns 1 Month 4.7% 3 Month 24.3% 6 Month 54.2% 1 Year 73.8% 3 Year 37.9% 5 Year 25.6% 10 Year 15 Year Since launch 11% Historical performance (Yearly) on absolute basis
Year Returns 2024 69.8% 2023 19.2% 2022 14.7% 2021 12.5% 2020 -4.7% 2019 26.9% 2018 23.1% 2017 8.3% 2016 0.7% 2015 10.7% Fund Manager information for Axis Gold Fund
Name Since Tenure Aditya Pagaria 9 Nov 21 4.23 Yr. Pratik Tibrewal 1 Feb 25 1 Yr. Data below for Axis Gold Fund as on 31 Jan 26
Asset Allocation
Asset Class Value Cash 2.53% Other 97.47% Top Securities Holdings / Portfolio
Name Holding Value Quantity Axis Gold ETF
- | -99% ₹2,810 Cr 215,661,784
↑ 19,832,646 Clearing Corporation Of India Ltd
CBLO/Reverse Repo | -1% ₹35 Cr Net Receivables / (Payables)
CBLO | -0% -₹9 Cr 5. HDFC Gold Fund
HDFC Gold Fund
Growth Launch Date 24 Oct 11 NAV (19 Feb 26) ₹45.6233 ↑ 0.85 (1.91 %) Net Assets (Cr) ₹11,458 on 31 Jan 26 Category Gold - Gold AMC HDFC Asset Management Company Limited Rating ☆ Risk Moderately High Expense Ratio 0.49 Sharpe Ratio 3.29 Information Ratio 0 Alpha Ratio 0 Min Investment 5,000 Min SIP Investment 300 Exit Load 0-6 Months (2%),6-12 Months (1%),12 Months and above(NIL) Growth of 10,000 investment over the years.
Date Value 31 Jan 21 ₹10,000 31 Jan 22 ₹9,641 31 Jan 23 ₹11,342 31 Jan 24 ₹12,349 31 Jan 25 ₹15,958 31 Jan 26 ₹30,476 Returns for HDFC Gold Fund
absolute basis & more than 1 year are on CAGR (Compound Annual Growth Rate) basis. as on 19 Feb 26 Duration Returns 1 Month 5% 3 Month 24.2% 6 Month 53.7% 1 Year 73.8% 3 Year 37.9% 5 Year 25.4% 10 Year 15 Year Since launch 11.2% Historical performance (Yearly) on absolute basis
Year Returns 2024 71.3% 2023 18.9% 2022 14.1% 2021 12.7% 2020 -5.5% 2019 27.5% 2018 21.7% 2017 6.6% 2016 2.8% 2015 10.1% Fund Manager information for HDFC Gold Fund
Name Since Tenure Arun Agarwal 15 Feb 23 2.96 Yr. Nandita Menezes 29 Mar 25 0.85 Yr. Data below for HDFC Gold Fund as on 31 Jan 26
Asset Allocation
Asset Class Value Cash 1.44% Other 98.56% Top Securities Holdings / Portfolio
Name Holding Value Quantity HDFC Gold ETF
- | -100% ₹11,455 Cr 840,685,437
↑ 92,026,020 Treps - Tri-Party Repo
CBLO/Reverse Repo | -1% ₹154 Cr Net Current Assets
Net Current Assets | -1% -₹152 Cr
ஆன்லைனில் தங்க மியூச்சுவல் ஃபண்டுகளில் முதலீடு செய்வது எப்படி?
Fincash.com இல் வாழ்நாள் முழுவதும் இலவச முதலீட்டுக் கணக்கைத் திறக்கவும்.
உங்கள் பதிவு மற்றும் KYC செயல்முறையை முடிக்கவும்
ஆவணங்களைப் பதிவேற்றவும் (PAN, ஆதார் போன்றவை).மேலும், நீங்கள் முதலீடு செய்ய தயாராக உள்ளீர்கள்!
இங்கு வழங்கப்பட்ட தகவல்கள் துல்லியமானவை என்பதை உறுதிப்படுத்த அனைத்து முயற்சிகளும் மேற்கொள்ளப்பட்டுள்ளன. இருப்பினும், தரவுகளின் சரியான தன்மை குறித்து எந்த உத்தரவாதமும் அளிக்கப்படவில்லை. முதலீடு செய்வதற்கு முன் திட்டத் தகவல் ஆவணத்துடன் சரிபார்க்கவும்.





Research Highlights for Aditya Birla Sun Life Gold Fund